1536
Comparison of interconnected basal ganglia probabilistic tractography between Parkinson's disease patients and controls
Jae-Hyuk Shim1 and Hyeon-Man Baek1
1Gachon University, Incheon, Republic of Korea
1Gachon University, Incheon, Republic of Korea
Synopsis
Basal ganglia structures, globus pallidus internal, globus pallidus external, subthalamic nucleus, substantia nigra, red nucleus and striatum were automatically segmented on 7T diffusion weighted images of controls and Parkinson's disease patients. Connectivity between each basal ganglia structure was observed using probabilistic tractography generated with FSL's diffusion tools such as BEDPOSTX and PROBTRACKX. Basal ganglia tractography was compared between controls and Parkinson's disease patients to observe the possible changes that could occur in tractography due to Parkinson's disease.
Introduction
Parkinson's disease (PD) pathology involves the death of dopaminergic neurons in the substantia nigra (SN), which slowly influences downstream basal ganglia pathways as dopamine transport diminishes1. As a result, basal ganglia structures such as globus pallidus external (GPe) and subthalamic nucleus (STN) show abnormal synaptic activation in PD patients due to lack of inhibition originally induced by dopamine. Previous studies have observed changes in individual structural connectivity of PD basal ganglia structures due to effects of dopamine loss and improvements to connectivity when treated with deep brain stimulation surgery (DBS)2,3. As such, documenting basal ganglia interconnectivity and comparing them between control and PD subjects should be beneficial in diagnosing changes that arise due to PD and PD treatments. For this study the 5 basal ganglia structures, GPe, globus pallidus internal (GPi), STN, SN, and the striatum of each control and PD patient were segmented using 7T T1w and T2w MRI images then compared for significant differences in volume. Subsequently, structural connectivity between each segmentation were generated through probabilistic tractography then compared between results generated from control and PD diffusion-weighted MRI images.Methods
7T MRI T1w, T2w images and diffusion weighted images of 4 control and 4 PD subjects were used for this study. Segmentation of left hemisphere basal ganglia structures, GPe, GPi, STN, SN, RN and the striatum was done through the default Lead-DBS pathway4. The T1w and T2w images were first bias corrected through the N4 algorithm then co-registered through SPM. Following the co-registration, the DISTAL atlas was normalized on the co-registered images through Lead-DBS custom ANTs normalization5. Segmentations were overlaid on top of T1w and T2w images to check for accuracy as shown in figure 1. Each segmented structure was registered through SPM12 to its respective subject's 7T diffusion-weighted MRI data, which were preprocessed through eddy correction and BEDPOSTX6,7. Following the registration, probabilistic tractography of each registered structure and between registered structures were generated through PROBTRACKX8. Each fiber count generated from probabilistic tractography were normalized by dividing the fiber count by the voxel of the seed structure, then averaged within control and PD groups. The differences in basal ganglia structure volume and fiber count averages were compared using one-way ANOVA, with Benjamini-Hochberg procedure to correct for multiple comparisons with significance at p = 0.05.Results
Figure 1 shows the 5 basal ganglia structures segmented by Lead-DBS, overlaid on top of 7T T1w and T2w images for validation. The segmentations matched the intensities of segmentation targets, confirming that segmentation was mostly successful. Table 1 shows the group-wise differences of basal ganglia volumes between control and PD subjects. There was no significant difference between volumes after correcting for multiple comparisons. Table 2 shows the group-wise differences of basal ganglia interconnectivity between control and PD subjects. There was one significant difference in tractography between GPe and STN (p=0.03) after correcting for multiple comparisons. Figure 2 shows the 3D tractography between GPe and STN.Discussion
In this study, the 5 basal ganglia structures involved in Parkinson's disease were successfully segmented on 7T control and PD MRI images. Probabilistic tractography was also generated between the segmentations to determine the connectivity of basal ganglia represented by probabilistic fibers. Previous studies on basal ganglia nuclei of PD subjects showed significant decrease in volume of basal ganglia nuclei9. Additionally, studies observing white matter fibers connecting each basal ganglia nuclei showed loss of structural connectivity in PD subjects, which were represented by probabilistic tractography2. This study initially showed significant differences in volume of basal ganglia nuclei of control and PD subjects but no results survived correction for multiple comparisons. However, the group-wise comparisons of interconnectivity in basal ganglia nuclei of control and PD subjects showed significant decrease in fiber counts connecting GPe and STN in PD subjects. Results regarding the structural connectivity between GPe and STN are consistent with previous studies that observed altered connectivity network of GPe and STN in PD mouse models10. Many studies have described abnormal synchronous oscillations of signals GPe and STN that arise due to dopamine deficiencies, which contributes to PD motor symptoms11. It is possible that the significant reduction in probabilistic tractography of GPe and STN can visualize the altered connectivity that arise from PD, and may be correlated with synchronous oscillations originating from GPe and STN.Conclusion
This study was able to segment basal ganglia nuclei involved in PD using 7T MRI T1w images, then generate probabilistic tractography between the segmentations from 7T MRI diffusion-weighted images to observe significant differences of structural connectivity between control and PD subjects. The results showed significant differences in probabilistic tractography of GPe and STN between control and PD subjects. Future studies with similar methods can be done with more subjects and possibly PD subjects treated with treatments such as deep brain stimulation surgery for further evaluating significant visual changes that arise due to PD or PD treatments.Acknowledgements
This research was supported by the Brain Research Program through the National Research Foundation of Korea (NRF) funded by the Ministry of Science and ICT (NRF-2017M3C7A1044367).References
1. Galvan A, Wichmann T. Pathophysiology of parkinsonism. Clinical neurophysiology. 2008; 119:1459-74. 2. Bonilha L, Nesland T, Martz GU, Joseph JE, Spampinato MV, Edwards JC, Tabesh A. Medial temporal lobe epilepsy is associated with neuronal fibre loss and paradoxical increase in structural connectivity of limbic structures. J Neurol Neurosurg Psychiatry. 2012; 83:903-9. 3. Van Hartevelt TJ, Cabral J, Deco G, Møller A, Green AL, Aziz TZ, Kringelbach ML. Neural plasticity in human brain connectivity: the effects of long term deep brain stimulation of the subthalamic nucleus in Parkinson’s disease. PloS one. 2014; 9:e86496. 4. Horn A and Kühn AA. Lead-DBS: a toolbox for deep brain stimulation electrode localizations and visualizations. Neuroimage 2015;107:27-135. 5. Avants BB, Epstein CL, Grossman M, Gee JC. Symmetric diffeomorphic image registration with cross-correlation: evaluating automated labeling of elderly and neurodegenerative brain. Medical image analysis. 2008; 12:26-41. 6. Andersson JL, Sotiropoulos SN. An integrated approach to correction for off-resonance effects and subject movement in diffusion MR imaging. Neuroimage 2016;125:1063-1078. 7. Jbabdi S, Sotiropoulos SN, Savio AM, et al. Model‐based analysis of multishell diffusion MR data for tractography: How to get over fitting problems. Magnetic Resonance in Medicine. 2012;68(6):1846-1855. 8. Behrens TE, Woolrich MW, Jenkinson M, et al. Characterization and propagation of uncertainty in diffusion‐weighted MR imaging. Magnetic Resonance in Medicine: An Official Journal of the International Society for Magnetic Resonance in Medicine. 2003;50(5):1077-1088. 9. Lisanby SH, McDonald WM, Massey EW, et al. Diminished subcortical nuclei volumes in Parkinson's disease by MR imaging. Journal of neural transmission. Supplementum. 1993;40:13-21. 10. Kovaleski RF, Callahan J, Chazalon M, et al. Dysregulation of external globus pallidus-subthalamic nucleus network dynamics in Parkinsonian mice. BioRxiv. 2019 Jan 1:774091. 11. Levy R, Ashby P, Hutchison WD, et al. Dependence of subthalamic nucleus oscillations on movement and dopamine in Parkinson’s disease. Brain. 2002 Jun 1;125(6):1196-209.Figures
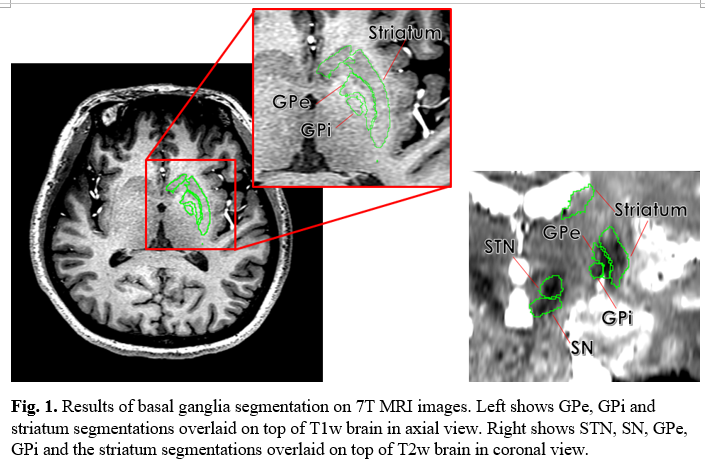
Fig.
1. Results
of basal ganglia segmentation on 7T MRI images. Left shows GPe, GPi and
striatum segmentations overlaid on top of T1w brain in axial view. Right shows STN,
SN, GPe, GPi and the striatum segmentations overlaid on top of T2w brain in
coronal view.
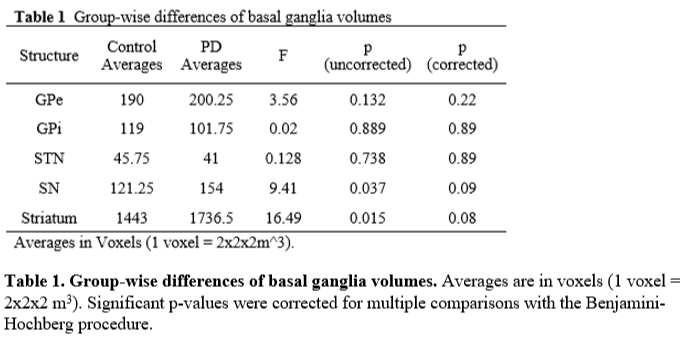
Table
1. Group-wise differences of basal ganglia volumes. Averages
are in voxels (1 voxel = 2x2x2 m3). Significant p-values were
corrected for multiple comparisons with the Benjamini-Hochberg procedure.
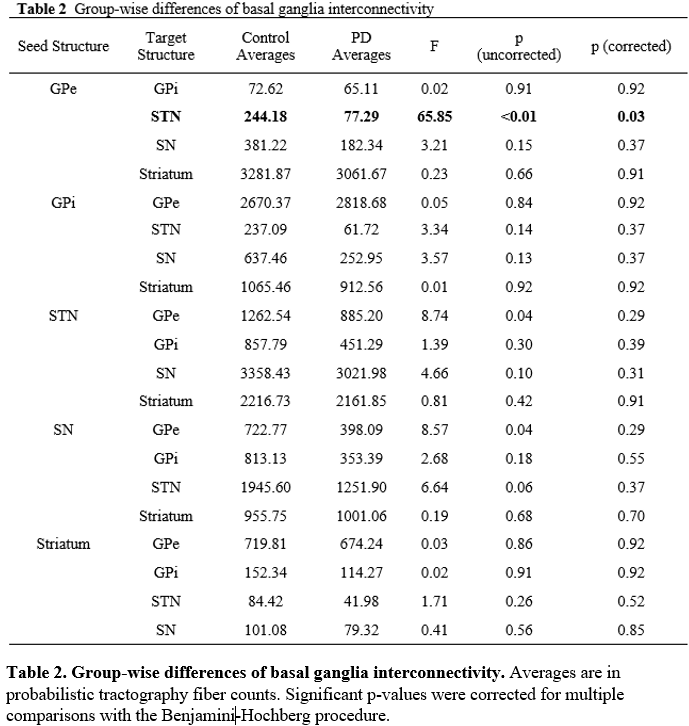
Table
2. Group-wise differences of basal ganglia interconnectivity. Averages
are in probabilistic tractography fiber counts. Significant p-values were
corrected for multiple comparisons with the Benjamini-Hochberg procedure.
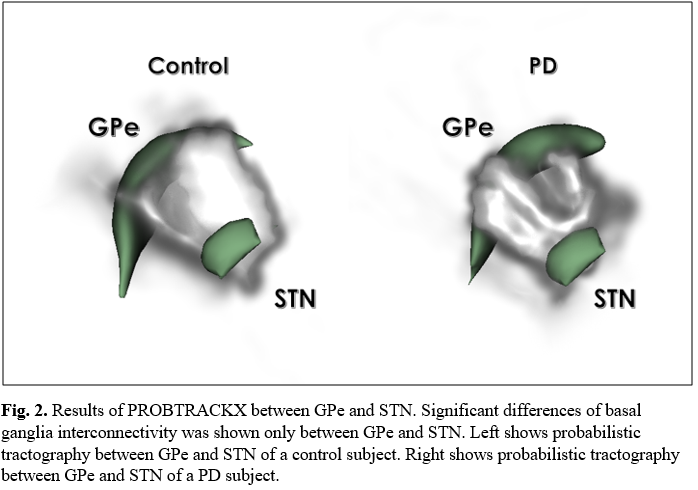
Fig.
2. Results
of PROBTRACKX between GPe and STN. Significant differences of basal ganglia
interconnectivity was shown only between GPe and STN. Left shows probabilistic tractography
between GPe and STN of a control subject. Right shows probabilistic
tractography between GPe and STN of a PD subject.