1535
White Matter Plasticity in Newly Diagnosed Parkinson’s Disease With/Without Mild Cognitive Impairment1Department of Radiology, Juntendo University Graduate School of Medicine, Tokyo, Japan, 2Department of Radiological Sciences, Graduate School of Human Health Sciences, Tokyo Metropolitan University, Tokyo, Japan, 3Department of Radiology, Graduate School of Medicine, The University of Tokyo, Graduate School of Medicine, Tokyo, Japan, 4Department of Radiology, Toho University Omori Medical Center, Tokyo, Japan
Synopsis
We evaluated the white matter (WM) of patients with newly diagnosed Parkinson’s disease (PD) with normal cognition (PD-NC) and mild cognitive impairment (PD-MCI) using diffusion tensor imaging (DTI) and free-water elimination DTI. Increased fractional anisotropy and decreased mean diffusivity and radial diffusivity in patients with PD suggested compensatory neural circuit reorganization. Changes were less extensive in WM areas previously considered vulnerable to MCI in the PD-MCI group than in the PD-NC group. Longitudinal analyses indicated neural compensation in the PD-NC group after 1 year. Overall, extensive and long compensatory mechanisms may be associated with preserved cognitive function in PD.
INTRODUCTION
Mild cognitive impairment (MCI) is a common non-motor feature of Parkinson’s disease (PD), even in the earliest disease stages.1 PD-MCI is associated with a high risk of dementia, which can substantially affect the quality of life. Diffusion tensor imaging (DTI) studies have revealed white matter (WM) alterations in patients with PD-MCI.2-5 However, the precise trajectory of WM pathology of these cognitive impairments in PD, particularly in newly diagnosed patients, remains unclear. The present study aimed to investigate the WM microstructural changes in patients with newly diagnosed PD with and without MCI at baseline and 1-year follow-up. Besides DTI, we performed free-water elimination (FWE)-DTI to exclude bias from extracellular free-water on DTI metrics.6METHODS
All participants were from the Parkinson’s Progression Markers Initiative (PPMI, http://www.ppmi-info.org/). We evaluated diffusion magnetic resonance imaging (MRI) data from 82 drug-naïve patients with PD [18 with MCI and 84 with normal cognition (NC)] and 35 healthy controls (HC; Table 1). Patients were categorized as PD-MCI if the score of the Montreal Cognitive Assessment (MoCA) was less than 26.7 At 1-year follow-up, diffusion MRI scans were available for 16 patients with PD-MCI, 51 with PD-NC, and 16 HC. Diffusion MRI data were collected with 3T Siemens scanners using the following parameters: b = 1000 s/mm2; 64 diffusion gradient directions with one b0 image; matrix = 116×116×72; flip angle = 90°; and voxel resolution = 1.98×1.98×2.0 mm. DTI [fractional anisotropy (FA), mean diffusivity (MD), axial diffusivity (AD), and radial diffusivity (RD)] maps were generated using the DTIFIT tool. An in-house MATLAB script was used to generate FWE-DTI maps (FAT, MDT, ADT, and RDT) and fractional volume of free water (FW).8 Tract-based spatial statistics (TBSS)9 analysis in FSL10 was used to evaluate the group effect at baseline (HC vs. PD-NC vs. PD-MCI) and the time interaction (baseline vs. follow-up). Maps showing significant clusters on TBSS at baseline were localized using ICBM-DTI-81 WM labels and tractography atlases. According to the WM areas considered to be implicated in PD-MCI,2-5 27 WM areas [left and right anterior thalamic radiation; cingulum cingulate gyrus; cingulum hippocampus; inferior frontooccipital fasciculus (IFOF); inferior (ILF) and superior (SLF) longitudinal fasciculus; uncinate fasciculus (UF); cerebral peduncle (CP); anterior and posterior limb of the internal capsule; anterior and superior corona radiata; and genu, body, and splenium of the corpus callosum (CC)] were selected as regions of interest (ROIs). Mean values within each ROI were compared between groups using the Kruskal–Wallis test followed by false discovery rate correction (FDR) and Mann–Whitney Utests to detect significant main effects in any area with significant FDR-corrected P-values. P < 0.05 was considered the threshold of statistical significance in all analyses.RESULTS
At baseline, compared with the controls, the PD-NC group showed significantly (P < 0.05, family-wise error-corrected) higher FA and FAT and lower MD, MDT, RD, and RDT, and the PD-MCI group showed higher FA and FAT and lower MDT and RDT (Fig. 1). There were no significant differences between the PD-NC and PD-MCI groups and difference in FW between groups. Changes in DTI and FWE-DTI parameters were less in patients with PD-MCI than in those with PD-NC, with relative sparing of the middle temporal and midbrain regions (Fig. 1). Results of the ROI analysis of WM areas showed similar patterns as those for TBSS (Tables 2-3). The internal capsule, corona radiata, and CP were consistently spared in patients with PD-MCI. On comparing baseline and 1-year data, patients with PD-NC showed increased FA and FAT and decreased MD, MDT, AD, ADT, and RD in WM areas, including the CC, forceps major and minor, some projection fibers, including the thalamic radiation, corona radiata, and internal capsule, and some association fibers, including the external capsule, UF, ILF, SLF, IFOF, and cingulum (Fig. 2). However, no significant differences were found between baseline and follow-up data in PD-MCI and control groups.DISCUSSION
Consistent with previous findings,11 our study demonstrated higher FA and lower MD and RD in patients with PD than in controls. Recent studies have shown increased FA in the substantia nigra12 and motor tracts.13 The increased FA and decreased MD and RD in the WM of patients with PD might suggest selective neurodegeneration.13 Alternatively, these findings might reflect early compensatory reorganization of neural circuits.13 This is in agreement with the view proposed by Brotchie and Fitzer-Attas14 that one manifestation of the compensation for dopaminergic deficiency might be structural remodeling of neural circuitry. Interestingly, the diffusion parameter changes were less extensive in WM areas, which were previously considered to be implicated in PD-MCI,2-5 among patients with PD-MCI than among those with PD-NC. Our longitudinal analyses indicated neural compensation among patients with PD-NC after 1 year in WM areas that were previously shown to have neural plasticity in early PD.11 All these findings suggest that extensive and long compensatory mechanisms are associated with preserved cognitive function in PD. Compensatory mechanisms have indeed been shown to potentially postpone and reduce the severity of parkinsonian symptoms.14CONCLUSION
Alterations in DTI and FWE-DTI parameters might be interpreted as manifestations of neural compensation in the early stage of PD. Our findings indicate that neural compensatory mechanisms are associated with preserved cognitive function in PD.Acknowledgements
All authors report no conflict of interest.References
- Aarsland D, Bronnick K, Williams-Gray C, et al. Mild cognitive impairment in Parkinson disease: a multicenter pooled analysis. Neurology 2010;75:1062-9
- Agosta F, Canu E, Stefanova E, et al. Mild cognitive impairment in Parkinson's disease is associated with a distributed pattern of brain white matter damage. Hum Brain Mapp 2014;35:1921-9
- Deng B, Zhang Y, Wang L, et al. Diffusion tensor imaging reveals white matter changes associated with cognitive status in patients with Parkinson's disease. Am J Alzheimers Dis Other Demen 2013;28:154-64
- Hattori T, Orimo S, Aoki S, et al. Cognitive status correlates with white matter alteration in Parkinson's disease.Hum Brain Mapp 2012;33:727-39
- Melzer TR, Watts R, MacAskill MR, et al. White matter microstructure deteriorates across cognitive stages in Parkinson disease. Neurology 2013;80:1841-9
- Pasternak O, Westin CF, Bouix S, et al. Excessive extracellular volume reveals a neurodegenerative pattern in schizophrenia onset. J Neurosci 2012;32:17365-72
- Dalrymple-Alford JC, MacAskill MR, Nakas CT, et al. The MoCA: well-suited screen for cognitive impairment in Parkinson disease. Neurology 2010;75:1717-25
- Pasternak O, Sochen N, Gur Y, et al. Free water elimination and mapping from diffusion MRI. Magn Reson Med 2009;62:717-30
- Smith SM, Jenkinson M, Johansen-Berg H, et al. Tract-based spatial statistics: voxelwise analysis of multi-subject diffusion data. Neuroimage 2006;31:1487-505
- Jenkinson M, Bannister P, Brady M, et al. Improved optimization for the robust and accurate linear registration and motion correction of brain images. Neuroimage 2002;17:825-41
- Wen MC, Heng HS, Ng SY, et al. White matter microstructural characteristics in newly diagnosed Parkinson's disease: An unbiased whole-brain study. Sci Rep 2016;6:35601
- Lenfeldt N, Larsson A, Nyberg L, et al. Diffusion measures in early stage parkinsonism: controversial findings including hemispheric lateralisation. Parkinsonism Relat Disord 2013;19:469-71
- Mole JP, Subramanian L, Bracht T, et al. Increased fractional anisotropy in the motor tracts of Parkinson's disease suggests compensatory neuroplasticity or selective neurodegeneration. Eur Radiol 2016;26:3327-35
- Brotchie J, Fitzer-Attas C. Mechanisms compensating for dopamine loss in early Parkinson disease. Neurology 2009;72:S32-8
Figures
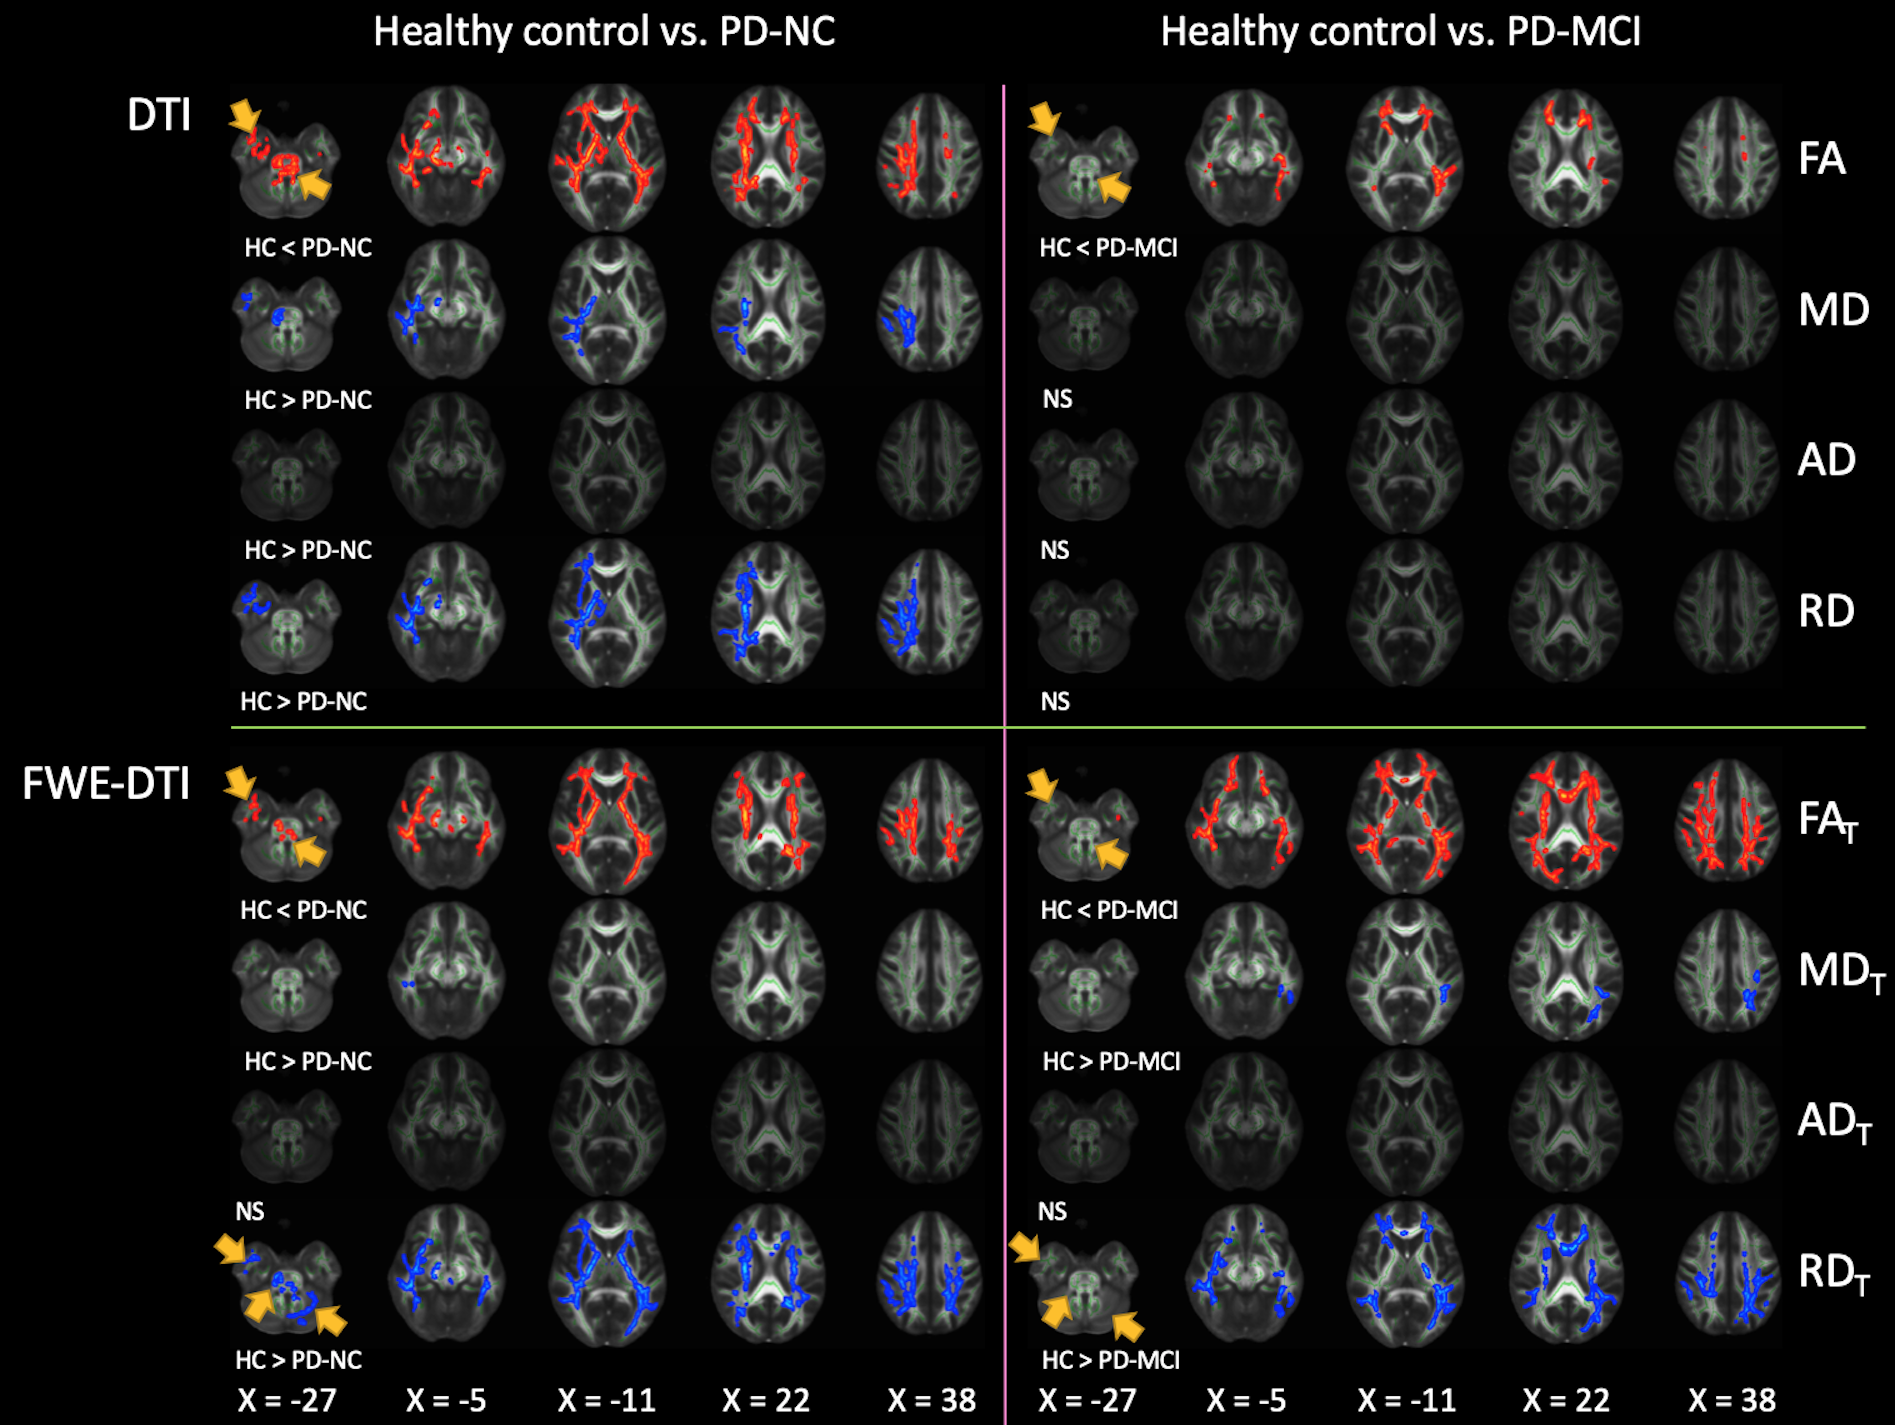
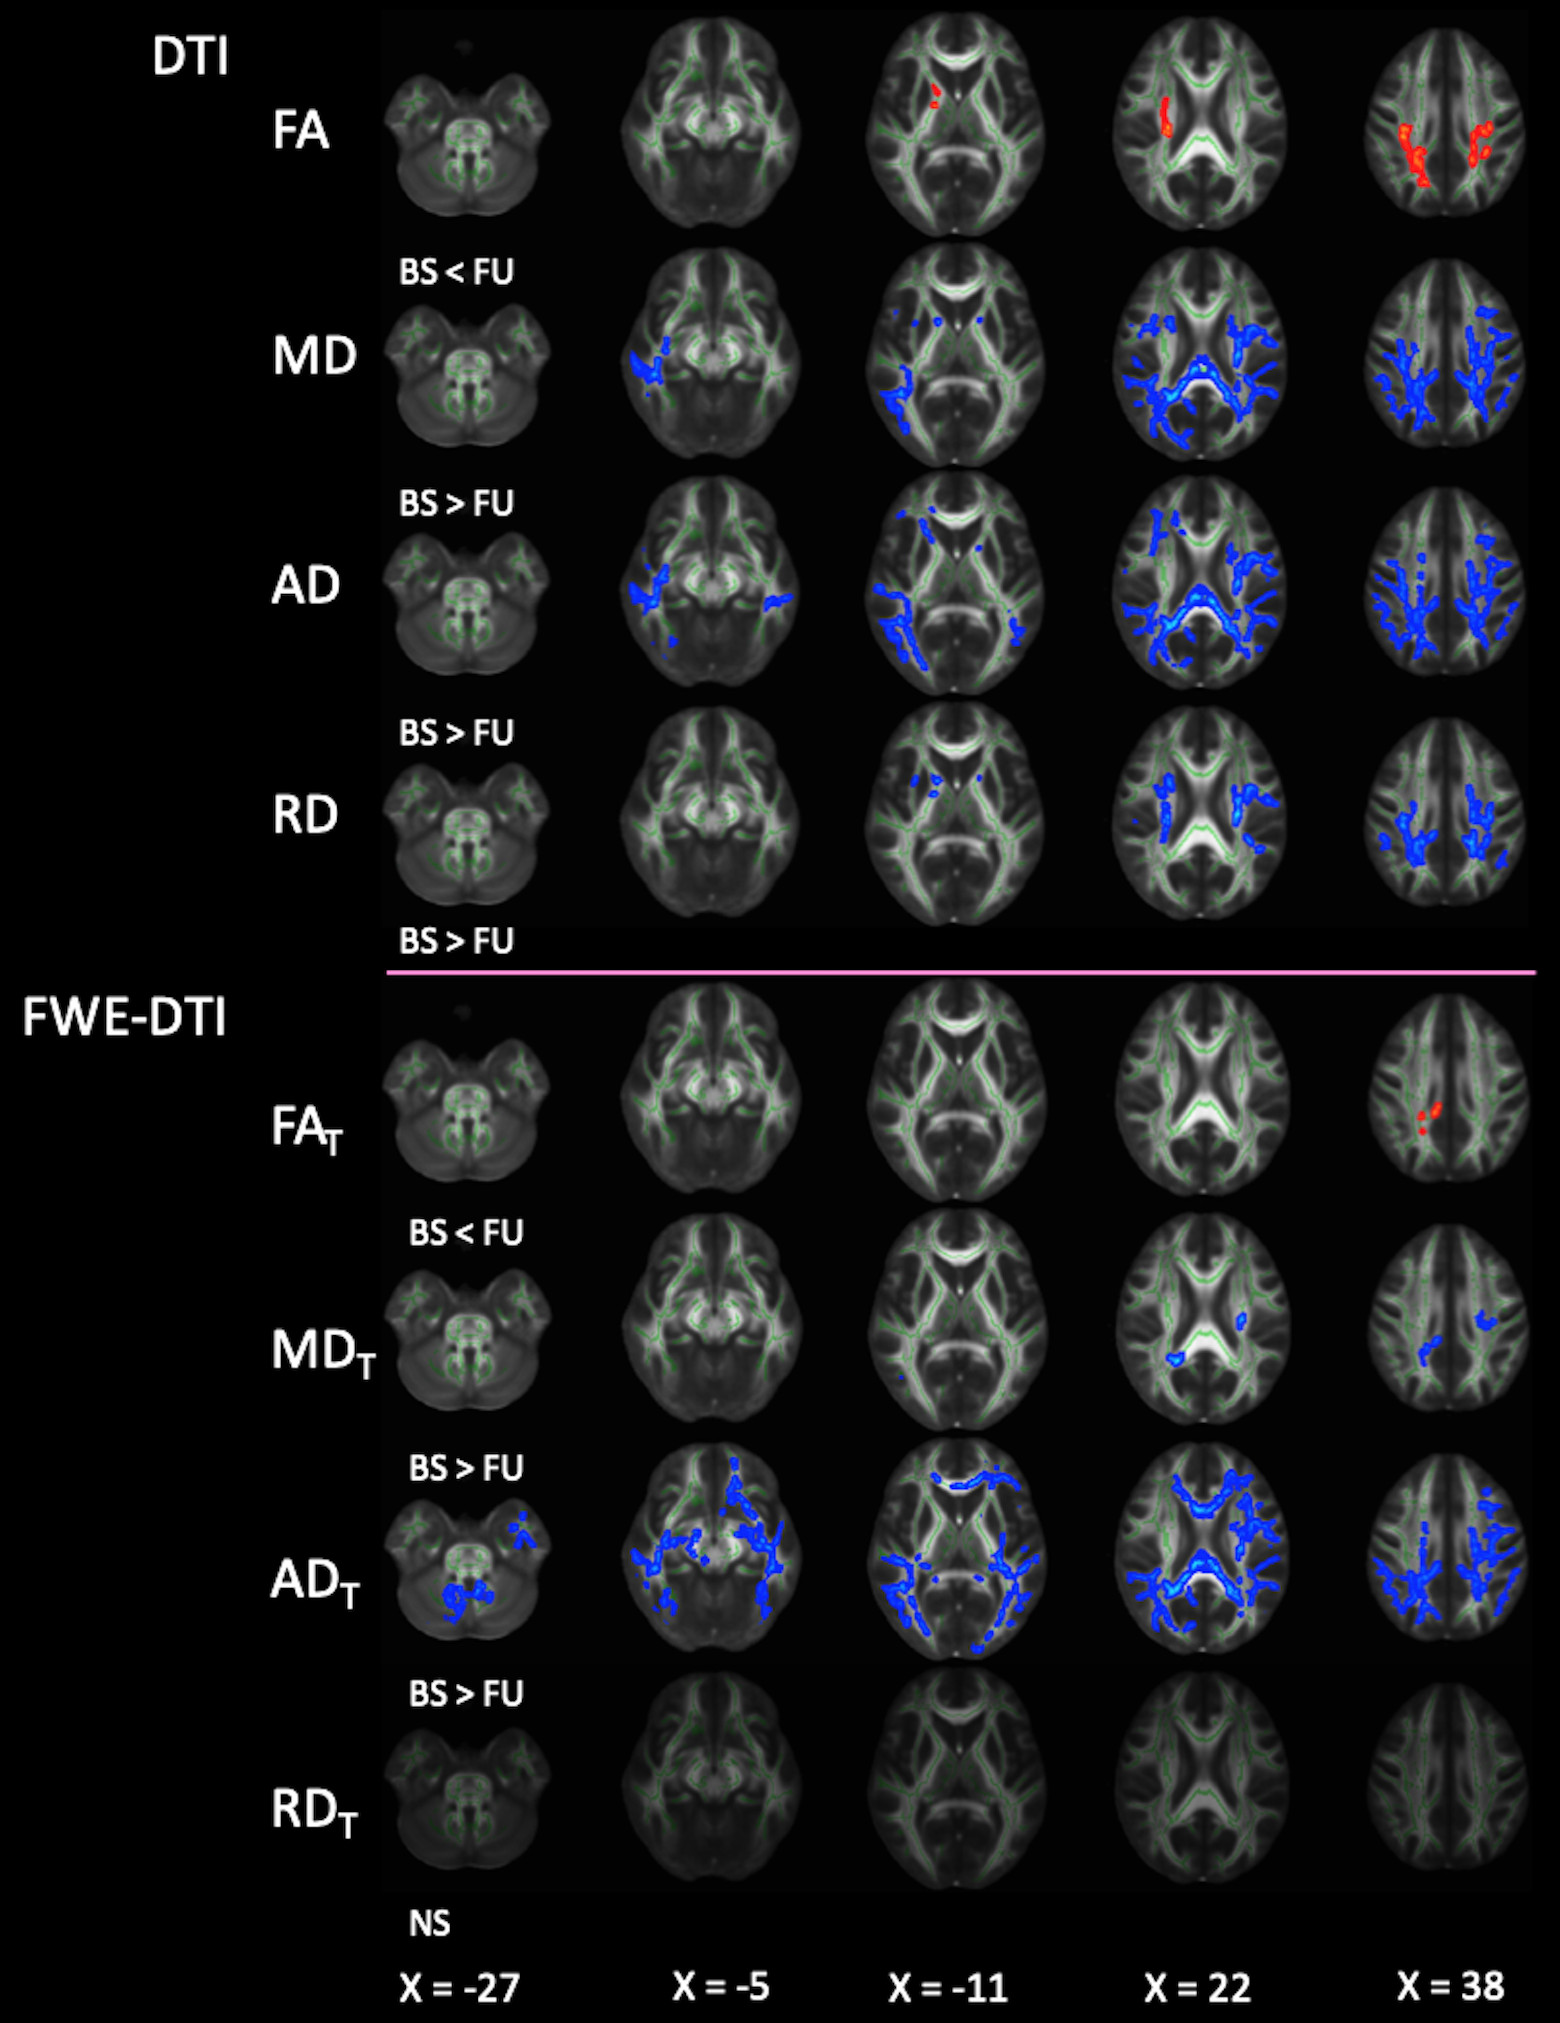
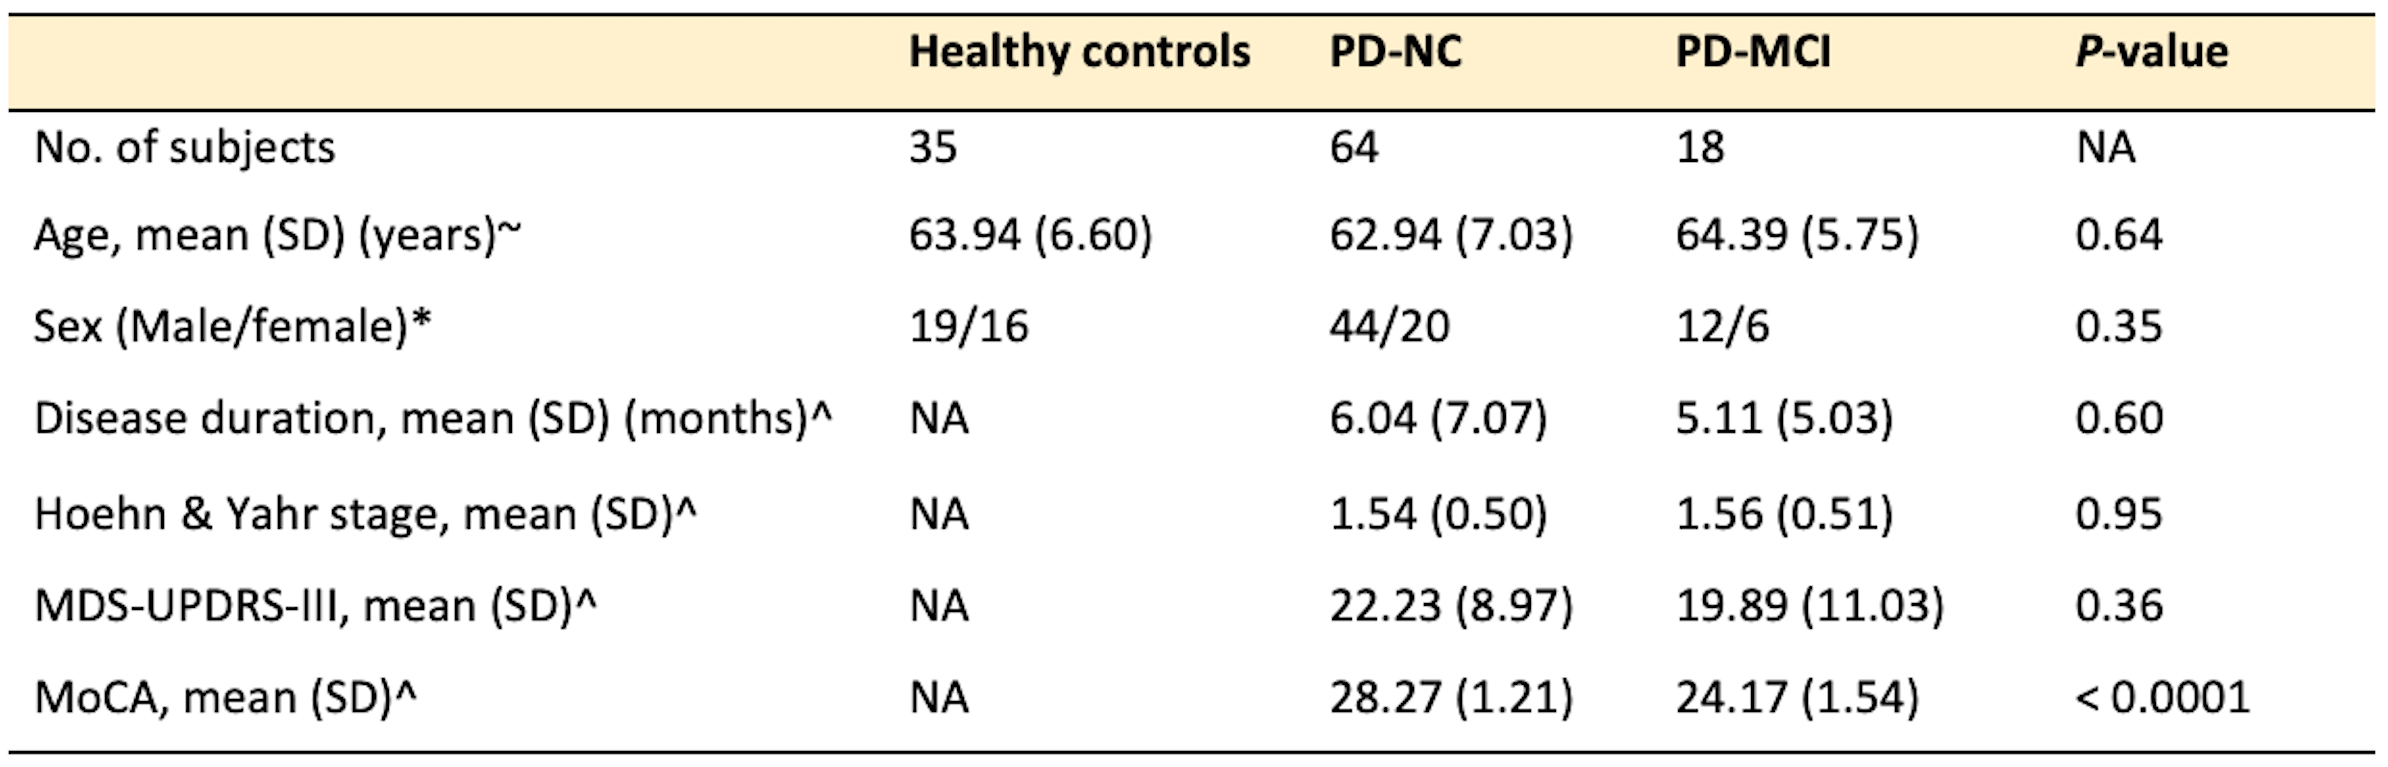
Table 1. Demographic characteristics of the participants
Abbreviations: MDS-UPDRS, Movement Disorder Society-Unified Parkinson’s Disease Rating Scale; MoCA, Montreal Cognitive Assessment; NA, not applicable. Note: Statistical analyses were performed with one-way analysis of variance (ANOVA)~, χ2test*, and unpaired t-test^.
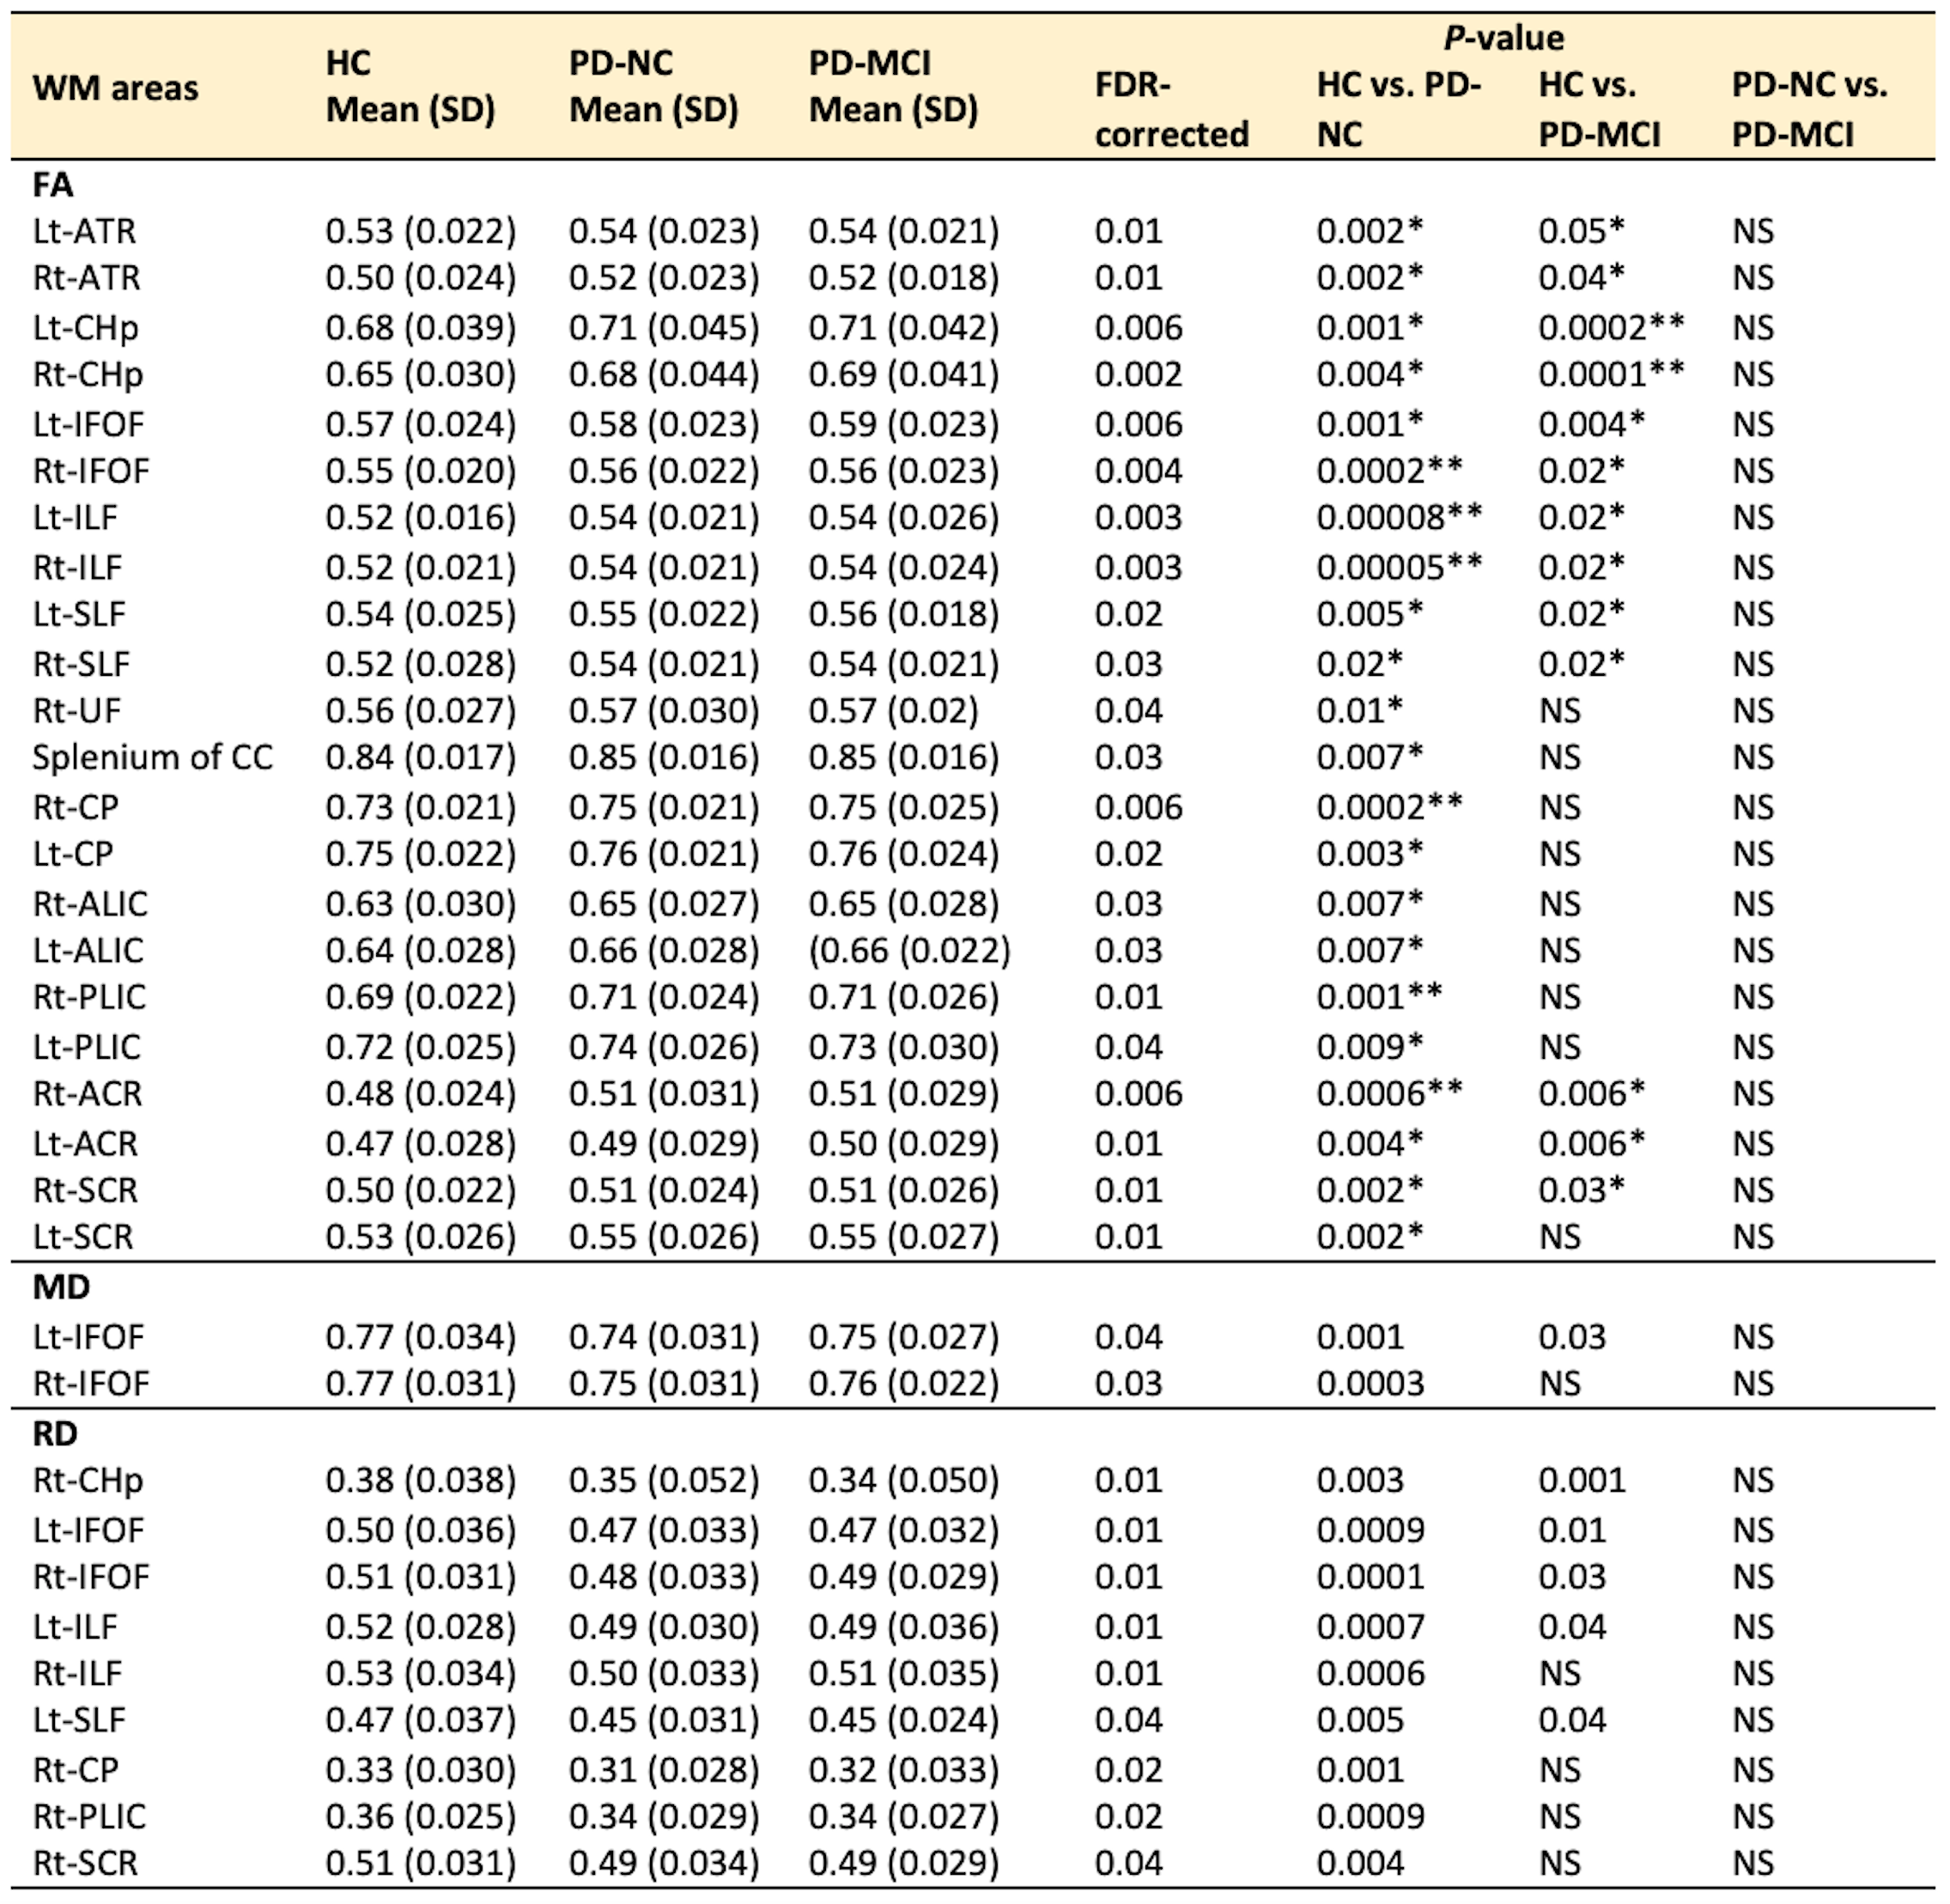
Table 2. ROI analysis of DTI parameters (FA, MD, and RD) in PD-NC and PD-MCI patients compared with healthy controls and in PD-MCI patients compared with PD-NC patients
Abbreviations: NS, not significant; SD, standard deviation. Note: Only regions with FDR-corrected P < 0.05 are shown. *P-value < 0.01, **P-value < 0.001.
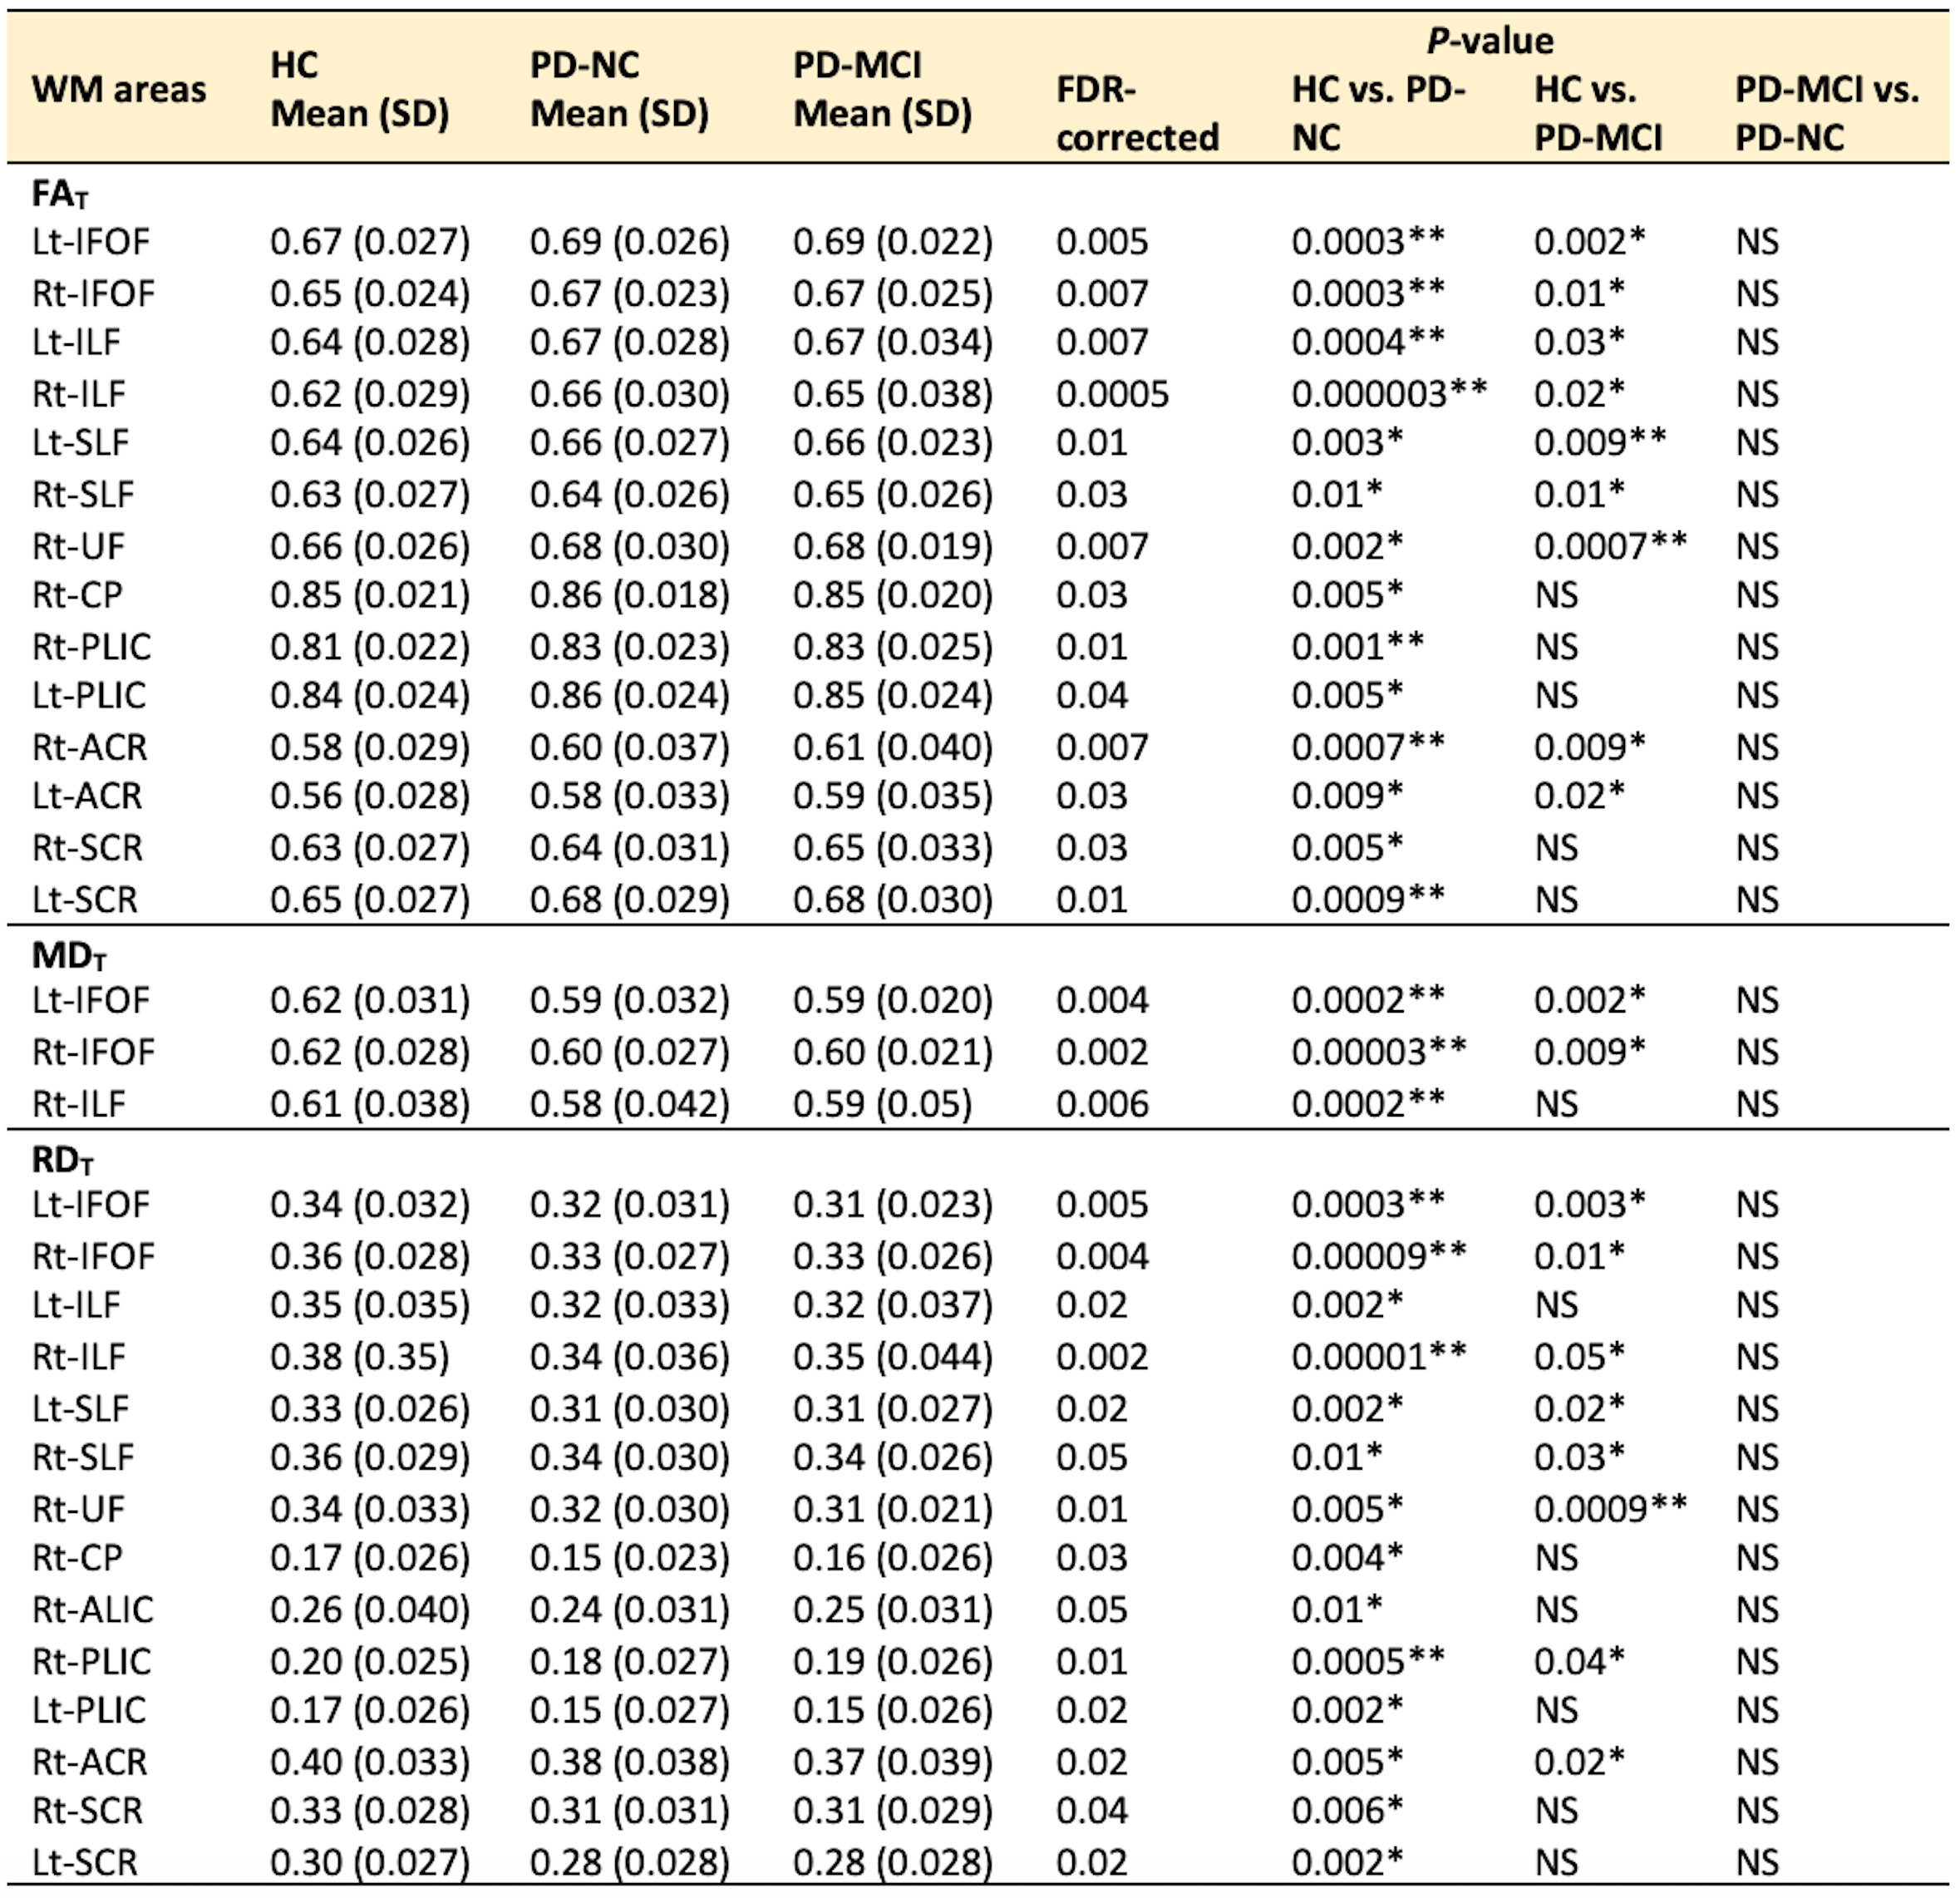
Table 3. ROI analysis of FWE-DTI parameters (FAT, MDT, and RDT) in PD-NC and PD-MCI patients compared with healthy controls and in PD-MCI patients compared with PD-NC patients
Abbreviations: NS, not significant; SD, standard deviation. Note: Only regions with FDR-corrected P < 0.05 are shown. *P-value < 0.01, **P-value < 0.001.