1534
A Preliminary attempt to Visualize Nigrosome 1 in the Subtantia Nigra for Parkinson’s Disease at 3T: An efficient SMWI imaging with QSMnet1Laboratory for Imaging Science and Technology, Department of Electrical and Computer Engineering, Seoul National University, Seoul, Republic of Korea, 2Department of Biomedical Engineering, Hankuk University of Foreign Studies, Yongin, Republic of Korea, 3Imaing Institute, Cleveland Clinic Foundation, Cleveland, OH, United States
Synopsis
We have described an efficient approach for SMWI visualizing SN and nigrosome 1 on clinical field strength (). QSMnet provides a similar SMWI image to that obtained with the conventional iterative QSM algorithm (such as iLSQR) but improves QSM processing speed by avoiding iterative computation. Since QSM reconstruction is the most time-consuming step of SMWI processing, QSMnet can help to achieve an improved SMWI processing speed. The application of QSMnet will be helpful when processing a massive amount of data or may contribute to the development of a scanner embedded real-time reconstruction of SWMI.
INTRODUCTION
A few studies suggested visualization of the nigrosome1, a sub-region of the substantia nigra (SN), can be an MR imaging biomarker for dopaminergic cells in PD patients1-6. Because of lower susceptibility induced tissue contrast and SNR visualization of the Substantia nigra pars compacta (SNPC) using conventional imaging technique in the clinical field strength (≤3T) has been limited1-5. Susceptibility Map-Weighted Imaging (SMWI) has been proposed to visualize SNPC at clinical field strength7,8. SMWI is a method that enhances the SNR and CNR of nigrosome 1 structure by employing the information from Quantitative Susceptibility Mapping (QSM). To better visualize nigrosome 1 and SN areas using SMWI, accurate estimation of the QSM map is essential. To overcome ill-posed problem, well known issue of susceptibility map calculation, two approaches have been proposed (estimation of susceptibility through multiple orientation sampling (COSMOS9) and iterative method (iLSQR10,11)). These sorts of strategies require long data acquisition and/or processing time because of their behavior. In the SMWI processing, QSM processing time using conventional algorithm is the most time-consuming step and may limit clinical use.In this study, we describe an efficient SMWI processing scheme for visualizing nigrosome 1 and SN regions at clinical field strength (≤3T), which utilized QSMnet12 to conduct QSM using a deep neural network to reduce processing time while maintaining similar SMWI image quality that obtained with the conventional iterative QSM method (iLSQR).
METHODS
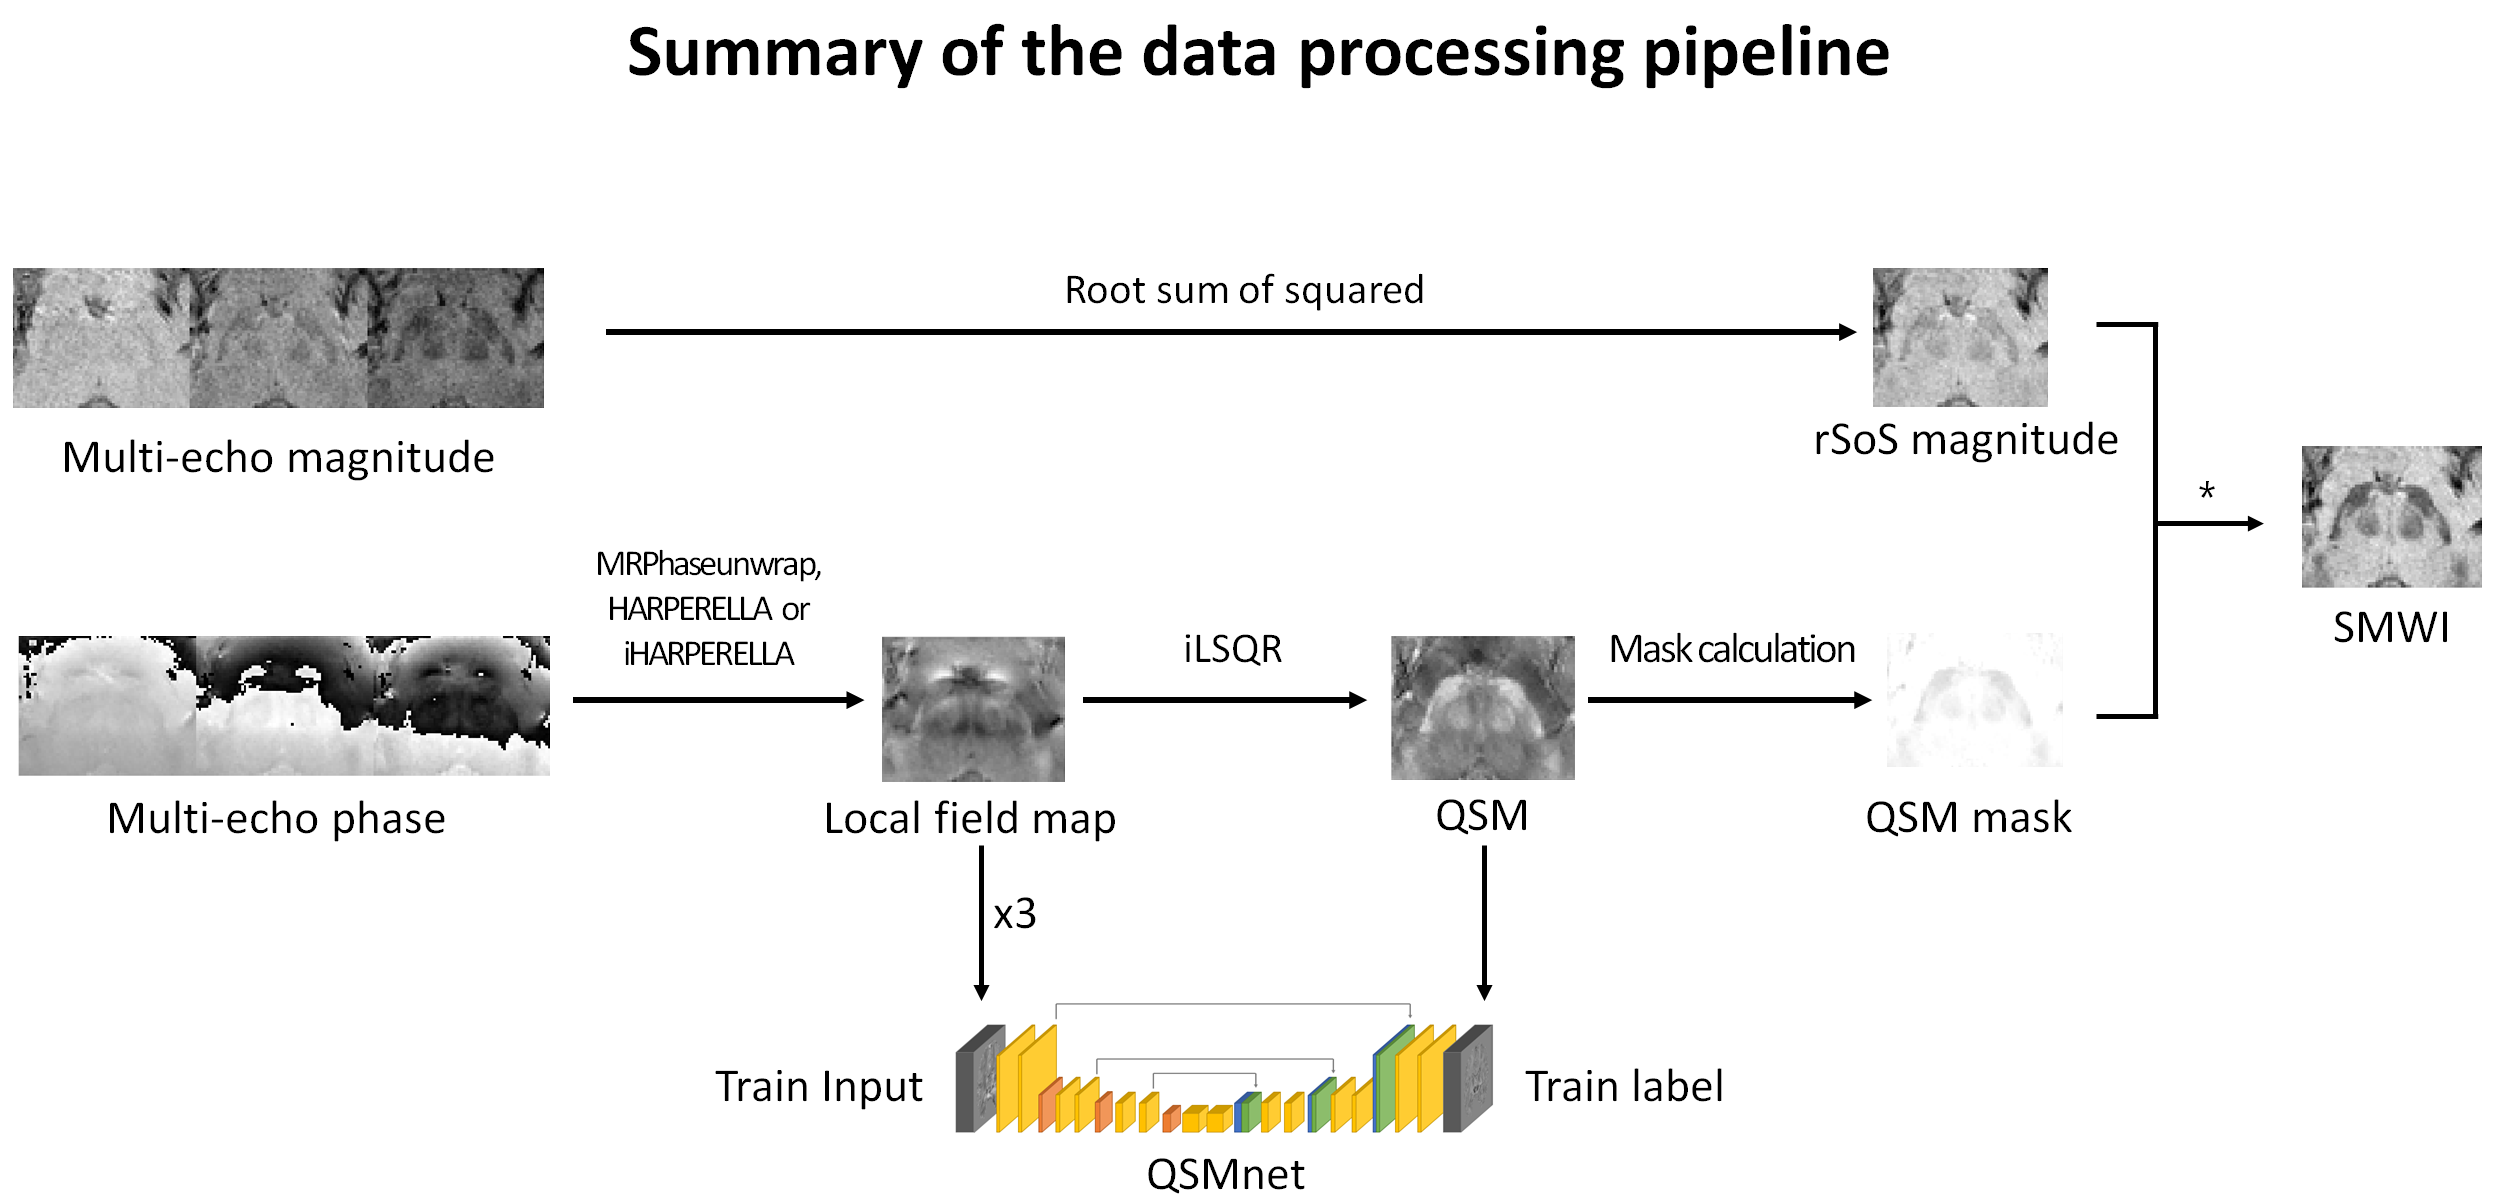
The overall data processing pipeline is shown in Figure 1. To conduct deep learning-based image to image operation, QSMnet12, which is a modified version of U-net structure with 3D inputs and outputs, was utilized. The network was modified to exclude the innermost convolution, deconvolution and feature concatenation layers with 512 channels. Same loss function that was proposed by Yoon et al.12 was used for QSMnet training.The network was trained with 57 in vivo MR scans. To validate SMWI results from QSMnet, four datasets from controls were used as the test datasets. As a preliminary attempt to explore the clinical applicability, a Parkinson’s disease patient data was additionally tested.
The SWMI images generated by QSMnet and iLSQR outputs were compared. To validate SMWI results, ROI analysis was performed. Mean signal value at each ROI was measured to calculate contrast to noise ratio (CNR). CNR was calculated as the ratio between the mean of nigrosome 1 area and the mean of the other regions of the SN in the SMWI images.
RESULTS
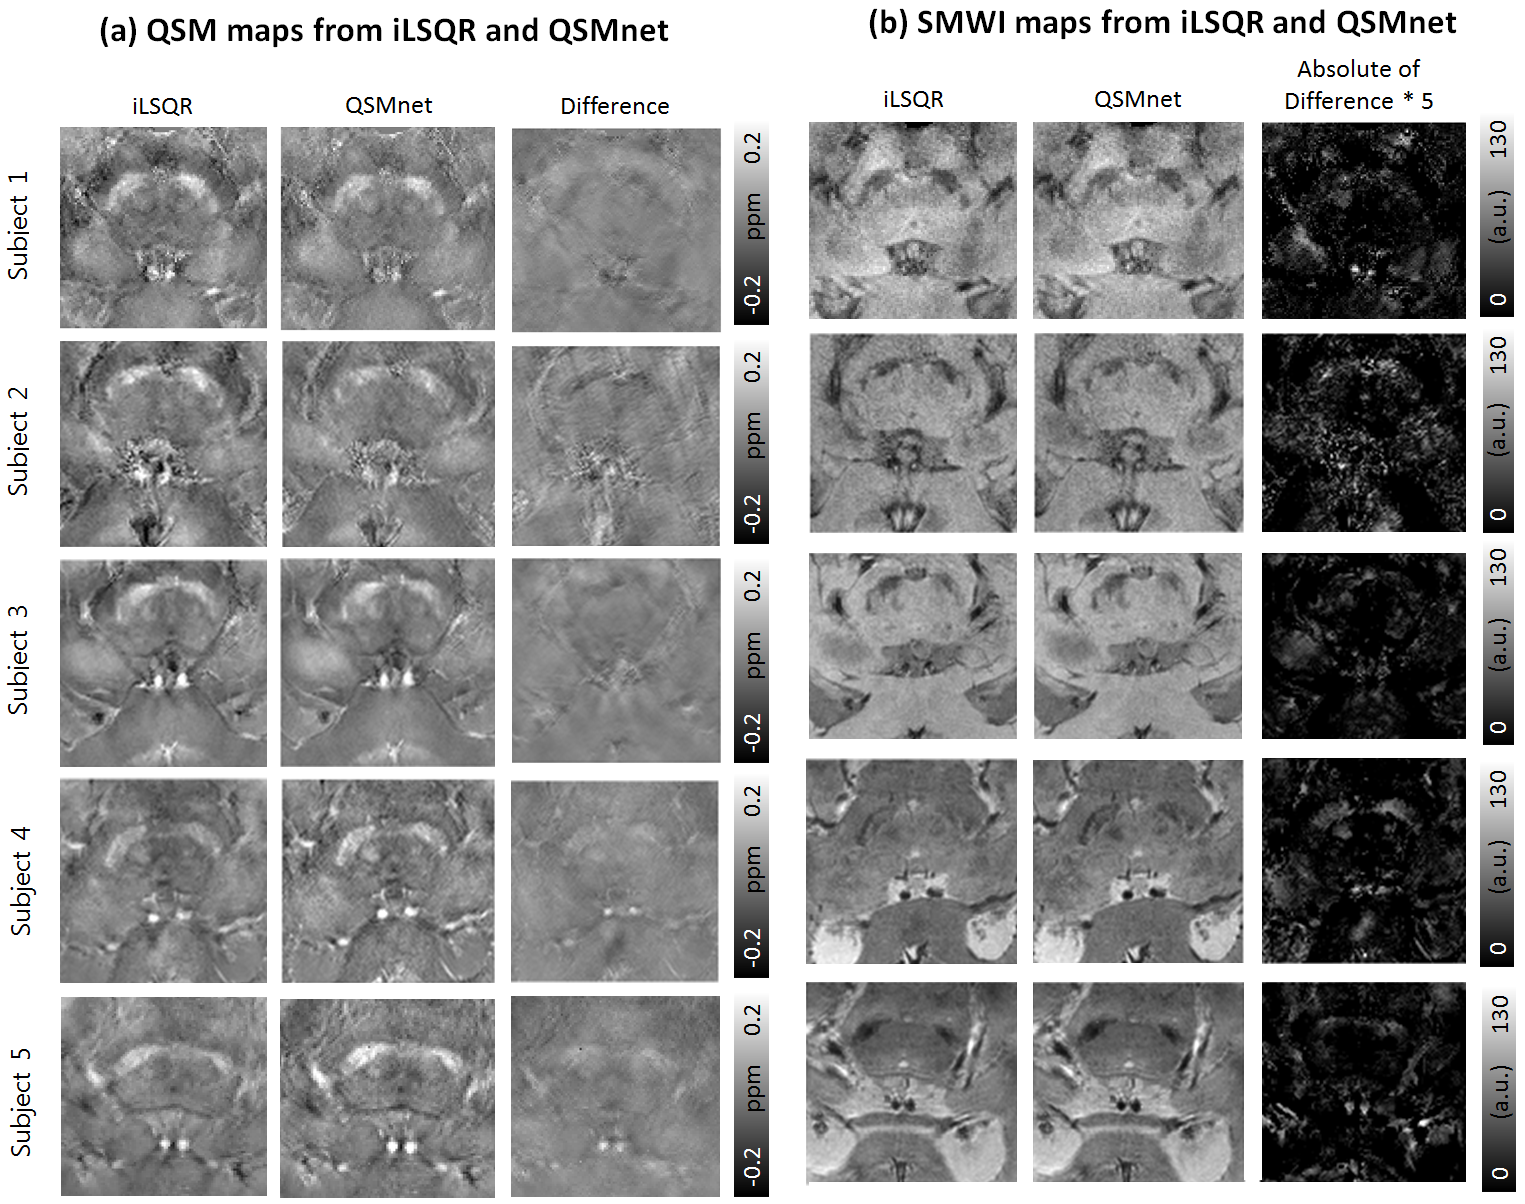
The total training time of QSMnet was 92000 secs (about 25.5 hours). The SMWI image reconstruction time using QSMnet was 10.9 sec (for 24 slices image) which is 5.4 times faster than processed with iLSQR.All QSM maps and SMWI results from four healthy volunteers (subject 1-4) and a PD patient (subject 5) for the test are shown in Figure 2. In Figure 2(a), all the QSM maps revealed the similar signal distribution and tissue contrast but results from QSMnet showed slightly lower tissue contrast in subjects 1-3 and slightly higher value in subjects 4-5 than results from iLSQR. SMWI images using susceptibility mask generated from QSM results shown in Figure 2(a) are presented in Figure 2(b). The absolute difference maps were calculated to show the similarity between the two methods. The overall mean absolute difference value in the presented ROIs obtained from healthy controls (n=4) and a PD patient (n=1) were 2.31 and 1.81 respectively.
SMWI results using susceptibility masks from QSMnet demonstrated signal distribution and tissue contrast that was comparable with those results seen with the susceptibility mask from the iLSQR method. The calculated mean CNR between SN and nigrosome 1 was 1.43 from SMWI using susceptibility mask from iLSQR and 1.42 the result from QSMnet (10 ROIs; n=5; including both sides). A paired t-test was performed, and the p-value was 0.72, confirming that the SMWI result using susceptibility masks from QSMnet and iLSQR revealed similar tissue contrast in the nigrosome 1 area.
DISCUSSION and CONCLUSION
In this work, we assessed an efficient SMWI processing scheme for visualizing nigrosome 1 region at clinical field strength (≤3T), which utilized QSMnet to conduct QSM using a deep neural network to reduce processing time while maintaining similar SMWI and QSM image quality that obtained with the conventional iterative QSM algorithm (iLSQR). These results suggest that SMWI imaging with susceptibility masks using QSMnet is a more efficient approach. The application of QSMnet will be helpful when processing a massive amount of data or may contribute to the development of a scanner embedded reconstruction of SWMI.Acknowledgements
The authors would like to acknowledge the generous support provided by Prof. Eung Yeop Kim for the acquisition of MR images. The authors would also like to acknowledge the generous technical support provided by Prof. Jongho Lee for the MR image processing.
This work was supported by the National Research Foundation of Korea (NRF) grant funded by the Korea government (MSIT) (NRF-2017R1C1B1008345), by NRF grant funded by MSIT (NRF-2018R1A4A1025891), and by the Hankuk University of Foreign Studies Research Fund.
References
[1] Noh Y, Sung Y, Lee J, Kim E. American Journal of Neuroradiology. 2015;36(11):2010-2016.
[2] Schwarz ST, Afzal M, Morgan PS, Bajaj N, Gowland PA, Auer DP. PLoS One. 2014;9(4):e93814.
[3] Reiter E, Mueller C, Pinter B, et al. 2015;30(8):1068-1076.
[4] Sung YH, Noh Y, Lee J, Kim EY. Radiology. 2015;279(3):849-858.
[5] Cosottini M, Frosini D, Pesaresi I, et al. American Journal of Neuroradiology. 2015;36(3):461-466.[6] Cosottini M, Frosini D, Pesaresi I, et al. Radiology. 2014;271(3):831-838.
[7] Gho SM, Liu C, Li W, et al. Magnetic resonance in medicine. 2014;72(2):337-346.
[8] Nam Y, Gho SM, Kim DH, Kim EY, Lee J. Journal of Magnetic Resonance Imaging. 2017;46(2):528-536.
[9] Liu T, Spincemaille P, de Rochefort L, Kressler B, Wang Y. Magnetic resonance in medicine. 2009;61(1):196-204.
[10] Li W, Wang N, Yu F, et al. Neuroimage. 2015;108:111-122.
[11] Li W, Wu B, Liu C. Neuroimage. 2011;55(4):1645-1656.
[12] Yoon J, Gong E, Chatnuntawech I, et al. NeuroImage. 2018;179:199-206.
Figures