1533
Identification of potential saliva bio-markers in early and advanced Parkinson’s disease using high resolution NMR
Sadhana Kumari1, S.Senthil Kumaran1, Vinay Goyal2, Achal Srivastava2, SadaNand Dwivedi3, and N.R. Jagannathan1
1NMR & MRI Facility, All India Institute of Medical Sciences, New Delhi, India, 2Neurology, All India Institute of Medical Sciences, New Delhi, India, 3Biostatistics, All India Institute of Medical Sciences, New Delhi, India
1NMR & MRI Facility, All India Institute of Medical Sciences, New Delhi, India, 2Neurology, All India Institute of Medical Sciences, New Delhi, India, 3Biostatistics, All India Institute of Medical Sciences, New Delhi, India
Synopsis
NMR-based metabolomics of saliva was studied in patients with Parkinson’s disease (PD) in early and advanced stages in comparison with that of healthy controls (HC). Higher levels of histidine, TMAO, propionate, GABA, valine, isoleucine, alanine, and fucose were observed in early PD in comparison with HC. Higher propionate and acetoin concentrations were observed in both early and advanced PD groups as compared to the HC group. An association of a few metabolites with the disease duration, LEDD and H&Y stage of PD patients was observed. Gut microflora system, ketone body and energy metabolisms may be impaired in patients with PD.
Introduction
Parkinson’s disease (PD) is a chronic neurodegenerative condition characterized by motor symptoms as a result of dopaminergic degeneration in the substantia nigra pars compacta1. It affects 1% of the population above 60 years of all races and culture2. Diagnosis of Parkinson's disease is established after the manifestation of motor symptoms like rigidity, bradykinesia, and tremor. However, recent studies support the hypothesis that nonmotor symptoms, particularly gastrointestinal dysfunctions, might serve as early biomarkers that lead to malnutrition3. As per Braak's hypothesis, the disease is assumed to originate in the intestine and via the vagus nerve it spreads to the brain4. Therefore, it has been hypothesized that peripheral dopaminergic impairments would possibly precede the alteration of dopaminergic neurons within the central nervous system and, finally, the appearance of motor symptoms. Thus, considering the complex process of diagnosis, there is a need for additional non-invasive biomarkers for the diagnosis and prognosis of PD. The aim of our study was to estimate how different stages of PD and dopaminergic treatment taken by the patients may affect the metabolic profile in the saliva of PD patients.Methods
The study included early PD group (patients with early stages of the disease; H&Y stage≤ 2; n=52; mean age 53.5±7.3 years) and advanced PD group (patients with advanced stages of the disease; H&Y stage > 2; n=24; mean age ±SD: 57.9±8.2 years) and HC (n=37; mean age±SD=53.0±8.53 years) after the ethical approval (Table 1). The participants were instructed to refrain from any medication, food, smoke, drink or use of oral hygiene products for at least 12 hrs prior to saliva collection. Saliva samples were collected in the morning (between 9:00 and 11:00 am) to avoid the diurnal variations and were immediately stored at -80˚C. For the NMR experiments, saliva samples were thawed at room temperature and centrifuged at 2000g for 10 min at 4oC to remove insoluble materials, food remnants and cell debris. 400µl of saliva sample was mixed with 170µL phosphate buffer solution (0.5 mM Na2HPO4/ NaH2PO4, pH 7.4, 99.9% D2O) to maintain the pH variation across samples. Further, 0.5 mM TSP (3-(trimethylsilyl) propionic-2,2,3,3-d4 acid sodium salt) was added to the sample for serving as an internal standard for concentration estimation as well as chemical shift reference. A total of 600 μl obtained solution were transferred into 5 mm tubes for the NMR experiments. Proton NMR spectra were acquired using 700 MHz NMR spectrometer (M/s. Agilent Technologies, USA) with 1D PRESAT using a 90˚ pulse, 128 scans; relaxation delay=14s. Assignments of various metabolite resonances were made using 1D & 2D NMR spectra. Data were integrated using Vnmrj software (version 2.3, Agilent) and further concentration was estimated. Significant metabolites were estimated by Mann-Whitney U test using STATA software (version 12).Results and discussion
The metabolic profiles of 113 saliva samples were obtained from healthy and PD subjects. The assignments of a total of 40 salivary metabolites were carried out unambiguously (Figure 1). The observed metabolites include organic acids, neurotransmitters, short-chain fatty acids, amino acids, amines, and alcohols. Patients with early PD exhibited higher concentrations of histidine, TMAO, propionate, GABA, valine, isoleucine, alanine, and fucose in comparison with HC, indicating the characteristic changes of metabolite levels during the onset of PD, though it may be related to dopaminergic treatment also. Higher propionate and acetoin concentrations were observed in both early and advanced PD groups as compared to the HC group, suggesting these metabolites may not be altered by dopaminergic treatment. There were no differences between ePD and aPD groups (Figure 2). The concentrations of propionate (r=0.29, p=0.04) and acetoin (r=0.26, p=0.03) correlated with disease duration, but not with LEDD, H&Y stage and UPDRS (Figure 3). Elevated propionate and acetoin in patients with ePD and aPD and their positive correlation with disease duration suggests an association of PD biochemistry with the gut microbiome. Acetate and propionate are intestinal microbial metabolites that influence the formation of gut microbiota and the host metabolome5. Due to altered levels of these metabolites, intestinal microflora becomes imbalanced and may activate intestinal immunity to maintain the integrity of the gut barrier6. These findings suggest a possible relationship in oral health and bacterial status associated with the deterioration of periodontal health in patients with PD7. The concentrations of glycine (r=0.43, p≤0.01), taurine (r=0.52, p≤0.001), TMAO (r=0.36, p=0.01), isoleucine (r=0.30, p=0.04), and valine (r=0.31, p=0.04) correlated with LEDD suggest their association with dopaminergic treatment of PD patients. The concentration of butyrate (r=-0.25, p=0.04) metabolite had a negative correlation with H&Y stage and may be ascribed to disease severity, though it could not distinguish ePD and aPD. An increased concentration of metabolites in PD in comparison with HC may be attributed to a slower rate of amino acid absorption leading to malnutrition in patients with PD8.Conclusion
The metabolites related to the gut microbiome, ketone body metabolism, and energy metabolism were affected in PD, with respect to healthy controls. However, the metabolites were not significantly different between ePD and aPD.Acknowledgements
SK Acknowledges fellowship from CSIR.References
- Carvalho MM, Campos FL, Coimbra B, et al. Behavioral characterization of the 6-hydroxidopamine model of Parkinson’s disease and pharmacological rescuing of non-motor deficits. Mol. Neurodegener. 2013; 8:14.
- Tysnes OB, and Storstein A, Epidemiology of Parkinson’s disease. J Neural Transm. 2017; 124: 901–905.
- Hirsch L, Jette N, Frolkis A, Steeves T, Pringsheim T. The Incidence of Parkinson’s Disease: A Systematic Review and Meta-Analysis. Neuroepidemiology. 2016;46:292–300.
- Holmqvist S, Chutna O, Bousset L, et al. Direct evidence of Parkinson pathology spread from the gastrointestinal tract to the brain in rats. Acta Neuropathol. 2014; 128:805-20.
- Fukao T, Mitchell G, Sass JO, Hori T, Orii K., and Aoyama Y. Ketone body metabolism and its defects. J Inherit Metab Dis. 2014; 37:541-51
- Li Z, Quan G, Jiang X, et al Effects of Metabolites Derived From Gut Microbiota and Hosts on Pathogens Front. Cell. Infect. Microbiol. 2018; 8:314
- Barbe AG, Bock N, Derman SHM, Felsch M, Timmermann L, and Noack MJ. Self-assessment of oral health, dental health care and oral health-related quality of life among Parkinson’s disease patients. Gerodontology. 2017; 34:135-143
- Figura M, Kuśmierska K, Bucior E, et al. Serum amino acid profile in patients with Parkinson’s disease. PLoS One. 2018; 13:e0191670.
Figures
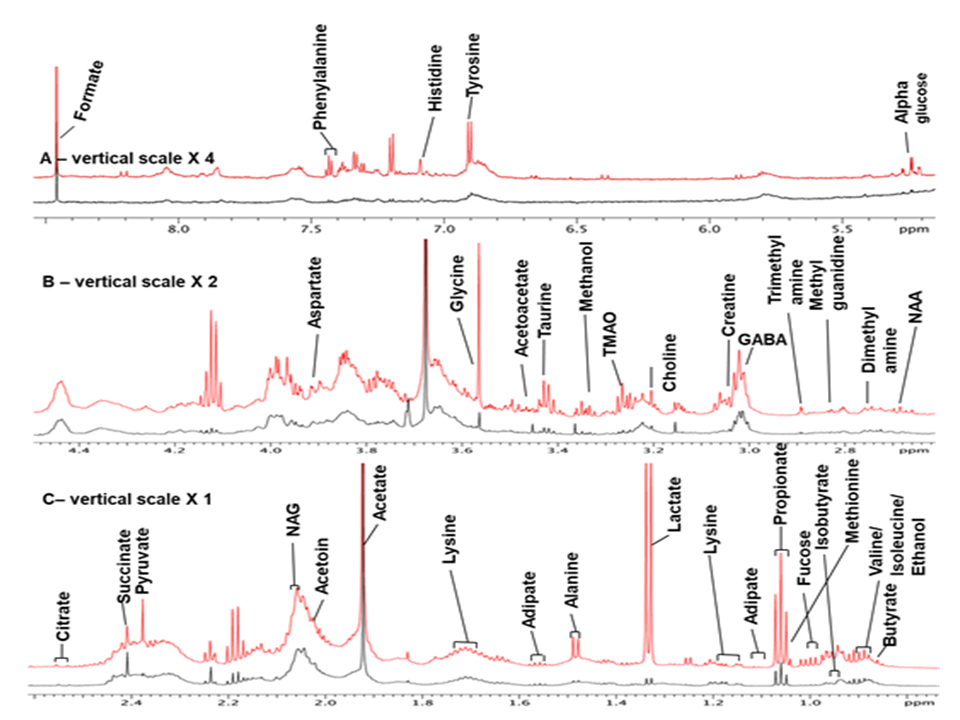
Figure 1. Representative 1D-proton NMR spectrum using 700 MHz
NMR Spectrometer between 0.70 and 8.50 ppm of saliva obtained from Patients
with Parkinson's disease (PD, red color) and healthy control (HC, black color).
The residual water signal between 4.45 and 5.51 ppm has been removed. The
expanded aliphatic region from 0.70-2.60 ppm (A); Vertical scale for the region
2.50−4.48 ppm (B) has been doubled and 5.51 to 8.50 ppm (C), increased by a
factor of four times. The peak of acetate has been truncated.
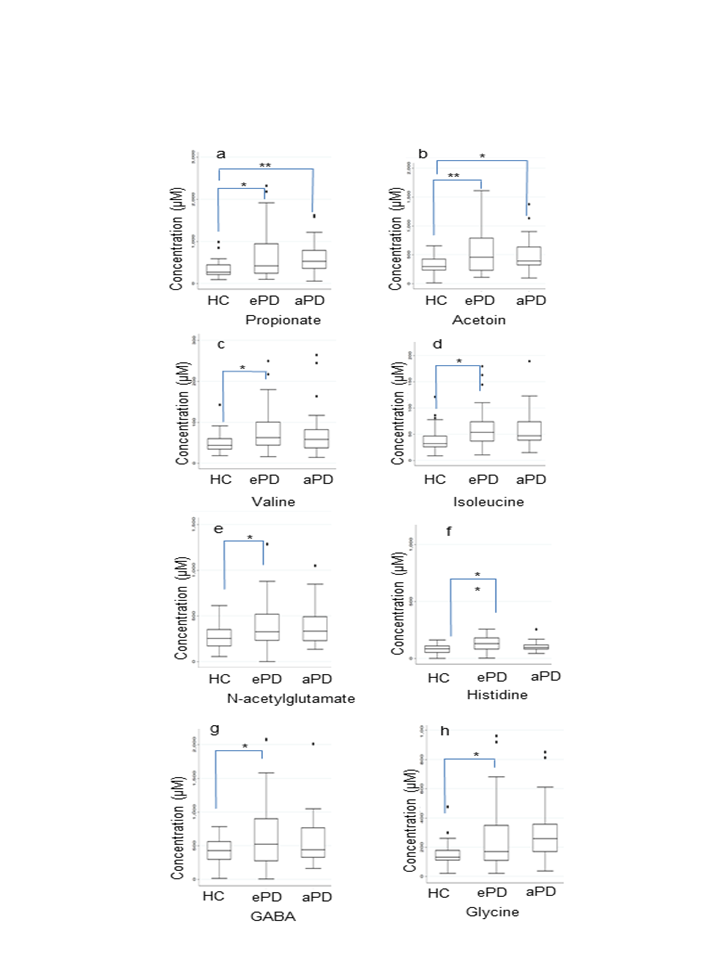
Figure 2. Box plots for the concentration levels of
representative metabolites. (a) propionate, (b) acetoin, (c) valine, (d)
isoleucine, (e) N-acetylglutamate, (f) histidine, isoleucine, (g) GABA and (h) glycine.
(* denote P < 0.05, and ** denote P < 0.01).

Figure 3. Spearman’s rank correlation analysis between
metabolite concentrations (μM) and clinical parameters (LEDD, disease duration,
H&Y stage and UPDRS motor score. Propionate (r=0.29, p=0.04) and acetoin
(r=0.26, p=0.03) concentrations were positively correlated with disease
duration. Changes in concentrations of glycine (r=0.43, p=<0.01),
taurine (r=0.52, p=<0.001), TMAO (r=0.36, p=0.01), isoleucine (r=0.30,
p=0.04), and valine (r=0.31, p=0.04) correlated with LEDD. The concentration of
butyrate (r=-0.25, p=0.04) metabolites was correlated with H&Y stage.
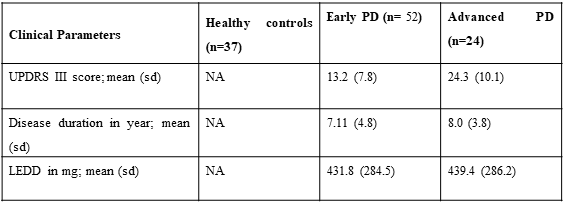
Table 1. Demographic detail of the subjects. UPDRS was assessed in the “off” period
(without medication). Abbreviations: UPDRS: Unified Parkinson’s Disease Rating
Scale, sd: standard deviation. H&Y: Hoehn and Yahr Parkinson’s disease
staging scale, PD: Parkinson’s disease, NA: not applicable, LEDD: levodopa
equivalent daily dose).