1532
In-vivo characterization of the biochemical properties of the locus coeruleus and substantia nigra in healthy controls and Parkinson’s disease1Wolfson Brain Imaging Centre, Department of Clinical Neurosciences, University of Cambridge, Cambridge, United Kingdom, 2Behavioural and Clinical Neuroscience Institute and Department of Psychology, University of Cambridge, Cambridge, United Kingdom, 3Department of Clinical Neurosciences, University of Cambridge, Cambridge, United Kingdom, 4Medical Research Council Cognition and Brain Sciences Unit, University of Cambridge, Cambridge, United Kingdom
Synopsis
In Parkinson’s disease, there is severe loss of dopaminergic projection neurons of the substantia nigra (SN) and locus coeruleus (LC). Histology shows that damage is non-uniform and occurs in stages; i.e. there is preferential degeneration of neurons first in the rostral portion of the SN and only later on in the LC. In this study, we measured the biochemical properties of the SN and LC with T2* and Magnetization Transfer imaging in patients with Parkinson’s disease and two groups of healthy controls.
Purpose
The locus coeruleus (LC) and the substantia nigra (SN) have some common biochemical and cellular features including the accumulation of neuromelanin (NM) in their catecholaminergic neurons (i.e. noradrenergic or dopaminergic). Both LC and SN neurons are vulnerable to the effects of ageing and Parkinson’s disease (PD)1-3. Neuromelanin-sensitive MRI sequences based on Magnetization Transfer (MT) have been used to image the LC and SN in vivo at 3T and 7T4-8. In addition, T2*-w MRI correlates with non-heme iron concentrations in the SN.9-10In this study, ultra-high resolution imaging of the LC and SN at 7T was performed with MT-w and T2*-w imaging in a group of healthy controls and patients with PD. Data from an age-matched and independent group of healthy controls were also used to derive a template of the LC and SN. The MT-w, magnetization transfer ratio (MTR)11, quantitative susceptibility imaging (QSM) and R2* signal were compared between groups, in LC and SN.
Acquisition
A 3D MT-weighted sequence (MT-w) was developed5,8 on a 7T Terra MRI scanner (Siemens) applying a train of 20 RF-pulses at 6.72ppm off-resonance before a turbo-flash readout. Imaging parameters were: TE/TR=4.08/1251ms, flip-angle=8º, voxel-size=0.4x0.4x0.5mm3, BW=140Hz/px, no acceleration, slices=112, 14.3%-oversampling, 7min TA. The MT-preparation pulse was calibrated to 420º FA at the middle of the pons. Two MT sequence repeats were acquired (‘MTrun1’ and ‘MTrun2’); a further repeat without off-resonance pulses was also acquired (‘noMT’). 3D multi-echo, 0.7mm isotropic T2*-weighted images were acquired transversely for QSM and R2* mapping: TE1/TR=4.68/27ms; 6 echoes, echo-spacing=3.24ms, FA=15º; BW=430Hz/px; acceleration-factor=2x2; FOV=224x196x157mm3; 7min TA; and Roemer coil combination12. For anatomical co-registration, 0.7mm isotropic MP2RAGE images were acquired. For the development of a study template data from 29 healthy controls (HCi) (13 female, age 67±8 years) was collected which included the protocol as described above, with three repeats of the MT-w scan (Table 1). For the main study data was independently acquired for a further 23 healthy controls (HC) (11 female, age 66±5 years) and 23 PD patients (6 female, age 67±7 years) (Table 1).Analysis
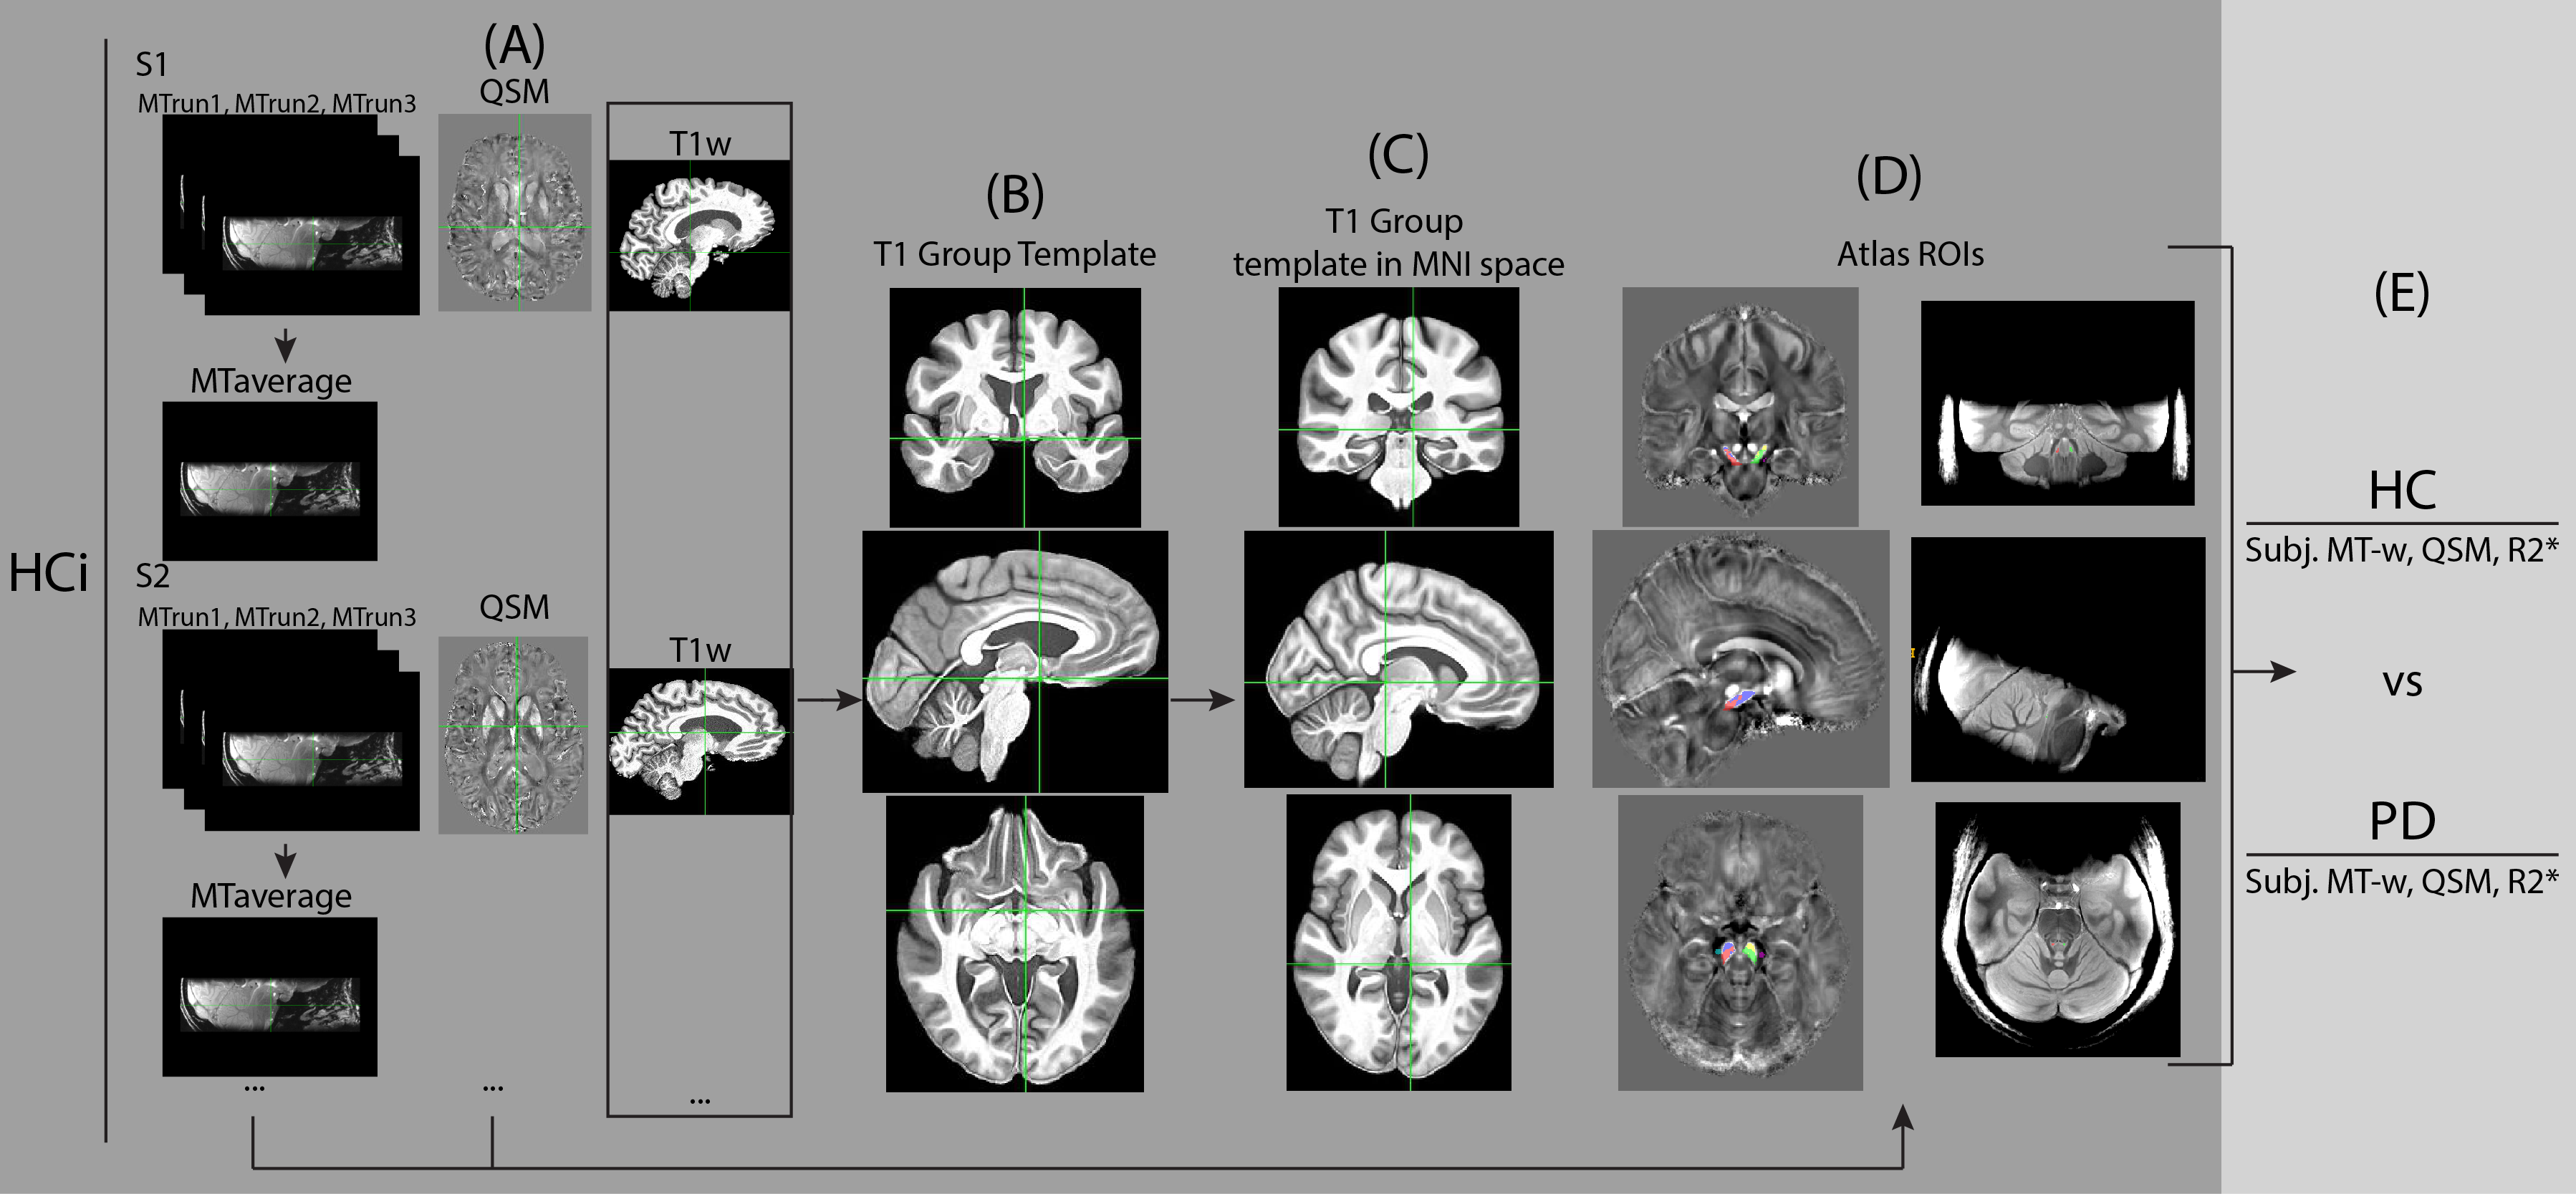
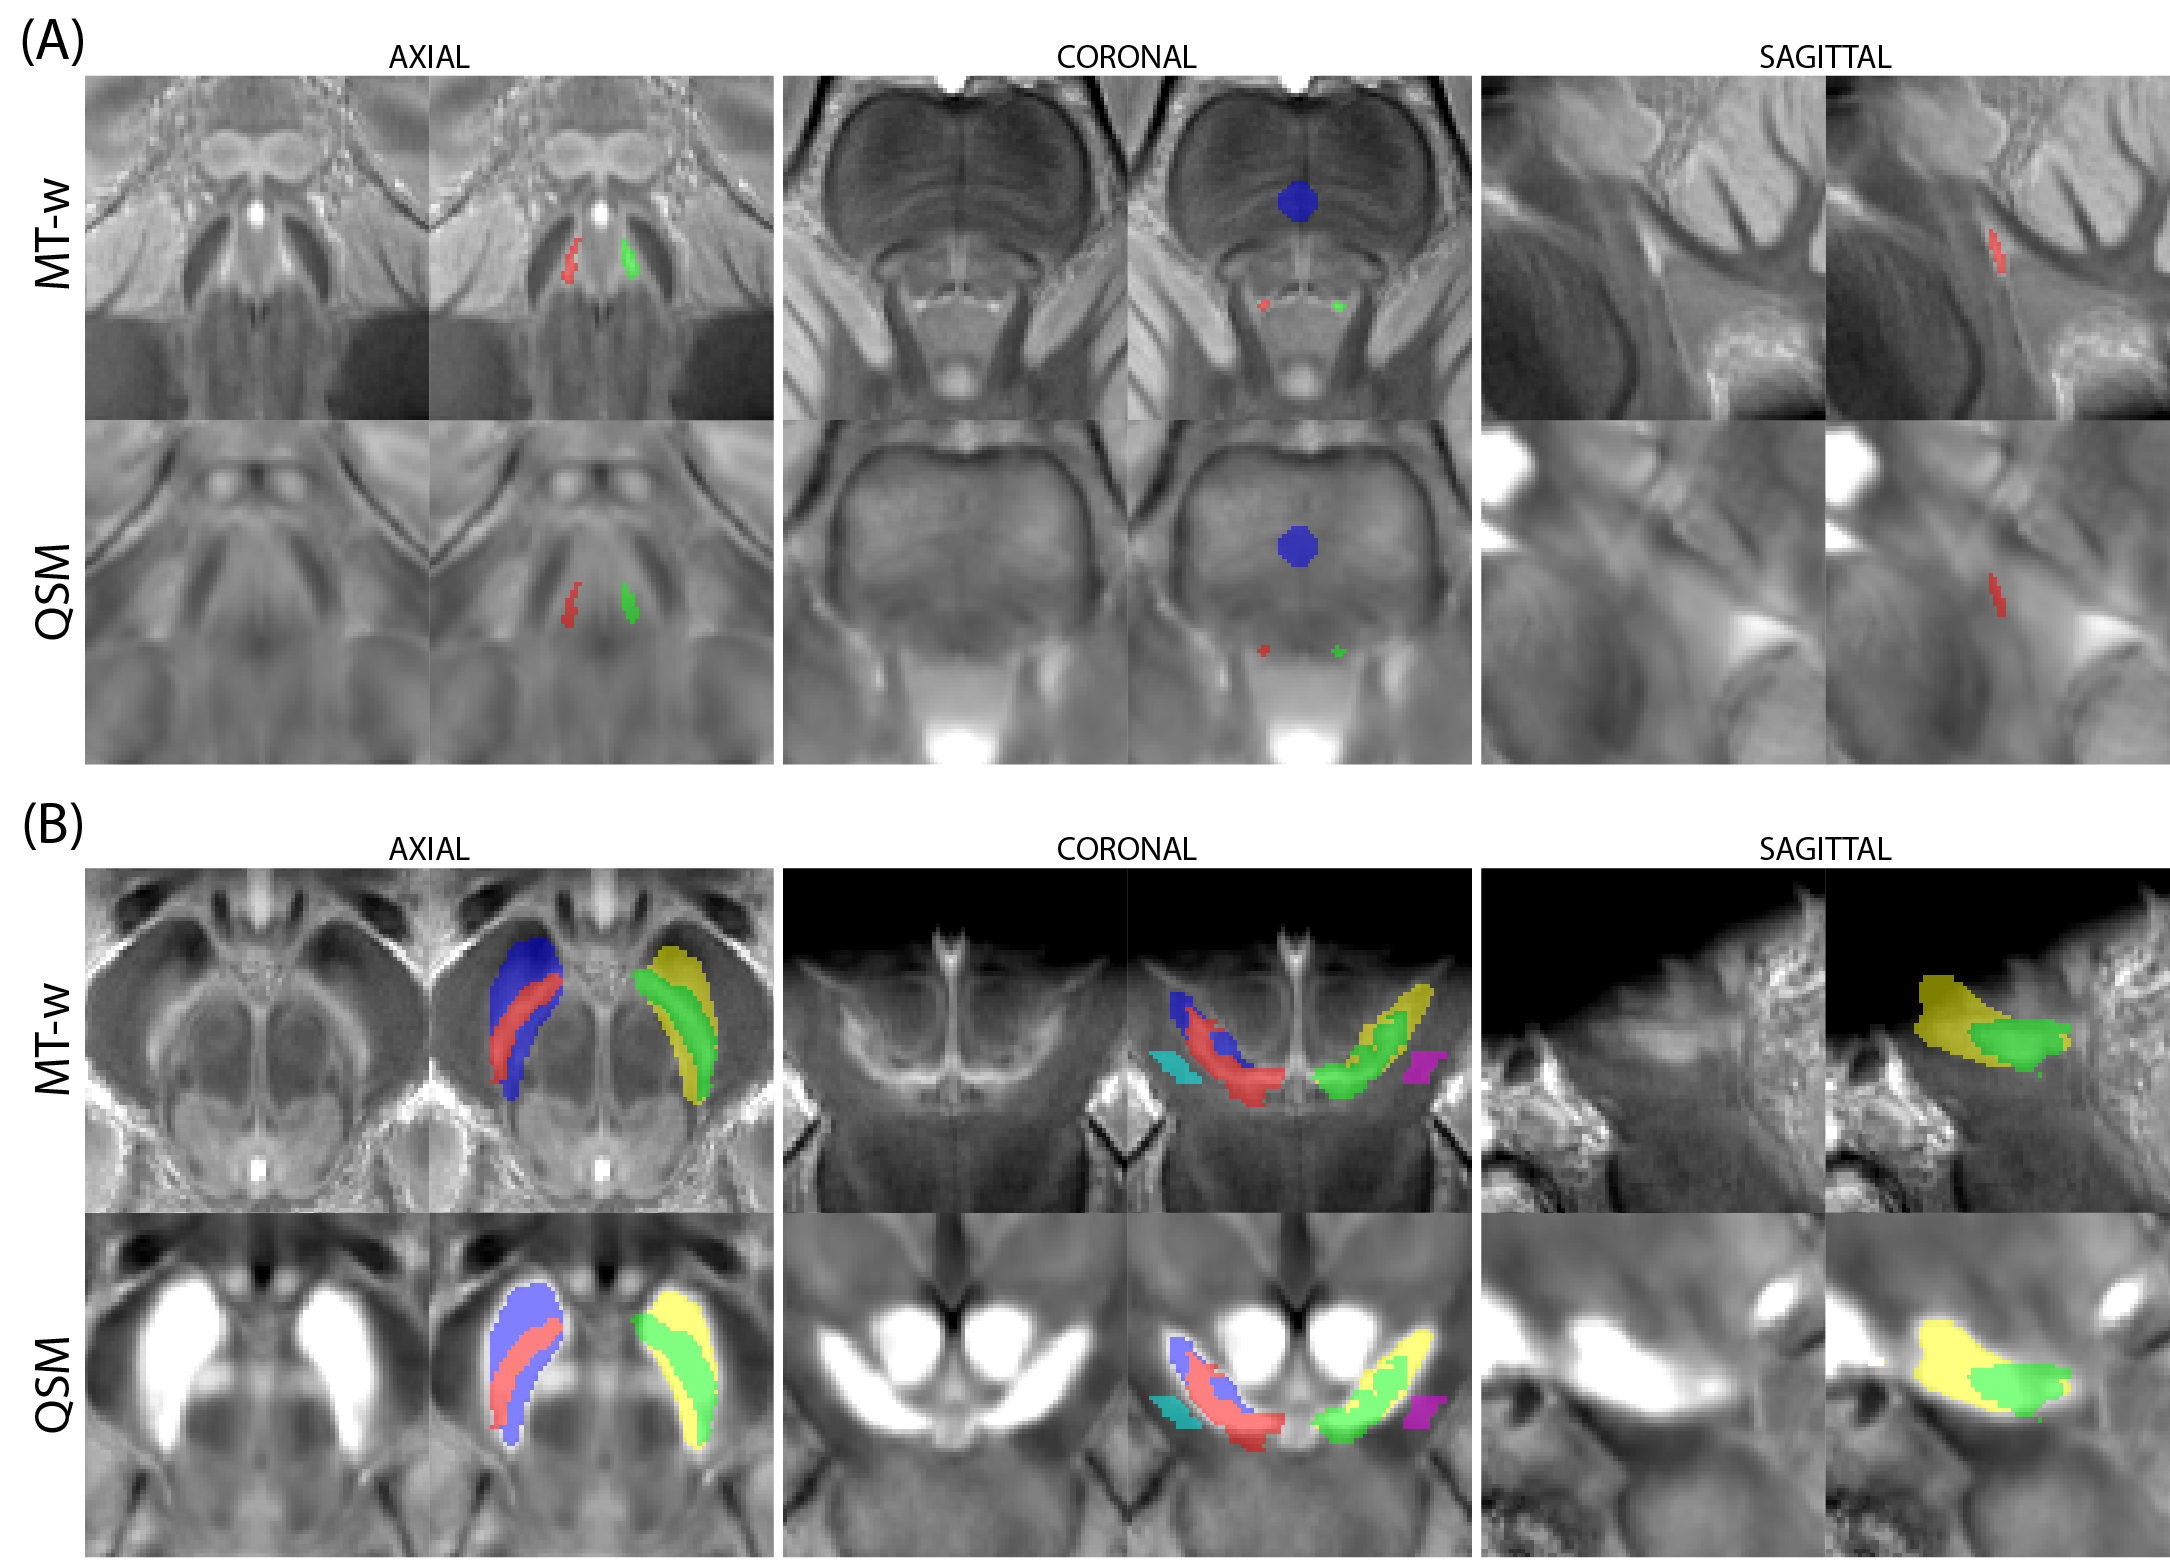
QSM data was estimated from the T2* scan using the multi-scale dipole inversion algorithm in QSMbox13, and R2* was estimated by fitting a monoexponential curve to the magnitude of the signal decay14. The MT-w data from each run was first bias-field corrected and then concatenated with ANTs (Figure 1.A)15.Using data from the HCi dataset, a T1-w template was first built from the MP2RAGE data (Figure 1.B) and then mapped to MNI152 2009a space (Figure 1.C). MT-w and QSM data were mapped to MNI space via the MP2RAGE study template to guarantee high registration accuracy, and averaged to produce study-specific MT-w and QSM templates (Figure 1.D). On the MT-w group template left and right LC ROIs were defined using a semi-automatic threshold-based method4 within a defined search area (Figure 2.A). One reference region, labelled ‘REF’, was also defined in the middle of the pons. Similarly, SN and ‘REF’ ROIs were defined based on the MT-w and QSM templates (Figure 2.B).
Results
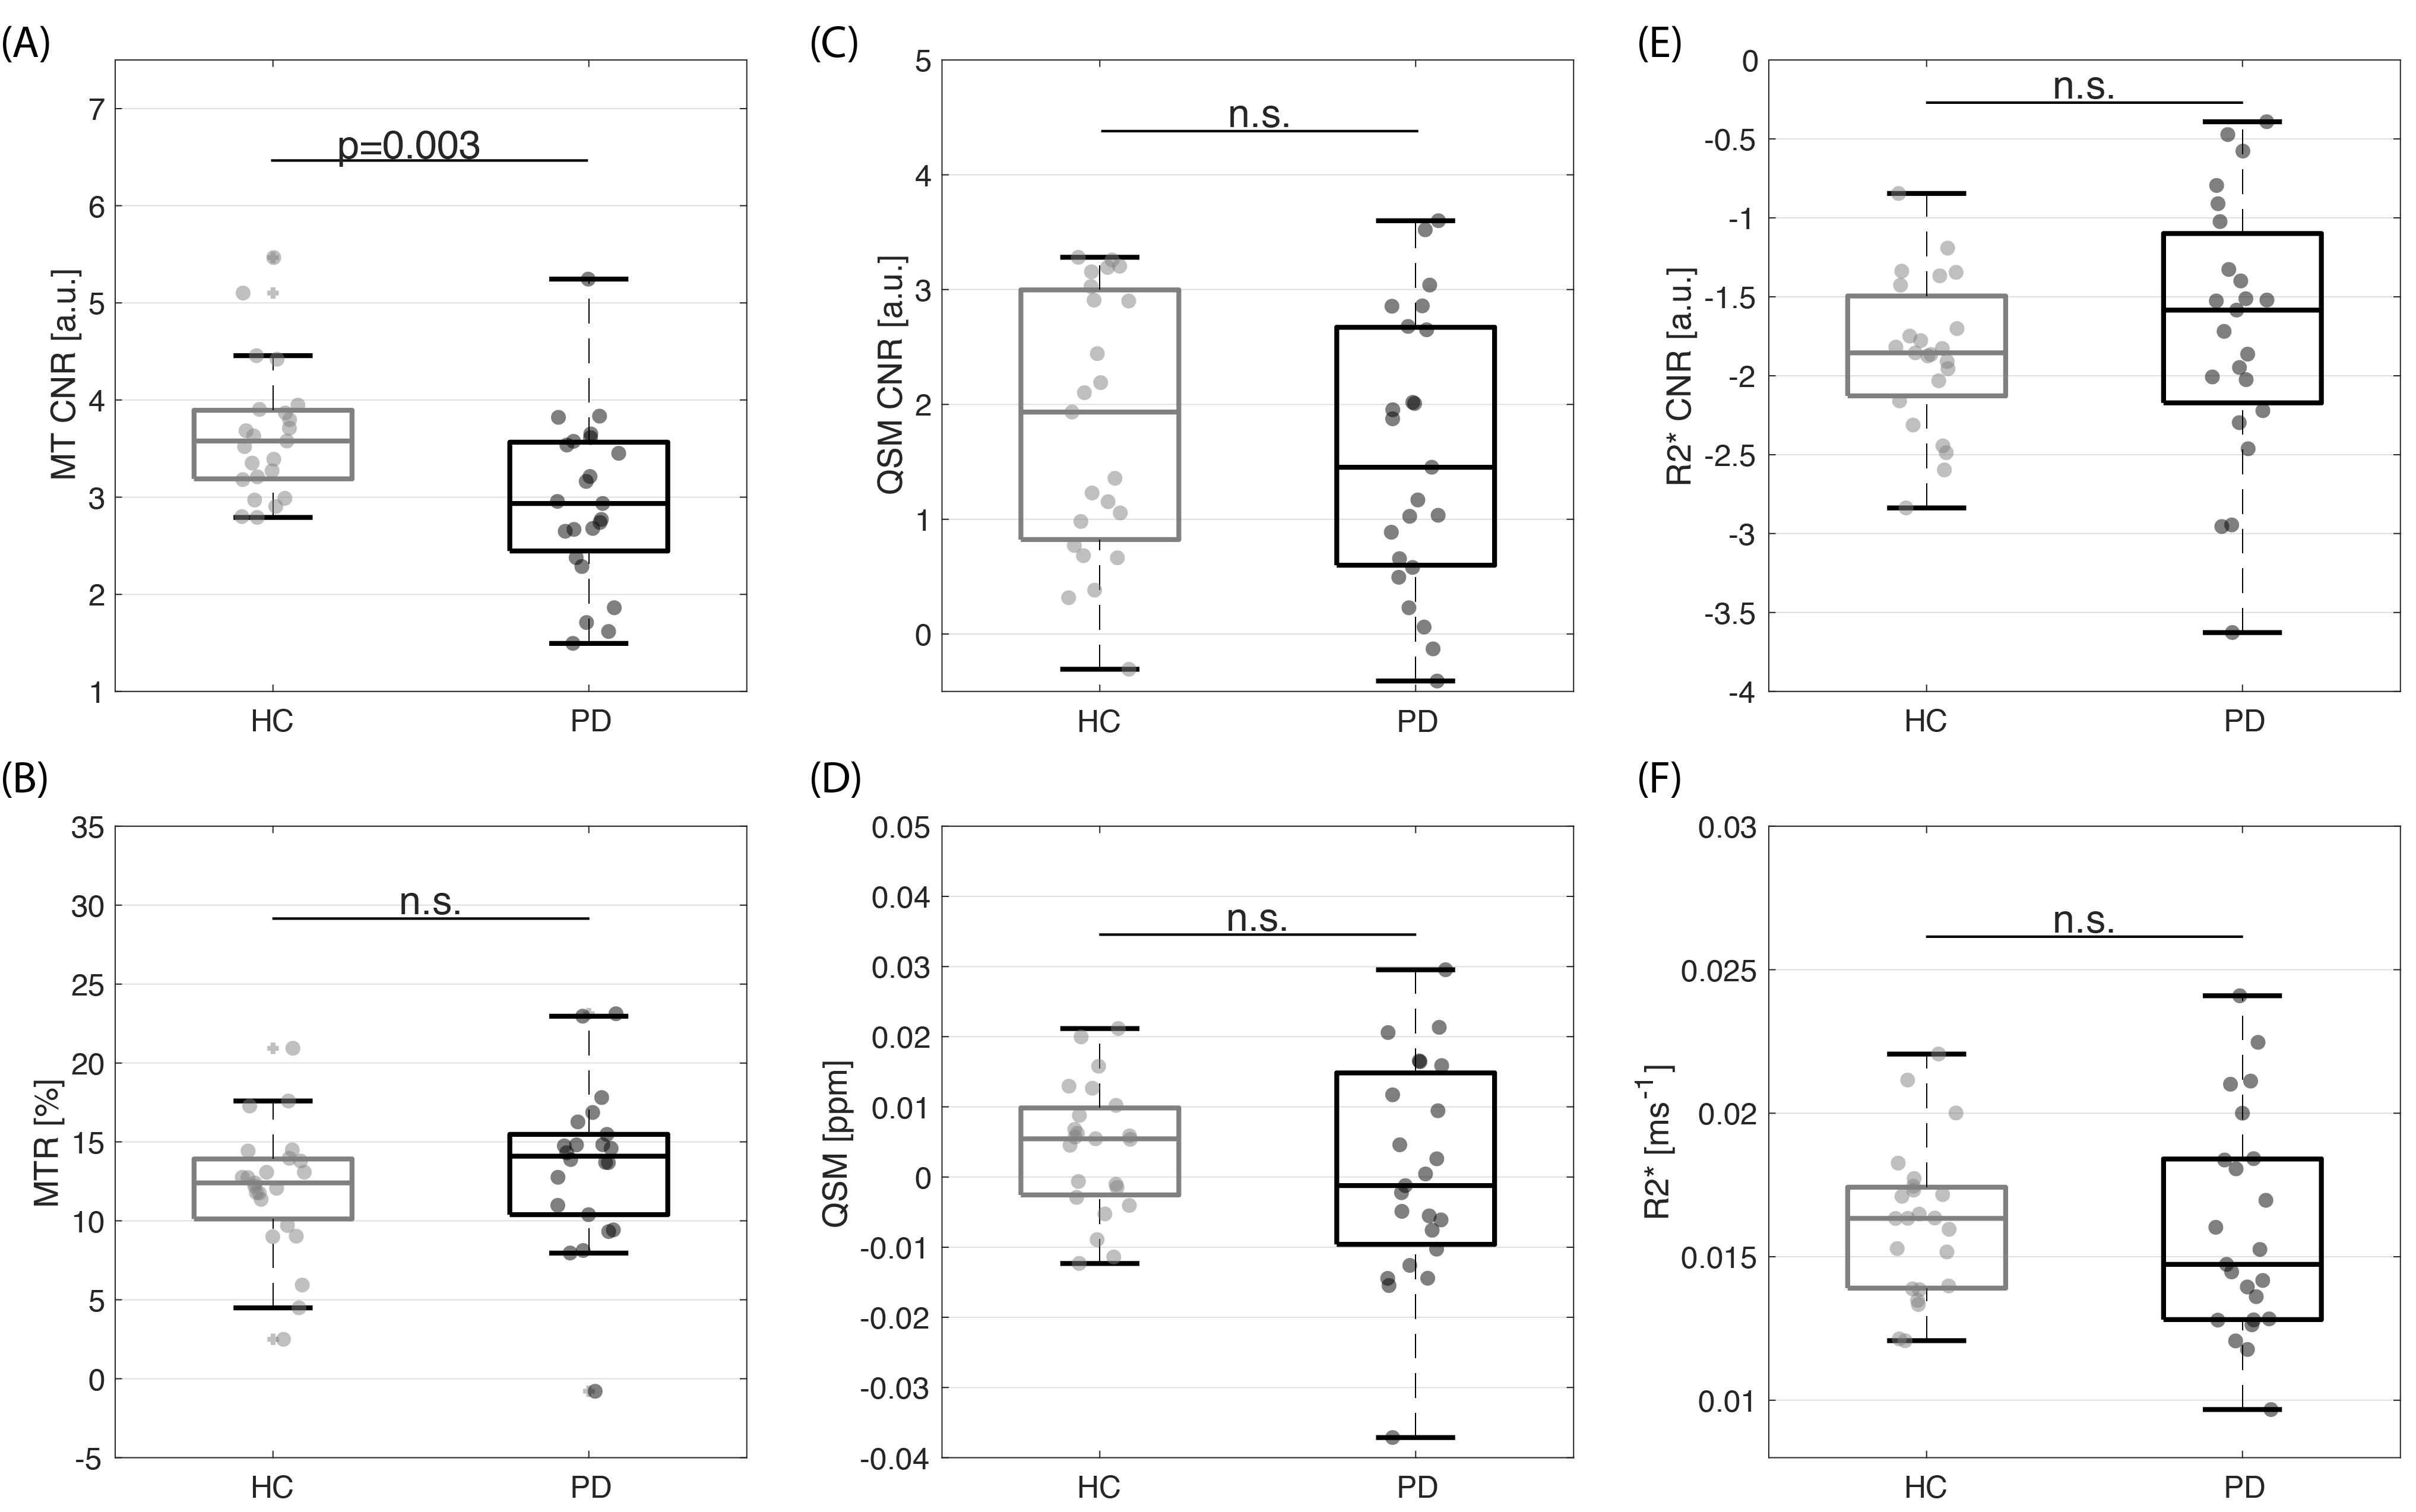
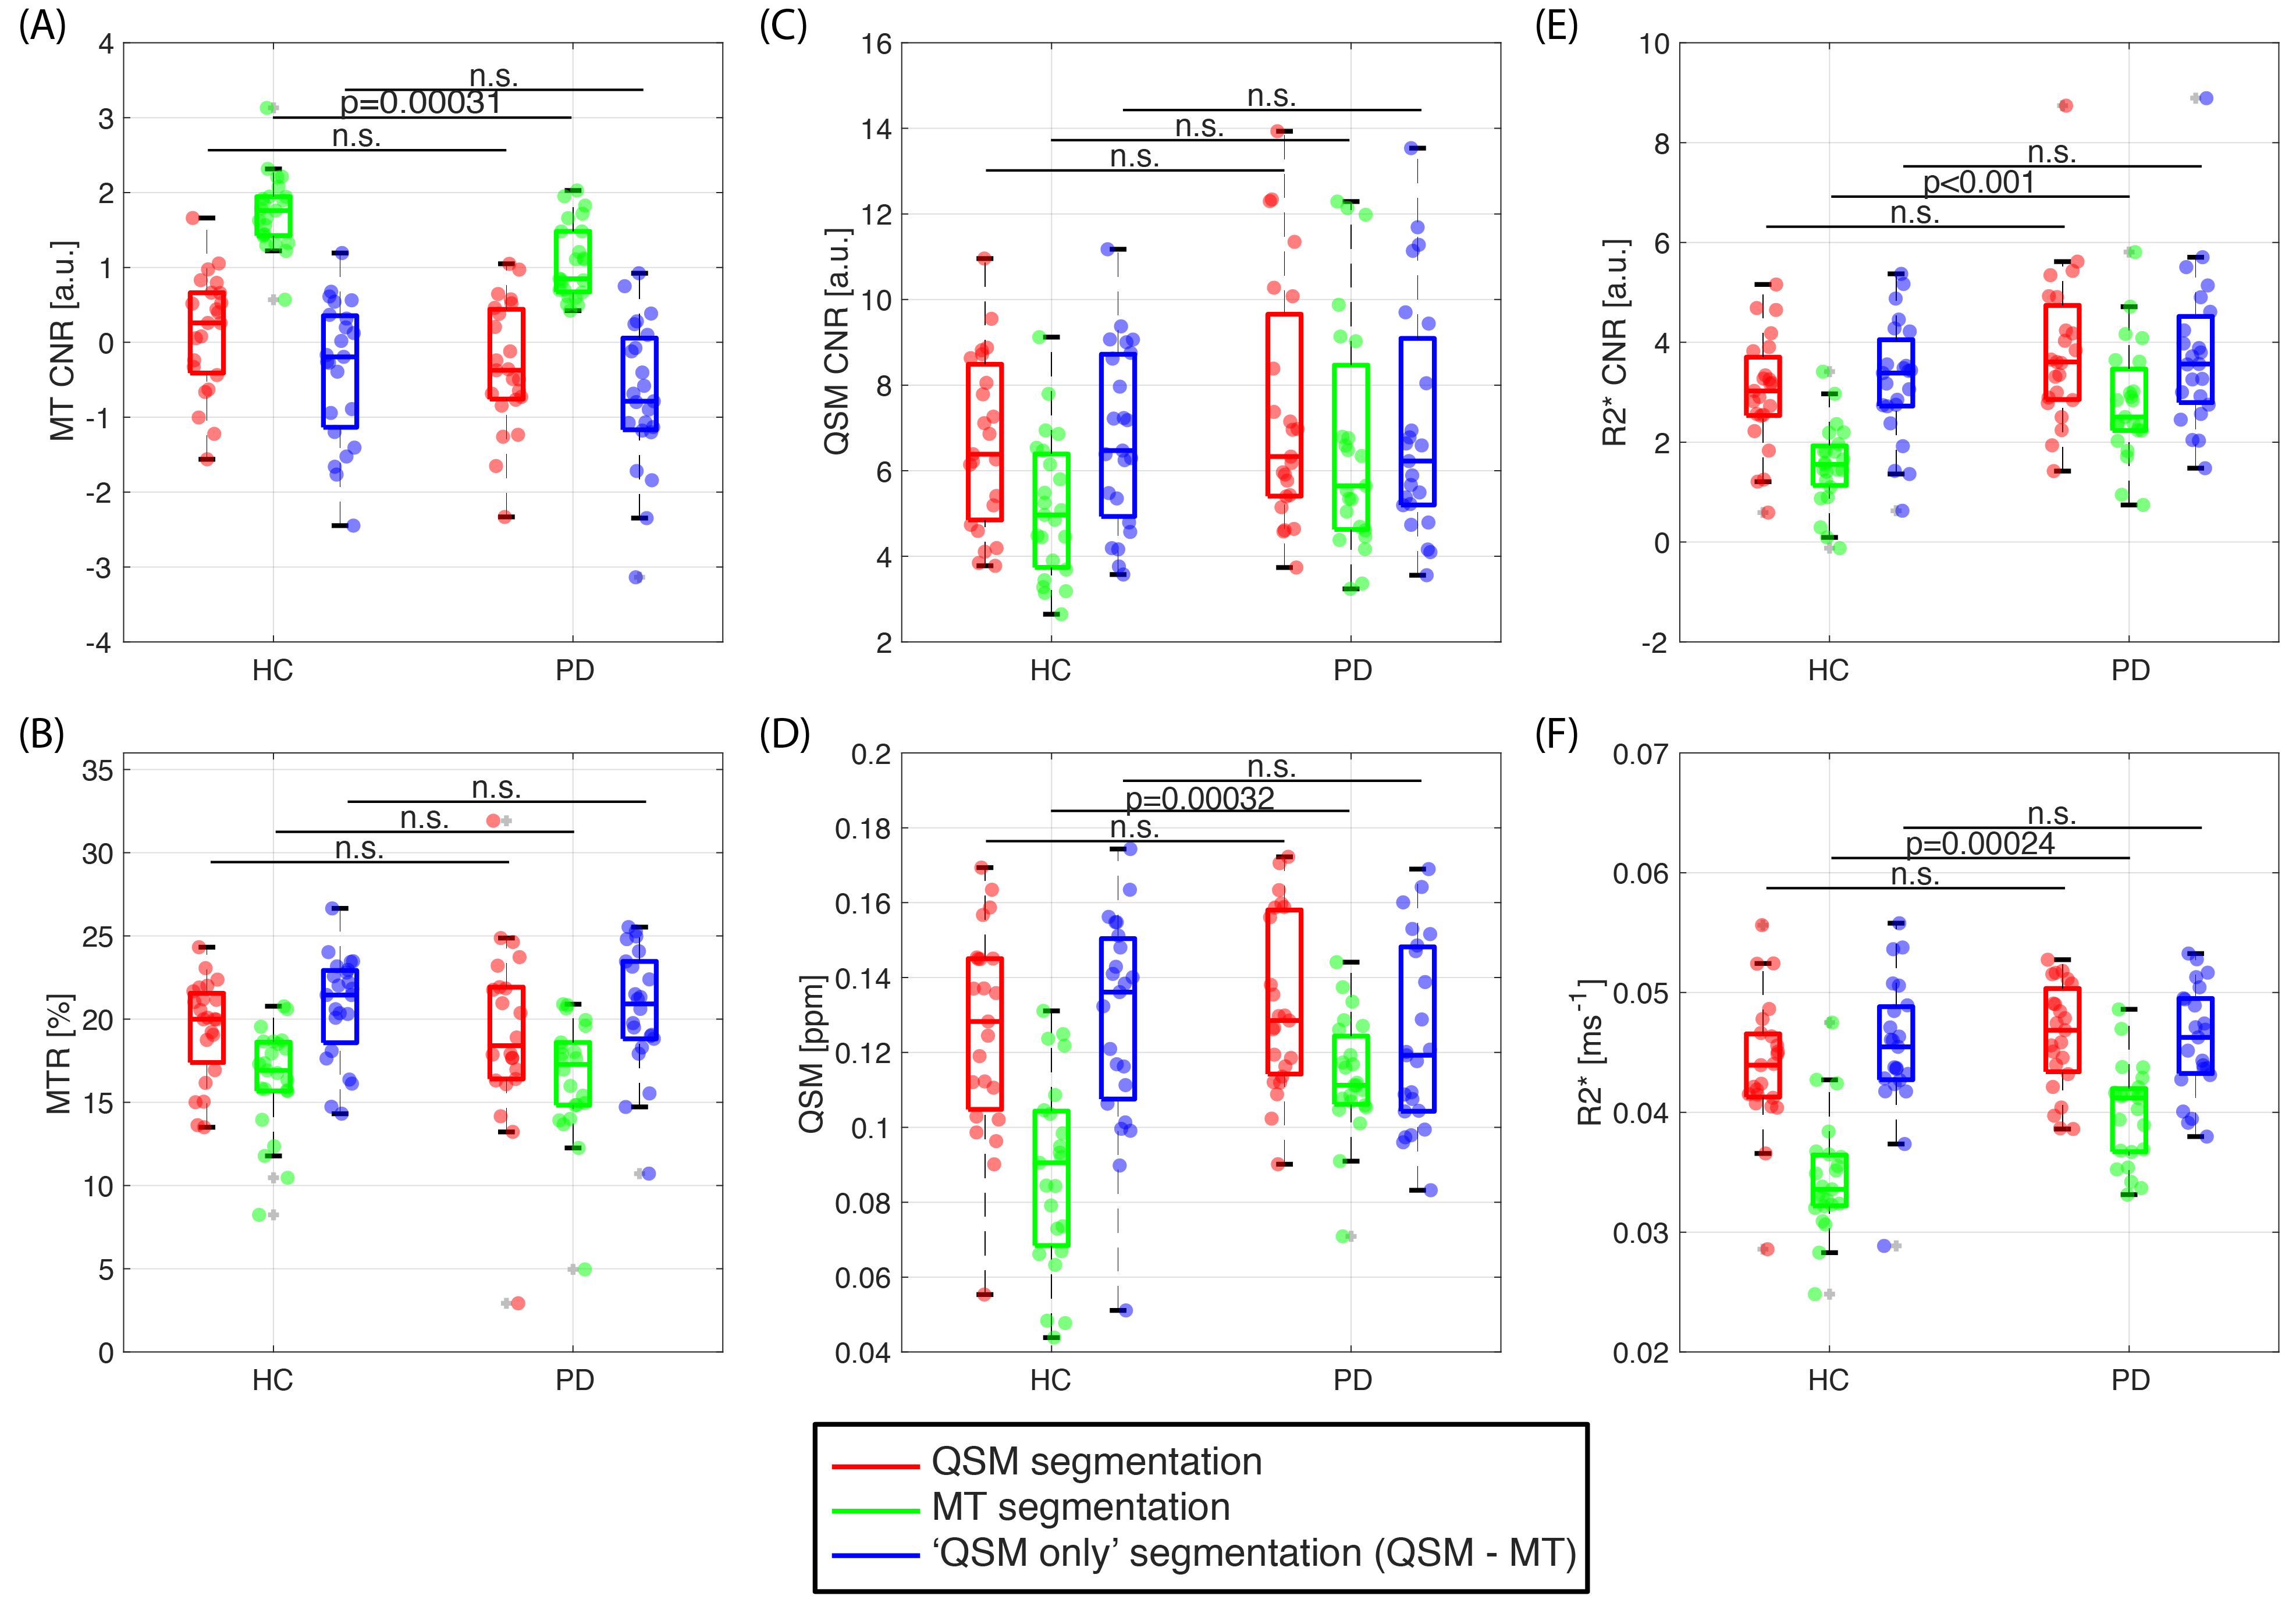
From all the metrics, MT CNR showed a significant decrease in PD compared to HC group in the LC (p=0.0030, Figure 3). We confirmed that for the SN, the MT-w ROI was segmented caudal to the QSM ROI , consistent with the location of SN pars-compacta (SNc) and reticulata (SNr), respectively (Figure 2.B)16. In the SN, there was a significant decrease in MT CNR in PD compared to controls within the MT ROI (p=0.00031) but not in the QSM or ‘QSM only’ ROIs (Figure 4.A). In addition, QSM and R2* values obtained from the MT ROI were significantly higher in PD patients than in heathy subjects (QSM: p=0.00032; R2*: 0.00024). Compared to the MT ROI, in all subjects there is, on average, a significantly increase of approx. 22% in QSM and 20% R2* in the ‘QSM only ROI’ (p<0.001). However, no group difference was found in any iron-related metrics studied (QSM, R2* values or QSM and R2* CNR).Discussion
The MT and R2* MRI properties using ultra-high-field MRI of the LC and SN differ in patients with PD versus controls. Accurate and unbiased ROI definition was obtained via an independent and age-matched dataset at 7T. Group differences in the LC and SN MT contrast were found between patients and controls, together with increased iron-related signal in the SN in patients relative to controls. These results support the hypothesis that neurodegeneration in the SN and LC is associated with reduced neuromelanin and increased iron accumulation17-20. Longitudinal work is necessary to assess whether the in vivo MRI indices of LC and SN degeneration track disease progression and post mortem variability.Acknowledgements
This study was funded by the NIHR Biomedical Research Centre and the Isaac Newton Trust. CTR is funded by a Sir Henry Dale Fellowship from the Welcome Trust and the Royal Society [098436/Z/12/B].References
1. Zecca L, Stroppolo A, Gatti A, Tampellini D, Toscani M, Gallorini M, Giaveri G, Arosio P, Santambrogio P, Fariello RG, Karatekin E. The role of iron and copper molecules in the neuronal vulnerability of locus coeruleus and substantia nigra during aging. Proceedings of the National Academy of Sciences. 2004 Jun 29;101(26):9843-8.
2. Zucca FA, Segura-Aguilar J, Ferrari E, Muñoz P, Paris I, Sulzer D, Sarna T, Casella L, Zecca L. Interactions of iron, dopamine and neuromelanin pathways in brain aging and Parkinson's disease. Progress in neurobiology. 2017 Aug 1;155:96-119.
3. Zucca FA, Bellei C, Giannelli S, Terreni MR, Gallorini M, Rizzio E, Pezzoli G, Albertini A, Zecca L. Neuromelanin and iron in human locus coeruleus and substantia nigra during aging: consequences for neuronal vulnerability. Journal of neural transmission. 2006 Jun 1;113(6):757-67.
4. Chen X, Huddleston DE, Langley J, Ahn S, Barnum CJ, Factor SA, Levey AI, Hu X. Simultaneous imaging of locus coeruleus and substantia nigra with a quantitative neuromelanin MRI approach. Magnetic resonance imaging. 2014 Dec 1;32(10):1301-6.
5. Priovoulos N, Jacobs HI, Ivanov D, Uludağ K, Verhey FR, Poser BA. High-resolution in vivo imaging of human locus coeruleus by magnetization transfer MRI at 3T and 7T. Neuroimage. 2018 Mar 1;168:427-36.
6. Sasaki M, Shibata E, Tohyama K, Takahashi J, Otsuka K, Tsuchiya K, Takahashi S, Ehara S, Terayama Y, Sakai A. Neuromelanin magnetic resonance imaging of locus ceruleus and substantia nigra in Parkinson's disease. Neuroreport. 2006 Jul 31;17(11):1215-8.
7. Langley J, Huddleston DE, Liu CJ, Hu X. Reproducibility of locus coeruleus and substantia nigra imaging with neuromelanin sensitive MRI. Magnetic Resonance Materials in Physics, Biology and Medicine. 2017 Apr 1;30(2):121-5.
8. Rua C, O’Callaghan C, Passamonti L, Jones P S, Tsvetanov K, Rowe J, Ye R, Carpenter TA, Rodgers C T, Williams G. Multi-modal 7T imaging of the Locus Coeruleus in healthy older adults. ISMRM 2019, 2802.
9. Gelman N, Gorell JM, Barker PB, Savage RM, Spickler EM, Windham JP, Knight RA. MR imaging of human brain at 3.0 T: preliminary report on transverse relaxation rates and relation to estimated iron content. Radiology. 1999 Mar;210(3):759-67.
10. Langkammer C, Schweser F, Krebs N, Deistung A, Goessler W, Scheurer E, Sommer K, Reishofer G, Yen K, Fazekas F, Ropele S. Quantitative susceptibility mapping (QSM) as a means to measure brain iron? A post mortem validation study. Neuroimage. 2012 Sep 1;62(3):1593-9.
11. Henkelman RM, Stanisz GJ, Graham SJ. Magnetization transfer in MRI: a review. NMR in Biomedicine: An International Journal Devoted to the Development and Application of Magnetic Resonance In Vivo. 2001 Apr;14(2):57-64.
12. Roemer PB, Edelstein WA, Hayes CE, Souza SP, Mueller OM. The NMR phased array. Magnetic resonance in medicine. 1990 Nov;16(2):192-225.
13. Acosta-Cabronero J, Milovic C, Mattern H, Tejos C, Speck O, Callaghan MF. A robust multi-scale approach to quantitative susceptibility mapping. NeuroImage. 2018 Dec 1;183:7-24.
14. Pei M, Nguyen TD, Thimmappa ND, Salustri C, Dong F, Cooper MA, Li J, Prince MR, Wang Y. Algorithm for fast monoexponential fitting based on Auto‐Regression on Linear Operations (ARLO) of data. Magnetic resonance in medicine. 2015 Feb;73(2):843-50.
15. http://stnava.github.io/ANTs/
16. Langley J, Huddleston DE, Chen X, Sedlacik J, Zachariah N, Hu X. A multicontrast approach for comprehensive imaging of substantia nigra. Neuroimage. 2015 May 15;112:7-13.
17. Haber SN. The primate basal ganglia: parallel and integrative networks. Journal of chemical neuroanatomy. 2003 Dec 1;26(4):317-30.
18. Braak H, Rüb U, Gai WP, Del Tredici K. Idiopathic Parkinson's disease: possible routes by which vulnerable neuronal types may be subject to neuroinvasion by an unknown pathogen. Journal of neural transmission. 2003 May 1;110(5):517-36.
19. Huddleston DE, Langley J, Dusek P, He N, Faraco CC, Crosson B, Factor S, Hu XP. Imaging parkinsonian pathology in substantia nigra with MRI. Current Radiology Reports. 2018 Apr 1;6(4):15.
20. Fearnley JM, Lees AJ. Ageing and Parkinson's disease: substantia nigra regional selectivity. Brain. 1991 Oct 1;114(5):2283-301.
Figures