1529
Assessing the Diagnostic Power of Parkinson’s Disease Biomarkers: Nigrosome-1 Sign, Neuromelanin and Iron Quantification1Department of Radiology, Ruijin Hospital, Shanghai Jiao Tong University School of Medicine, Shanghai, China, 2Department of Neurology, Ruijin Hospital, Shanghai Jiao Tong University School of Medicine, Shanghai, China, 3Magnetic Resonance Innovations, Inc., Bingham Farms, MI, United States, 4Department of Radiology, Wayne State University, Detroit, MI, United States, 5Philips Healthcare, Shanghai, China, 6Department of Biomedical Engineering, Wayne State University, Detroit, MI, United States
Synopsis
Twenty-nine Parkinson’s disease (PD) patients and 29 age- and sex-matched healthy controls (HCs) were scanned using a single 3D gradient echo magnetization transfer sequence to evaluate neuromelanin volume, global and regional iron content, and the appearance of nigrosome-1 territory (the “N1 sign”) in the substantia nigra. Iron increase and neuromelanin volume reduction were found in PD patients compared to HCs. 21/29 and 4/29 of PD patients showed bilateral and unilateral loss of the N1 sign, respectively. Combining the N1 sign with neuromelanin volume, global iron content and regional iron content respectively improved diagnostic performance to differentiate PD patients from HCs.
Introduction
In Parkinson’s disease (PD), iron elevation as well as selective loss of dopaminergic neurons in the nigrosome-1 (N1) territory of the substantia nigra pars compacta (SNpc) is a major pathologic feature1. Identifying the pathologic changes using magnetic resonance imaging is vital for early diagnosis of PD2. In this study, neuromelanin (NM) volume, global and regional iron content, as well as the appearance of N1 (the “N1 sign”) were evaluated using a single 3D gradient echo magnetization transfer contrast (MTC) sequence. Our goal was to demonstrate that the combination of the N1 sign would show higher diagnostic accuracy than NM and iron content separately to differentiate PD patients from healthy controls (HCs).Methods
Twenty-nine PD patients (age range 60.9 ± 9.1 years old) and 29 age- and sex-matched HCs (age range 61.4 ± 8.3 years old) were imaged on a 3T Philips Ingenia scanner using a 3D multi-echo gradient echo MTC sequence. The imaging parameters of the seven-echo 3D susceptibility weighted imaging (SWI) sequence with an activated MTC pulse were as follows: TE1 = 7.5ms, ΔTE = 7.5ms, TR = 62ms, flip angle = 30˚, pixel bandwidth = 174Hz/pixel, matrix size = 384 × 384, slice thickness = 2mm, original spatial in-plane resolution = 0.67 × 1.34mm2 then interpolated to 0.67 × 0.67mm2. We used the first echo in the MTC-SWI magnitude image (TE = 7.5ms) to delineate the NM content since that provides the key MT contrast. The second echo (TE = 15ms) was used for quantitative susceptibility mapping (QSM) to evaluate iron deposition in the SN. The third echo (TE = 22.5ms) was used for comparing the magnitude images with the QSM and true SWI (tSWI) to evaluate the loss of the N1 sign. The susceptibility maps were created using the following steps: the brain extraction tool, BET, to isolate the brain tissue3, a 3D phase unwrapping algorithm (3DSRNCP) to unwrap the original phase data4, sophisticated harmonic artifact reduction (SHARP) to remove unwanted background fields5, and a truncated k-space division (TKD) based inverse filtering technique6 with an iterative approach to reconstruct the final QSM maps.7To measure the NM volume and iron content, the regions of interest (ROIs) for the NM and SN were manually traced on MTC magnitude and QSM maps using SPIN software (SpinTech, Inc., Bingham Farms, MI, USA). All subjects were blindly analyzed for the presence or absence of the N1 sign. To assess the sensitivity and specificity of the proposed models for differential diagnosis, a receiver operating curve (ROC) and area under the curve (AUC) analysis were performed on different parameters using IBM SPSS Statistics Version 22.0.Results
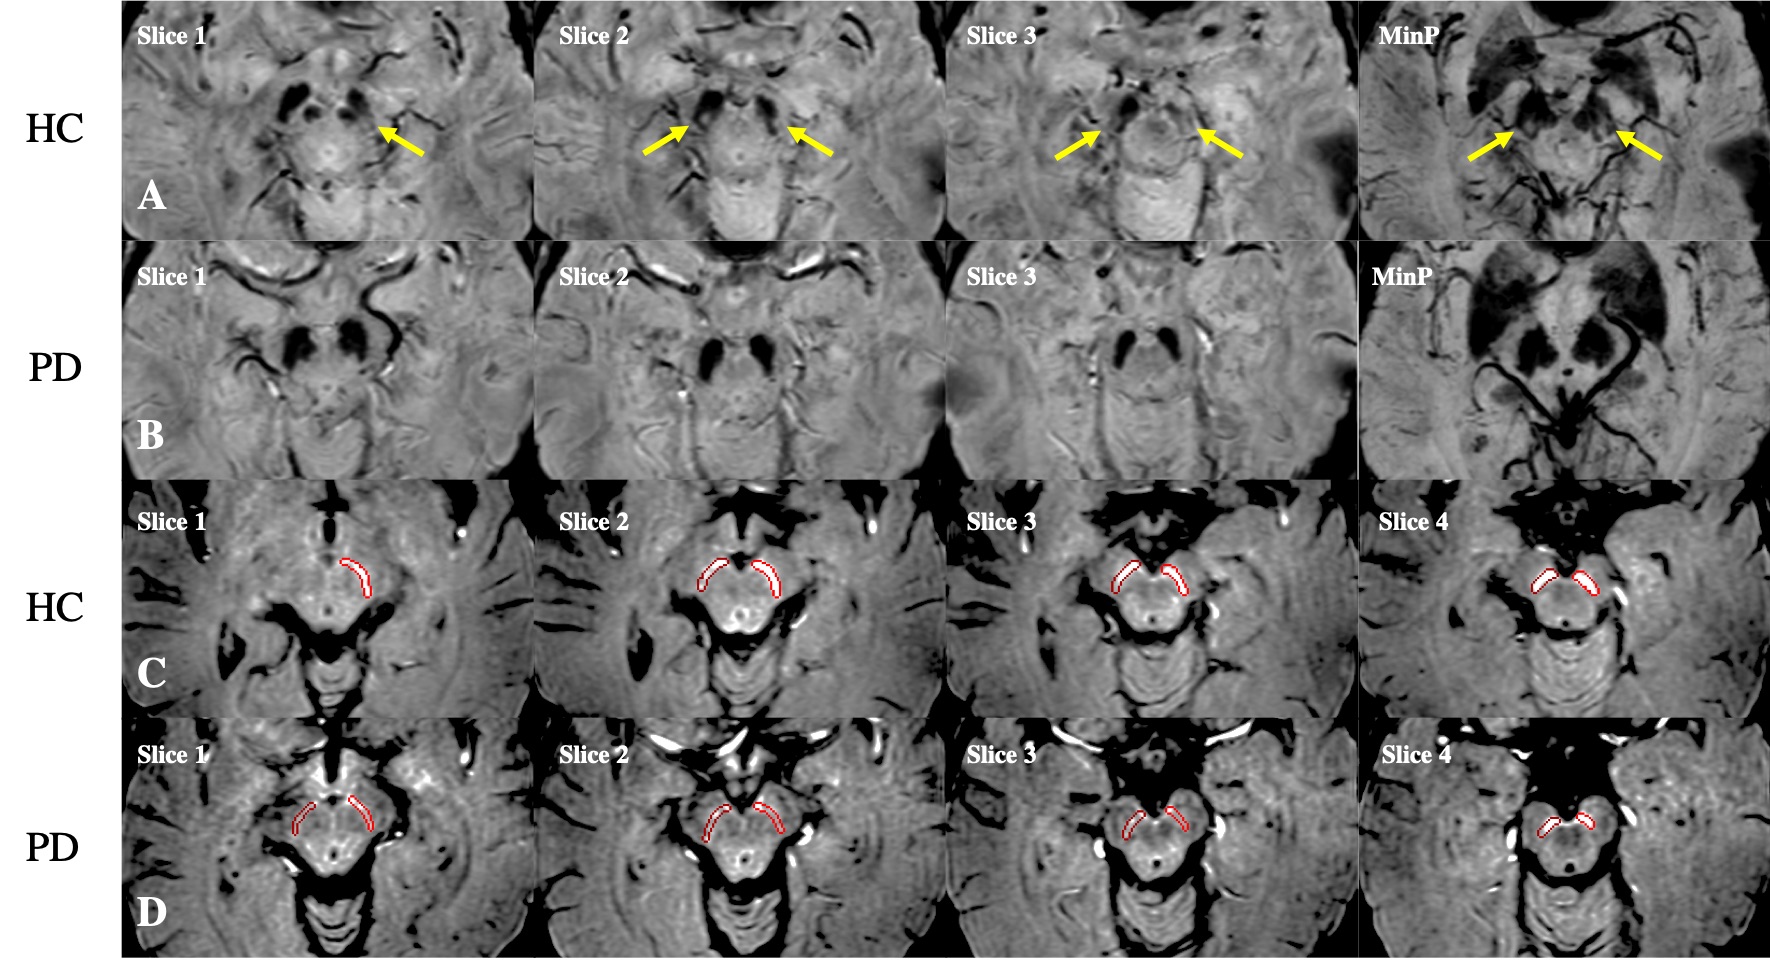
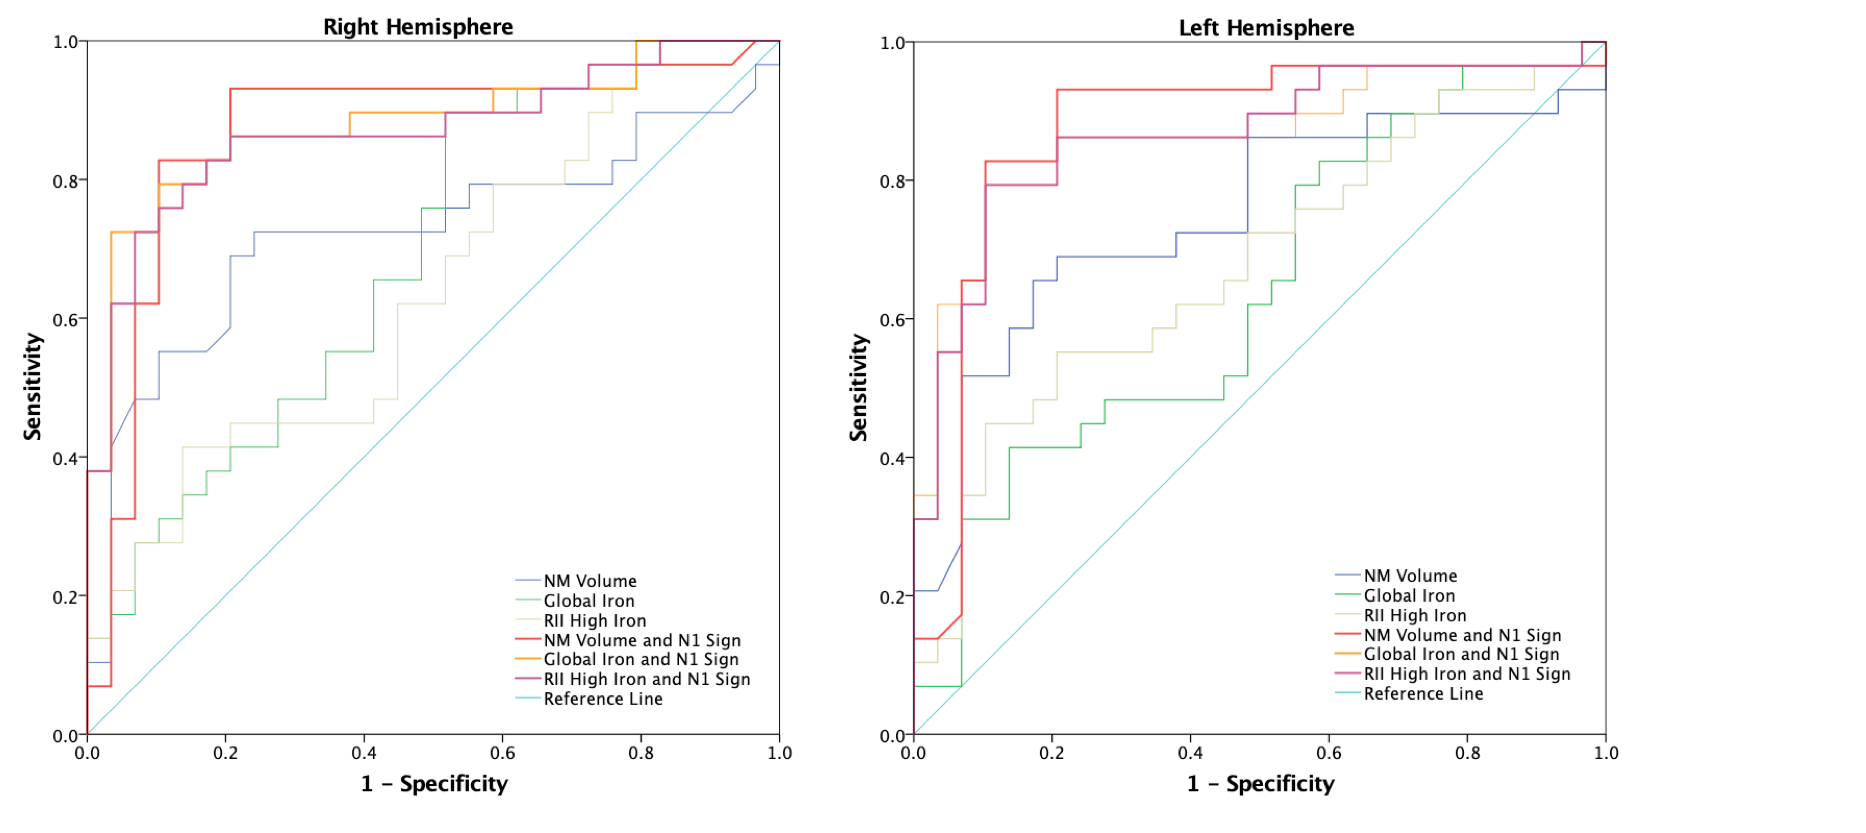
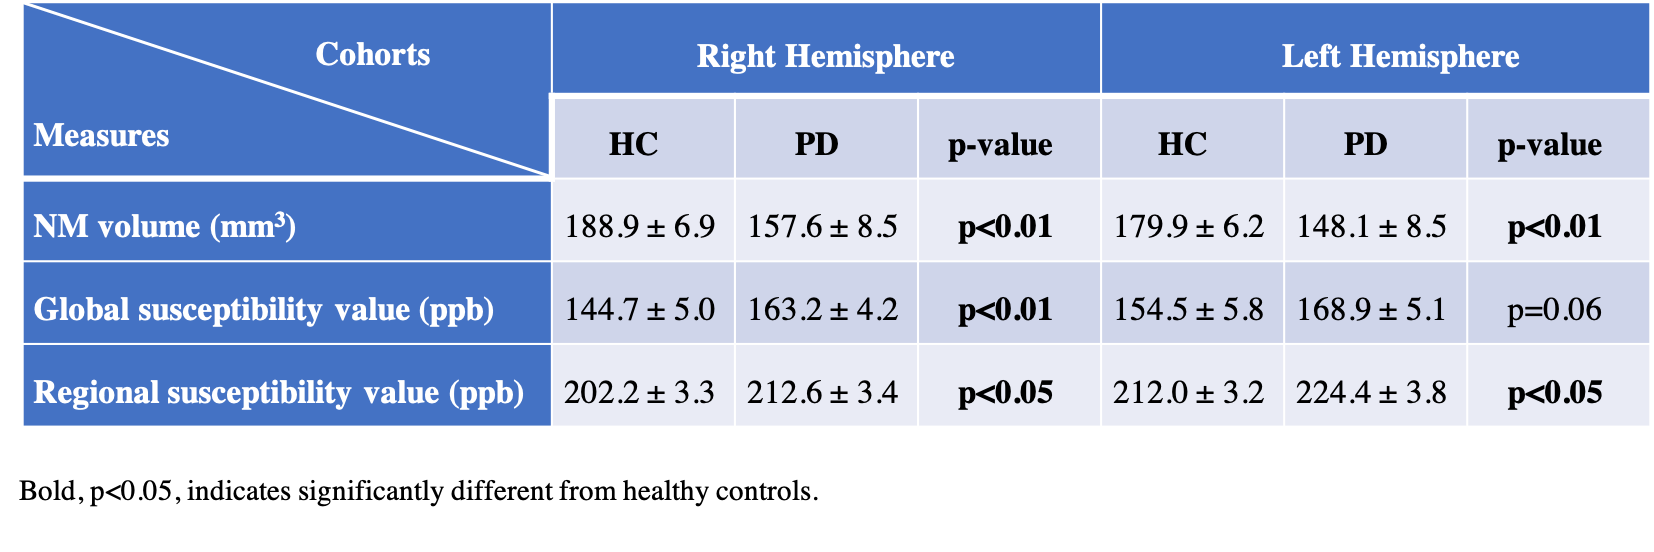
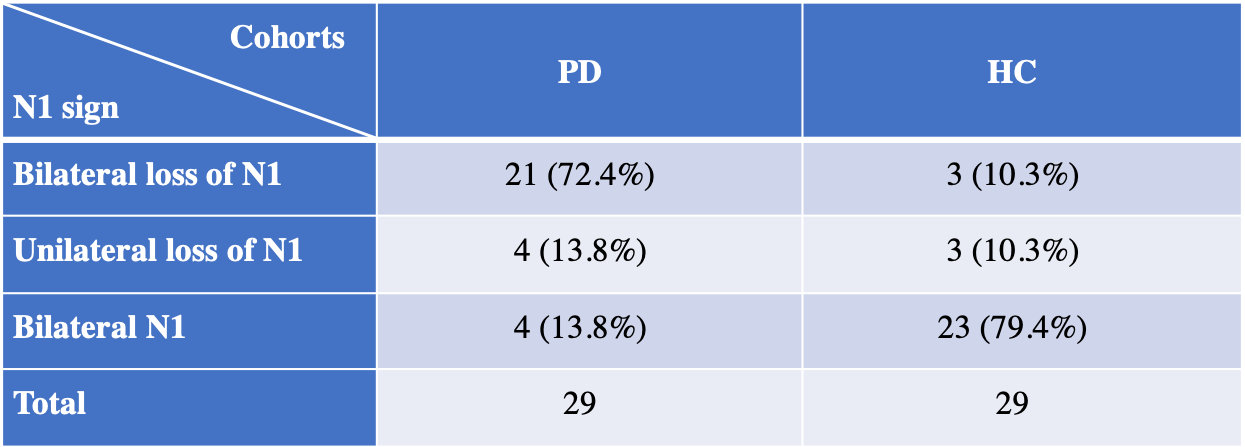
The ROIs representing putative NM content, consecutive slices and minimum intensity projection (MinP) image showing the N1 sign in the SN for a PD patient and HC are illustrated in Figure 1. Significant NM volume reduction and regional iron increase were found in the bilateral SN for the PD group compared to the HC group. However, global iron content increase in PD patients was only found in the right hemisphere (Table 1). As shown in Table 2, 21/29 (72.4%) PD patients and 3/29 (10.3%) HCs showed bilateral loss of the N1 sign, 4/29 (13.8%) PD patients and 3/29 (10.3%) HCs showed unilateral loss of the N1 sign, and 4/29 (13.8%) PD patients and 23/29 (79.4%) HCs showed bilateral presence of the N1 sign. The ROC curves associated with NM volume, global iron content and regional iron content in both hemispheres, as well as the combination of each parameter with the N1 sign using binary logistic regression are displayed in Figure 2. The AUC’s from the ROC curves were calculated as 0.687 and 0.641 for the right hemisphere and 0.639 and 0.678 for the left hemisphere, for the global and regional iron content analyses, respectively. For the NM volume analyses, the AUC’s were 0.724 for the right hemisphere and 0.748 for the left hemisphere. The combination of the N1 sign with NM volume, global iron content and regional iron content showed significantly larger AUC’s than those of single parameter in both hemispheres. The ROC curves demonstrated the effective AUC values were 0.867, 0.880, and 0.869 for the right hemisphere, and 0.873, 0.863, and 0.866 for the left hemisphere, generated from combining the N1 sign with NM volume, global iron content and regional iron content, respectively.Discussion and conclusion
In this preliminary study, iron increase and NM reduction were found in PD patients compared to HCs. The combination of the N1 sign with NM volume, global iron content and regional iron content provided higher diagnostic accuracy than NM volume and iron content separately. The loss of the N1 sign is considered as a reflection of iron elevation and NM degeneration. Using the comprehensive information reflecting the PD pathophysiology by combining the N1 sign with quantification of NM and iron content could provide a stronger diagnostic biomarker for PD. In the future, the longitudinal evaluation of these measurements with a larger sample size is needed to help prove the clinical diagnostic value of our approach.Acknowledgements
No acknowledgement found.References
1. Braak H, Del Tredici K, Rub U, et al. Staging of brain pathology related to sporadic Parkinson’s disease. Neurobiol Aging. 2003; 24:197–211.
2. Takahashi H, Watanabe Y, Tanaka H, et al. Comprehensive MRI quantification of the substantia nigra pars compacta in Parkinson's disease. Eur J Radiol. 2018; 109: 48-56.
3. Smith SM. Fast robust automated brain extraction. Human brain mapping. 2002; 17(3): 143-55.
4. Abdul-Rahman HS, Gdeisat MA, Burton DR, et al. Fast and robust three-dimensional best path phase unwrapping algorithm. Applied optics. 2007; 46(26): 6623-35.
5. Schweser F, Deistung A, Lehr BW, et al. Quantitative imaging of intrinsic magnetic tissue properties using MRI signal phase: an approach to in vivo brain iron metabolism? NeuroImage. 2011; 54(4): 2789-807.
6. Haacke EM, Tang J, Nelavalli J, et al. Susceptibility mapping as a means to visualize veins and quantify oxygen saturation. Journal of magnetic resonance imaging: JMRI. 2010; 32(3): 663-76.
7. Tang J, Liu S, Neelavalli J, et al. Improving susceptibility mapping using a threshold-based K-space/image domain iterative reconstruction approach. Magnetic resonance in medicine: official journal of the Society of Magnetic Resonance in Medicine / Society of Magnetic Resonance in Medicine. 2013; 69(5): 1396-407.
Figures