1528
Can short echo time magnitude image of quantitative susceptibility mapping resembles neuromelanin-sensitive MRI image of the substantia nigra?1Department of Radiology, Huashan Hospital, Fudan University, Shanghai, China, 2GE Healthcare China, Beijing, Shanghai, China
Synopsis
Loss of melanized dopaminergic neurons(1) and iron deposition(2) in substantia nigra (SN) were pathological hallmarks of Parkinson’s disease (PD). Susceptibility images from QSM could detect iron deposition(3, 4) while neuromelanin-sensitive MRI (NM-MRI) could reflect change of melanized dopaminergic neurons(5, 6) in SN. In this study, we found highly spatial similarity of SNhyperintense on Mag1 images from QSM and on NM-MRI images. PD-patients could be differentiated from old HCs on Mag1 images as similar as that on NM-MRI images. Combined with Mag1 and susceptibility images, QSM could provide a promising imaging biomarker for iron deposition and NM deficiency in PD simultaneously.
Introduction
The progressive loss of melanized dopaminergic neurons(1) as well as iron deposition(2) in substantia nigra (SN) have been characterized as the pathological hallmarks of Parkinson’s disease (PD). Thus, neuroimaging techniques sensitive to neuromelanin (NM) and iron are promising tools for the detection of pathological changes associated with PD. Susceptibility images from quantitative susceptibility mapping (QSM) could detect iron deposition(3, 4) while neuromelanin-sensitive MRI (NM-MRI) could reflect the change of melanized dopaminergic neurons(5, 6) in SN. However, in current MR imaging approaches, images sensitive to iron are not sensitive to NM, and vice versa. A number of studies(7-9) have combined QSM and NM-MRI acquisitions to simultaneously explore pathological changes in PD, including NM deficiency and iron deposition in SN. Nevertheless, this approach is time consuming in clinical practice, which can induce head motion and lead to lower quality images. Moreover, registration of the two imaging modalities is needed for subsequent imaging analysis.In clinical practice, we noticed that there was a pair of hyperintense crescent-shaped structures in the midbrain on the first gradient echo magnitude (Mag1) images of QSM, which resembles the previously reported appearance of SN on NM-MRI images. The first echo time of QSM magnifies the short T1 contrast and minimizes T2* effects. Herein, we hypothesize that the midbrain hyperintense regions on Mag1 and NM-MRI images are spatially congruent, and that the morphology and signal changes on Mag1 images have the same diagnostic performance as NM-MRI images in PD. In this study, we therefore aimed to evaluate the spatial similarity of the SN on short echo time magnitude images from QSM and NM-MRI images. The diagnostic performances for Parkinson’s disease (PD) were also assessed based on two modality imaging metrics.
Purpose
To examine the similarity of the hyperintense area on Mag1 images from QSM compared to NM-MRI images, and compare their diagnostic performance in PD.Methods
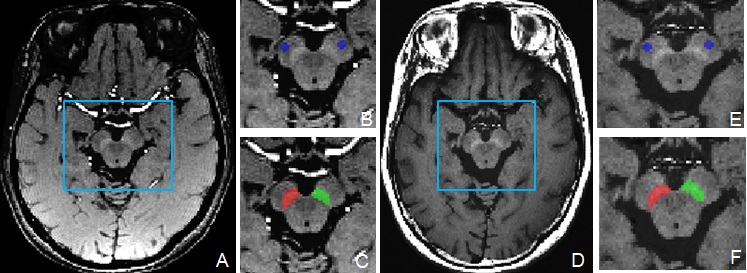
Twenty-three healthy controls (15 older HCs aged between 43 and 66 years, and 8 younger HCs aged between 20 and 34 years), and 18 PD patients aged between 40-79 years were recruited in this study. All MR examinations were performed on a 3.0T scanner (DiscoveryTM MR750, GE Healthcare, Milwaukee, WI). All participants underwent a T1-weighted FSE NM-MRI acquisition (TR/TE = 600/13 ms, flip angle = 145°, FOV = 240 × 240 mm, matrix size = 512 × 320, slice thickness = 1.5 mm, number of slices = 16, NEX = 5, acquisition time = 8:03 min) and a three-dimensional multi-gradient-echo QSM acquisition (TR/TE1 = 41.6/3.2 ms, number of echoes = 16, TE spacing = 2.4 ms, bandwidth = 62.50 kHz, flip angle = 12°, FOV = 256 × 256 mm, matrix size = 256 × 256, slice thickness = 1 mm, number of slices = 140, acceleration factor = 2, acquisition time = 9:00 min). Mag1 (TR=41.6ms, TE=3.2ms) from QSM data were extracted. NM images were first co-registered to the Mag1 images using the SPM12 software package (http://www.fil.ion.ucl.ac.uk/spm/) implemented in MATLAB (Mathworks, Natick, MA). Bilateral SN hyperintense area (SNhyperintense) was manually segmented on Mag1 and co-registered NM-MRI images (Fig. 1). The dice similarity coefficient (DSC) and the average deviation of centers of mass were calculated to compare the spatial overlap in HC. The volume and contrast noise ratios (CNR) of SNhyperintense were acquired to evaluate the diagnostic performance in PD and old HC.Results
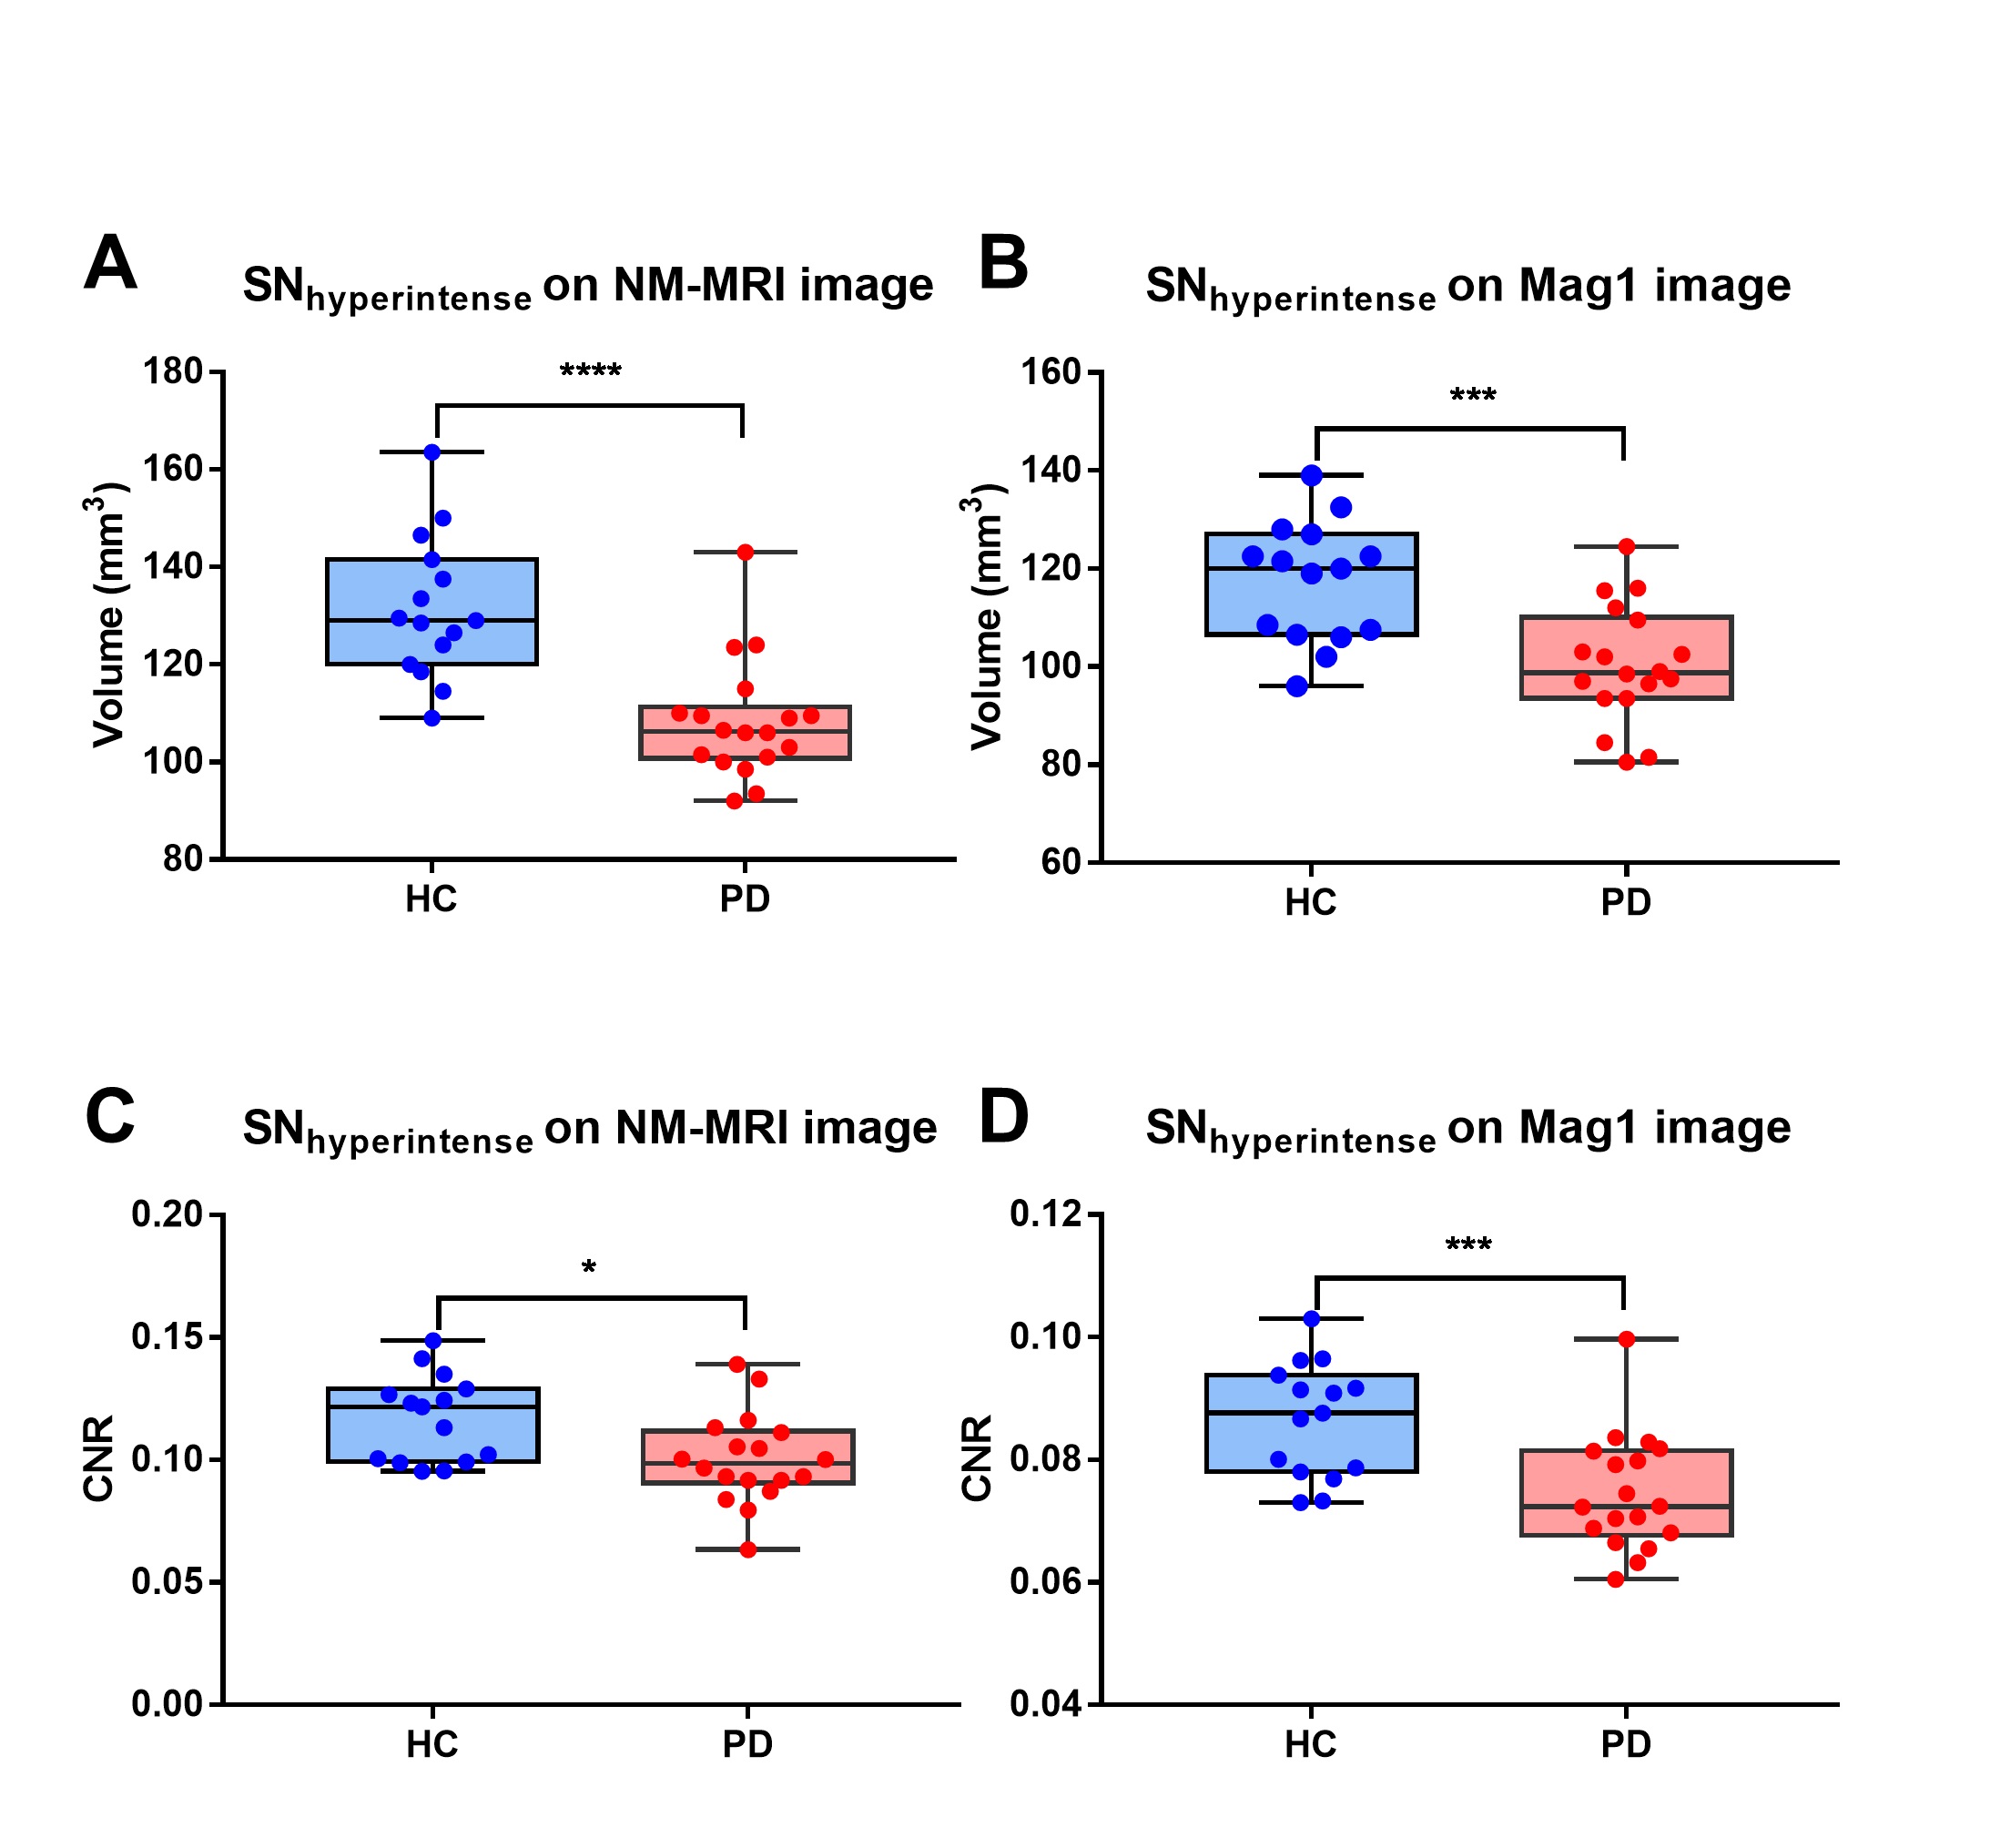
DSC of Mag1 and NM-MRI images were 0.84 ± 0.046 and 0.84 ± 0.047 for right and left SNhyperintense, respectively. The average deviation of centers of mass on Mag1 and NM-MRI images were 0.48 ± 0.29 mm and 0.56 ± 0.26 mm for right and left SNhyperintense, respectively (Fig. 2). The volumes of bilateral SNhyperintense show significant correlations on Mag1 and NM-MRI images, as well as contrast noise ratios (CNRs) (p < 0.001). Both volume and CNR of SNhyperintense were significantly decreased in the PD patient group on Mag1 and NM-MRI images (p < 0.05) (Fig. 3). There was no significant difference in AUC for volume (p = 0.362) and for CNR (p = 0.370) for differentiating PD from older HCs on Mag1 and NM-MRI images (Fig. 4).Discussion
The current study aimed to explore the similarity of the SNhyperintense area on Mag1 and that on NM-MRI images. Our results demonstrated that the SNhyperintense areas on Mag1 and NM-MRI images have a high DSC more than 0.8 and the centers of mass were almost the same with only about 0.5 mm deviation. PD patients exhibited decreased volume and reduced CNR of this area on mag1 images, with an equivalent performance as that on NM-MRI images. Our findings suggested that mag1 from QSM may display the same area as NM-MRI, and could be combined with susceptibility maps to evaluate both iron deposition and neuromelanin changes simultaneously.Conclusion
SNhyperintense showed satisfactory spatial overlap between Mag1 images and NM-MRI images, and can achieve good performance in differentiating PD from HCs by detecting changes in volume and CNR.Acknowledgements
Authors thank Kristina Zeljic for her support in polishing the manuscript. Authors thank all patients and healthy controls in this study.References
1. Fearnley JM, Lees AJ. Ageing and Parkinson's disease: substantia nigra regional selectivity. Brain 1991;114 ( Pt 5):2283-2301
2. Zecca L, Stroppolo A, Gatti A, Tampellini D, Toscani M, Gallorini M, et al. The role of iron and copper molecules in the neuronal vulnerability of locus coeruleus and substantia nigra during aging. Proc Natl Acad Sci U S A 2004;101:9843-9848
3. He N, Ling H, Ding B, Huang J, Zhang Y, Zhang Z, et al. Region-specific disturbed iron distribution in early idiopathic Parkinson's disease measured by quantitative susceptibility mapping. Hum Brain Mapp 2015;36:4407-4420
4. Barbosa JH, Santos AC, Tumas V, Liu M, Zheng W, Haacke EM, et al. Quantifying brain iron deposition in patients with Parkinson's disease using quantitative susceptibility mapping, R2 and R2. Magn Reson Imaging 2015;33:559-565
5. Sasaki M, Shibata E, Tohyama K, Takahashi J, Otsuka K, Tsuchiya K, et al. Neuromelanin magnetic resonance imaging of locus ceruleus and substantia nigra in Parkinson's disease. Neuroreport 2006;17:1215-1218
6. Kitao S, Matsusue E, Fujii S, Miyoshi F, Kaminou T, Kato S, et al. Correlation between pathology and neuromelanin MR imaging in Parkinson's disease and dementia with Lewy bodies. Neuroradiology 2013;55:947-953
7. Langley J, Huddleston DE, Chen X, Sedlacik J, Zachariah N, Hu X. A multicontrast approach for comprehensive imaging of substantia nigra. Neuroimage 2015;112:7-13
8. Langley J, Huddleston DE, Sedlacik J, Boelmans K, Hu XP. Parkinson's disease-related increase of T2*-weighted hypointensity in substantia nigra pars compacta. Mov Disord 2017;32:441-449
9. Jin L, Wang J, Wang C, Lian D, Zhou Y, Zhang Y, et al. Combined Visualization of Nigrosome-1 and Neuromelanin in the Substantia Nigra Using 3T MRI for the Differential Diagnosis of Essential Tremor and de novo Parkinson's Disease. Front Neurol 2019;10:100
Figures