1527
Visualization of Nigrosome-1 with Improved Contrast-to-noise Ratio and Correlation with Signals on Neuromelanin-sensitive MRI
Tzu-Wei Lee1, Chao-Wei Tso1, Kuan Chen1, Cheng-Yu Chen2, and Hua-Shan Liu1
1School of Biomedical Engineering, College of Biomedical Engineering, Taipei Medical University, Taipei City, Taiwan, 2Department of Radiology, School of Medicine, Taipei Medical University, Taipei City, Taiwan
1School of Biomedical Engineering, College of Biomedical Engineering, Taipei Medical University, Taipei City, Taiwan, 2Department of Radiology, School of Medicine, Taipei Medical University, Taipei City, Taiwan
Synopsis
A comparative study of different techniques for delineation of the nigrosome-1 in substantia nigra (SN) is needed to define the most sensitive imaging biomarker for SN-related diseases. This study was conducted to assess the potential of multiecho susceptibility-weighted imaging (SWI) in the delineation of the nigrosome-1. We also evaluated the relationship between neuromelanin (NM) and relaxation times of SN. We found that multiecho SWI can improve the contrast-to-noise ratio (CNR). The older subjects exhibited increased CNR values. The correlation between NM-MRI and T2* value suggested that magnetization-transfer effect may be related to the presence of melanin-iron complex in the nigrosome-1.
Background and Purpose
Nigrosome-1 in the pars compacta of the substantia nigra (SNpc) has been demonstrated to be the most prominent part of the T2*-weighted signal loss induced by Parkinson’s disease (PD)1. Therefore, precisely outlining nigrosome-1 in the SNpc was suggested to improve the accuracy to track disease changes. The comparative study of different techniques for delineation of the nigrosome-1 of the swallow-tail sign in the SNpc may define the most sensitive technique to estimate the possible imaging biomarker of PD. T1-weighted neuromelanin-sensitive MRI (NM-MRI) can reflect the changes of neuromelanin and has shown the potential to detect alterations to SNpc morphology for PD2. However, the mechanism by which the presence of NM might give rise to signal hyperintensity on T2*-weighted signal with the nature of the relationship between hyperintensities of SNpc in the NM-MRI and T2*-weighted signals remains an ongoing question. We evaluated different MR techniques in delineation of the swallow-tail sign in the SNpc using single- and multi-echo SWI pulse sequences and compared the performance between 64- and 20-channel array coils in different subjects with different age through the contrast-to-noise (CNR) measurements. We also investigated the relationship between NM and relaxation times by performing the correlations between hyperintensities of SNpc in the NM-MRI and T2*-weighted signals.Methods
A total of 23 healthy young (20.7±1.21 years) and 25 healthy elder adults (50.28±12.15 years) were recruited. Subjects were scanned using the 64-channel and the 20-channel receive array coils. MR imaging data were acquired on a 3T scanner. SWI data were acquired using a 3D multi-echo gradient-echo sequence with: TR=51 ms; resolution=0.58×0.58×1.5 mm3. Eight echoes with TE from 7.87 to 44.83 ms. SWI data acquired with a single echo scan was included. The averaged SWI (SWIave) was generated by averaging the SWI from different echoes. The averaged magnitude (Magave) and unwrapped phase images (Phaave) from different echoes along with the SWI, magnitude (Mag) and unwrapped phase (Pha) images from the single-echo sequence were also included. For QSM, magnetic susceptibility was obtained from the local tissue phase using the morphology-enabled dipole inversion method3. T2* maps were computed. The CNR was calculated:CNR= (SN1-S0)/σ0 , where SN1 and S0 refer to the mean signals within nigrosome-1 and the neighboring substantia nigra ROIs. σ0 refer to the standard deviation of the neighboring substantia nigra ROI. T1 mapping data were acquired using a 3D sequence (TR/TE=20/5.1 ms, flip angle=50,100,150,200,250,300)4. NM-MRI was performed using T1-weighted fast-spin-echo (TR/TE=600/13 ms). The CNRs were calculated:CNR= (SN1 – Scc)/ σcc , where SN1 and Scc refer to the mean signals within the nigrosome-1 and the background ROIs defined in the bilateral cerebral crus (CC), respectively. σcc refer to the standard deviation of the neighboring CC.Results
The multi-echo SWI technique showed a better imaging quality in visualizing the nigrosome1 (Figure1, arrows) and optic nerves and with improved phase variation artifacts in the areas of frontal and temporal lobes (Figure1, arrow heads). Figure 2 shows a representative slice from a single subject of SWIave, SWI, T2*-map, QSM, T2-map, T1-map and NM-MRI, respectively. The table shows the results of CNRs obtained using different methods. Linear regression analyses comparing CNRs using different methods and between groups of different ages showed effects of method (F=902.896, P<0.0001) and group (F=30.076, P<0.0001). The elder group showed significantly higher swallow-tail CNR using SWIave, Magave, SWI, Mag, and T2*-map compared to the young group (P<0.05). For both groups, the multi-echo SWIave based method generated the highest CNR as compared with other methods. SWI shows higher CNR of swallow-tail sign as compared with magnitude, phase, T2* and QSM. However, no significant difference in CNR of SNpc in the swallow-tail sign between 20CH- and 64CH-array coils was observed. We observed a significant correlation between the T2* value and CNR measurements of NM-MRI in the SNpc (Rho=0.512, P=0.01).Discussion and conclusion
The most important findings of this study are: First, multi-echo SWI can improve the CNR in visualizing the substantia nigra nigrosome1 as compared with the conventional single-echo SWI. The technique we used avoids complex postprocessing compared to other approaches such as QSM. As several echoes can be collected within one TR, the acquisition time can be potentially not prolonged but can lead to a higher SNR in resulting SWI by averaging several images from different echoes. Second, the elder subjects showed significantly increased CNRs as compared with young adults. This result could be attributed to the age-related iron deposits for elder cohort, especially for the pars reticulata of the substantia nigra which surrounds nigrosome-1 and is one of the brain areas that has high iron concentration. Third, there was no significant difference of the CNR between 20- and 64-channel receive array coils. We attribute this finding to the similar SNR in the central brain regions between brain arrays with different numbers of elements in the array coils. Forth, the significant correlation between the CNR measurements of NM-MRI and T2* value in the SNpc is consistent with previous report that MT effect which may provide most of the contrast of NM-containing structures may be related to the presence of melanin-iron complex in SNpc5. The complex also plays a role in determining the relaxation times of SNpc.Acknowledgements
No acknowledgement found.References
- Fearnley JM, Lees AJ. Ageing and Parkinson's disease: substantia nigra regional selectivity. Brain 1991;114:2283-2301.
- Schwarz ST, Rittman T, Gontu V, Morgan PS, Bajaj N, Auer DP. T1-weighted MRI shows stage-dependent substantia nigra signal loss in Parkinson's disease. Mov Disord 2011;26:1633-1638.
- Liu T, Liu J, de Rochefort L, et al. Morphology enabled dipole inversion (MEDI) from a single-angle acquisition: comparison with COSMOS in human brain imaging. Magn Reson Med 2011;66:777-783.
- Fram EK, Herfkens RJ, Johnson GA, et al. Rapid calculation of T1 using variable flip angle gradient refocused imaging. Magn Reson Imaging 1987;5:201-208.
- Trujillo P, Summers PE, Ferrari E, et al. Contrast mechanisms associated with neuromelanin-MRI. Magn Reson Med 2017;78:1790-1800.
Figures
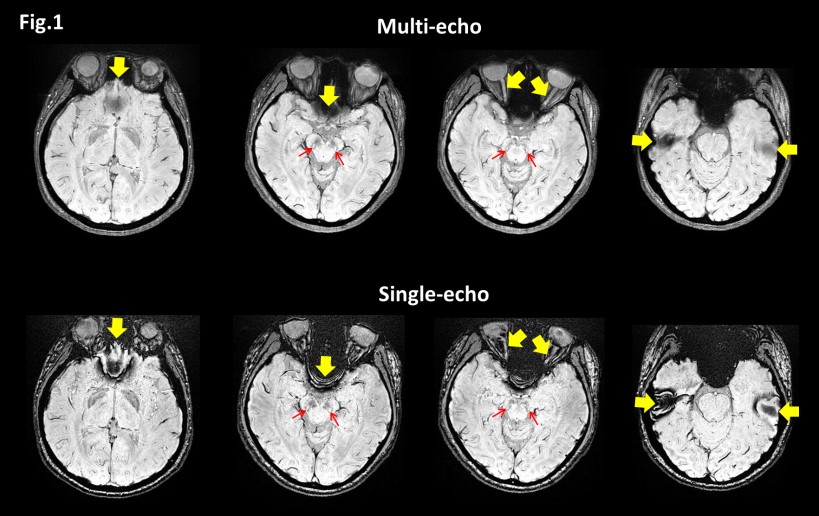
Figure 1. Representative images of multi-echo (upper row) and
single-echo SWIs (lower row) from the same subject with four
slices. Multi-echo SWI exhibits
improved image quality with increased SNR and CNR in the nigrosome1 (arrows)
and reduced susceptibility artifacts in
observing the optic nerves and frontal and temporal lobes (arrow heads).
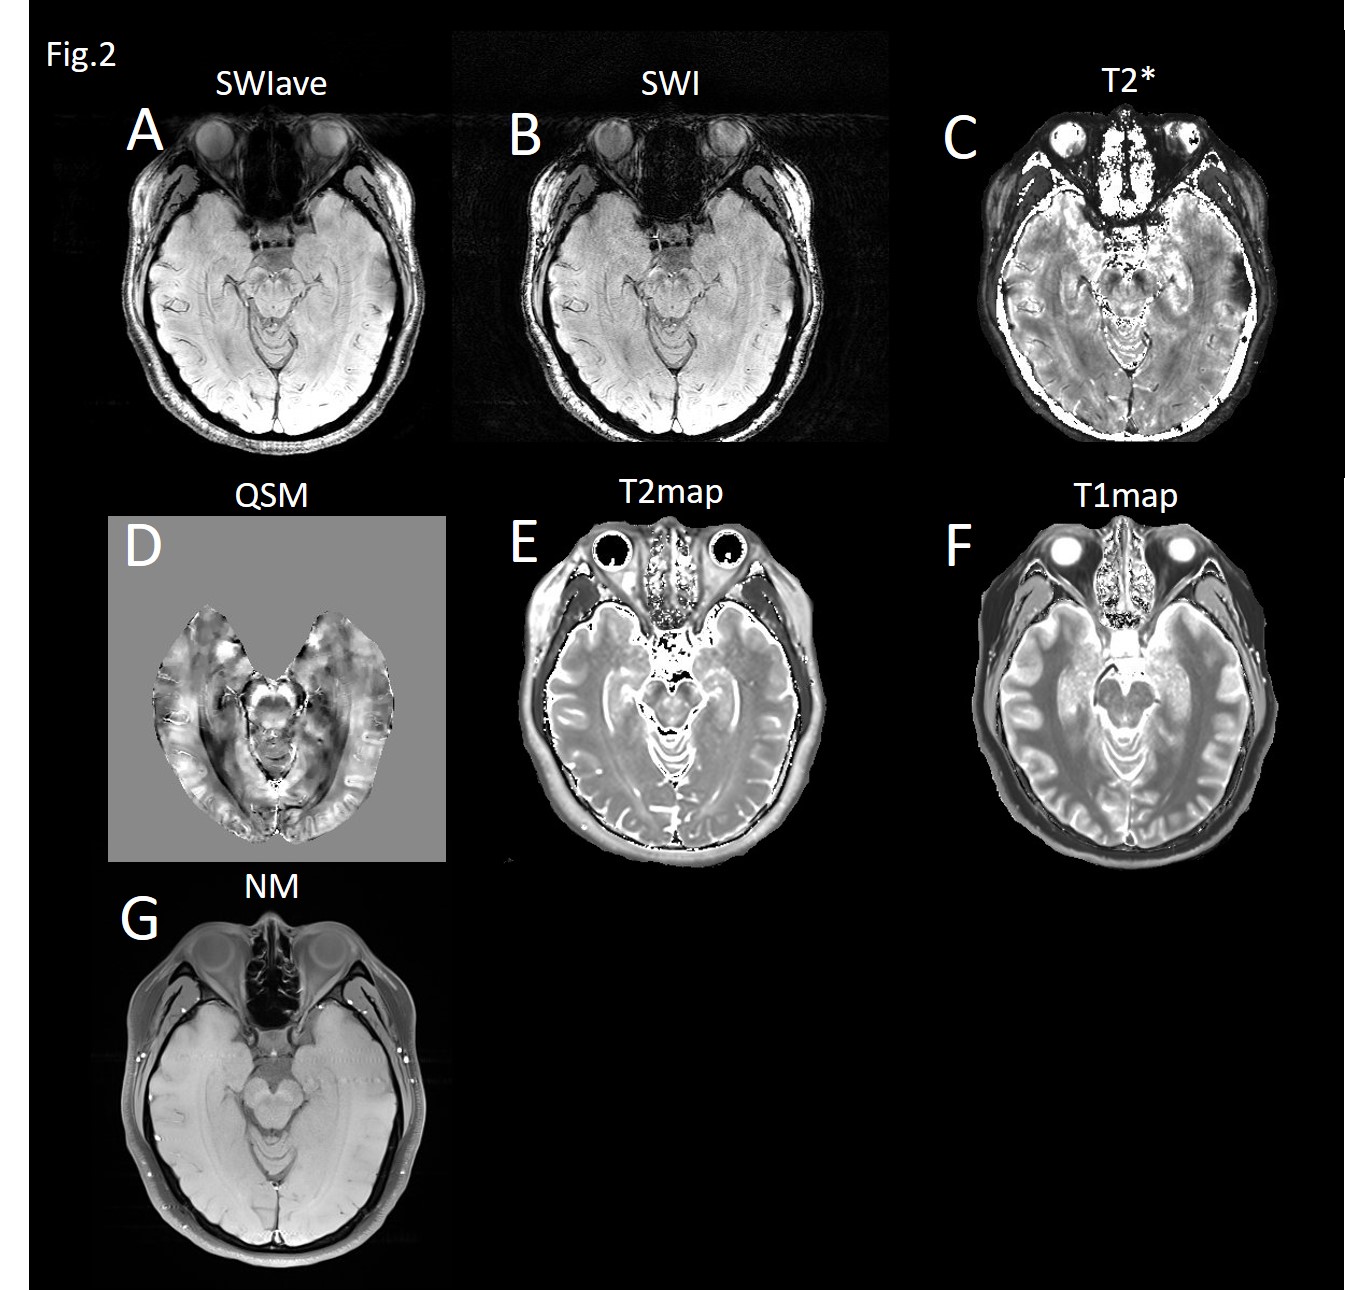
Figure 2. Representative images of (A) multi-echo susceptibility-weighted image (SWIave), (B) single-echo SWI, (C)T2* map, (D)
quantitative-susceptibility
mappings (QSM), (E) T2 map, (F) T1 map and (G) neuromelanin-sensitive MRI (NM-MRI).
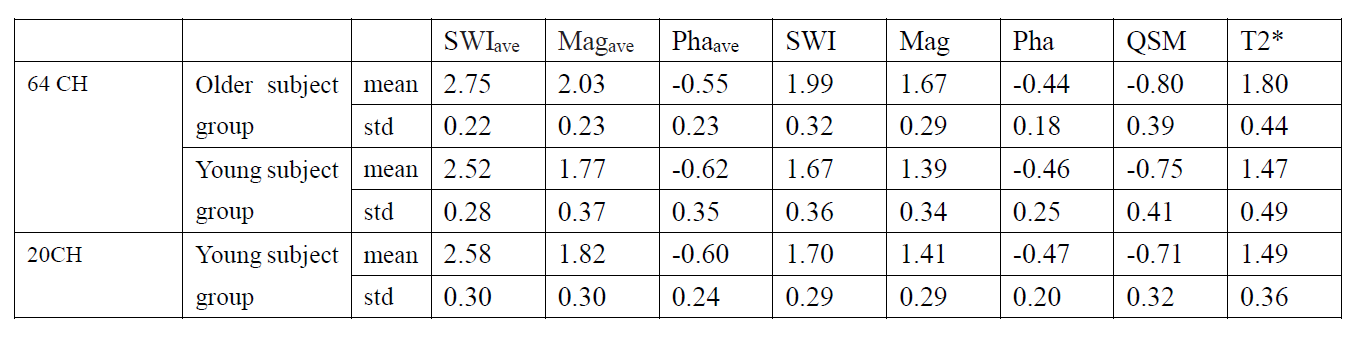
Table. Mean
and standard deviation (std) of the CNR ratio in the nigrosome1 of the swallow
tail sign for different groups and methods