1522
Evaluation of the Substantia Nigra and Locus Coeruleus by Neuromelanin-Sensitive MR Imaging with Deep Learning Based Noise Reduction1Department of Diagnostic Radiology and Nuclear Medicine, Graduate School of Medicine, Kyoto University, Kyoto, Japan, 2MRI Systems Division, Canon Medical Systems Corporation, Otawara, Japan, 3Human Brain Research Center, Graduate School of Medicine, Kyoto University, Kyoto, Japan, 4Department of Advanced Medical Imaging Research, Graduate School of Medicine, Kyoto University, Kyoto, Japan
Synopsis
We assessed neuromelanin-sensitive MR images with number of excitations of 1 or 2 with and without deep learning reconstruction (DLR) denoising method about visualization of the substantia nigra (SN) and locus coeruleus (LC) in 19 patients. The results of visual assessment were better in images with DLR. Contrast ratios of SN did not change after application of DLR, whereas contrast ratios of LC were decreased and hyperintense SN areas became larger. Neuromelanin imaging with DLR has a potential to reduce scan time without spoiling image quality, but further studies are needed for interpreting the signal contrast of SN and LC.
Introduction
Neuromelanin-sensitive MR imaging has been developed to visualize the substantia nigra (SN) and locus coeruleus (LC). Previous studies have proven that this imaging can be a potential tool to diagnose or evaluate the severity of disorders such as Parkinson’s disease (PD), Alzheimer’s disease (AD) and schizophrenia by assessing contrast ratio or high intensity area of SN or LC.1-6 However, they require relatively long scan time. Recently, deep learning reconstruction (DLR) method for image noise reduction has been developed, which can reduce acquisition time without spoiling image quality.7 The aim of this study is to evaluate the visualization of the SN and LC on neuromelanin-sensitive MR images with different numbers of excitations (NEX) with and without DLR.Methods
SubjectsThis prospective study was approved by the institutional review board. We enrolled 19 patients (7 males and 12 females; mean age 71, range 39-89 years) who had not been diagnosed as PD, AD or schizophrenia. They underwent neuromelanin-sensitive MR imaging.
MR image acquisition and denoising with DLR
MR imaging was performed at a 3T MR scanner (Vantage Galan 3T / ZGO, Canon Medical Systems, Otawara, Japan) with a 32-channel head coil. We acquired neuromelanin-sensitive images (2D gradient echo pulse sequence with MTC preparation) with NEX1 and NEX2.
The parameters were as follows: TE, 2.7 ms; TR, 460 ms; 15 slices; slice thickness/gap, 3/0 mm; in-plane resolution, 0.55 × 0.55 mm2; matrix, 416 × 416; FOV, 230 × 230 mm2; flip angle, 40°; bandwidth, 244.1 Hz/pixel; MTC pulses, 300°, 1.2 kHz off resonance; and acquisition time, 3 minutes 12 seconds per NEX.
Denoising was applied to each sequence using DLR algorithm7 to make DLR-NEX1 and DLR-NEX2.
Image analysis
All the images were analyzed using ImageJ (National Institutes of Health, Bethesda, Maryland, United States).
1. Quantitative assessment
1-1. Contrast ratio
ROIs of the SN, superior cerebellar peduncle (SCP), LC and pontine tegmentum (PT) were manually placed on the slices where SN or LC was most clearly delineated (Figure 1a,1b). The contrast ratios were defined as follows: mean signal intensity (SI) of SN divided by mean SI of SCP, and mean SI of LC divided by mean SI of PT.
1-2. Hyperintense SN area
We outlined the surrounding background regions (cerebral peduncles and tegmentum) (Figure 1c). The threshold value was calculated as follows: background mean SI + 3 SD. The hyperintense SN area was defined by the number of pixels with higher SI than the calculated threshold. Results of right and left SN were added.
2. Subjective assessment
A board-certified neuroradiologist scored image quality and identification of the SN and LC on the same slices as quantitative analysis above. The criteria were: 1 = poor, 2 = fair, 3 = good, 4 = excellent.
Statistical analysis
Differences between four groups were examined using Freidman test. P < 0.05 was considered statistically significant.
Results
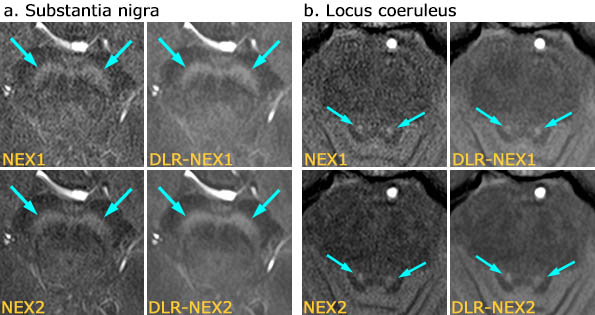
Images of SN and LC with NEX1, DLR-NEX1, NEX2 and DLR-NEX2 are shown in Figure 2.1. Quantitative assessment
1-1. Contrast ratio (Figure 3)
The contrast ratios of SN were significantly higher in NEX2 and DLR-NEX2 than NEX1 and DLR-NEX1. There was no significant difference between NEX1 and DLR-NEX1, and between NEX2 and DLR-NEX2. As for LC contrast ratio, the contrast ratios were lower in DLR-NEX1 than NEX1, and in DLR-NEX2 than NEX2. There were also significant differences between NEX1 and DLR-NEX2, and between DLR-NEX1 and DLR-NEX2.
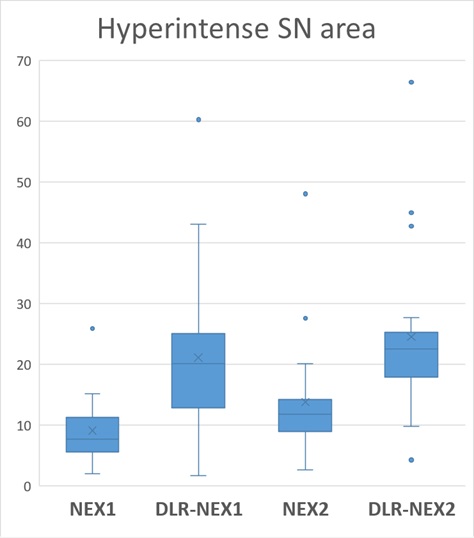
1-2. Hyperintense SN area (Figure 4)
The hyperintense SN area was significantly larger in the order of DLR-NEX2, DLR-NEX1, NEX2 and NEX1.
2. Subjective assessment (Figure 5)
The image quality at SN level and identification of SN was significantly better in the order of DLR-NEX2, DLR-NEX1, NEX2 and NEX1. The image quality at LC level of DLR-NEX1 and DLR-NEX2 was superior to NEX1 and NEX2. As for identification of LC, DLR-NEX1 and DLR-NEX2 delineated the LC better than NEX1 and NEX2, respectively. NEX2 was superior to NEX1. There was no significant difference between DLR-NEX1 and NEX2.
Discussion
We revealed better subjective image quality and delineation of the SN and LC in neuromelanin-sensitive MR imaging with DLR than those without DLR. DLR-NEX1 was not inferior to NEX2, suggesting the potential of DLR to reduce scan time without spoiling image quality. Our results suggest that the results may change after DLR when we perform assessment based on the contrast between structures. Though there was no significant change of SN contrast ratio by using DLR, the contrast ratio of LC was decreased after applying DLR. This is probably because the signal of PT was slightly elevated in images with DLR. The reason why hyperintense SN areas were larger in the images with DLR may be that SD of background area became lower due to noise removal. Further studies are needed to evaluate the utility of DLR images for the assessment of SN and LC in patients with PD, AD or schizophrenia.Conclusion
We demonstrated better visualization of the SN and LC in neuromelanin-sensitive images using DLR and the possibility of reducing scan time without spoiling image quality, though further studies are needed about interpretation of signal contrast between structures.Acknowledgements
No acknowledgement found.References
1. Sasaki M, Shibata E, Ohtsuka K, et al. Visual discrimination among patients with depression and schizophrenia and healthy individuals using semiquantitative color-coded fast spin-echo T1-weighted magnetic resonance imaging. Neuroradiology, 2010. 52(2): p. 83-9.
2. Cassidy CM, Zucca FA, Girgis RR, et al. Neuromelanin-sensitive MRI as a noninvasive proxy measure of dopamine function in the human brain. Proc Natl Acad Sci USA. 2019 Mar 12;116(11):5108-5117.
3. Trujillo P, Petersen KJ, Cronin MJ, et al. Quantitative magnetization transfer imaging of the human locus coeruleus. Neuroimage. 2019 Oct 15;200:191-198.
4. Takahashi J, Shibata T, Sasaki M, et al. Detection of changes in the locus coeruleus in patients with mild cognitive impairment and Alzheimer’s disease: High-resolution fast spin-echo T1-weighted imaging. Geriatr Gerontol Int. 2015 Mar;15(3):334-40.
5. Milos D, Alessa M, Patrick M, et al. Optimal Cut-Off Value for Locus Coeruleus-to-Pons Intensity Ratio as Clinical Biomarker for Alzheimer’s Disease: A Pilot Study Journal of Alzheimer’s Disease Reports 1 (2017) 159–167.
6. Huddleston D, Langley J, Sedlacik J, et al. In vivo detection of lateral-ventral tier nigral degeneration in Parkinson's disease. Hum Brain Mapp. 2017 May;38(5):2627-2634.
7. Kidoh M, Shinoda K, Kitajima M, et al. Deep Learning Based Noise Reduction for Brain MR Imaging: Tests on Phantoms and Healthy Volunteers. Magn Reson Med Sci. 2019 Sep 4. doi: 10.2463/mrms.mp.2019-0018. [Epub ahead of print]
Figures
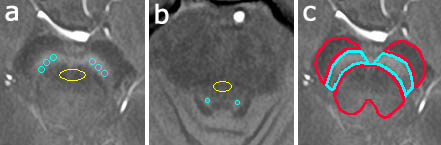
(a) Contrast ratio of SN was calculated as follows: the mean signal intensity of the SN (blue ROIs) was divided by the mean signal intensity of the SCP (yellow ROI).
(b) Contrast ratio of LC was calculated as follows: the mean signal intensity of the LC (blue ROIs) was divided by the mean signal intensity of the PT (yellow ROI).
(c) The ROIs of SN (blue) and background (red) are shown. The hyperintense SN area was defined by the number of pixels with higher signal intensity than the calculated threshold (background mean signal intensity + 3 SD).
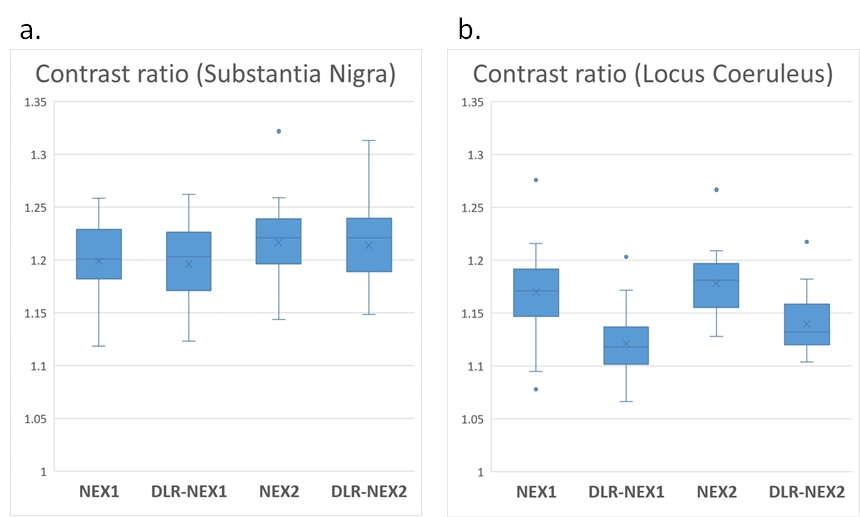
(a) The contrast ratios of SN were significantly higher in NEX2 and DLR-NEX2 than NEX1 and DLR-NEX1. There was no significant difference between NEX1 and DLR-NEX1, and between NEX2 and DLR-NEX2.
(b) The contrast ratio of LC was reduced after application of DLR to NEX1 and NEX2.
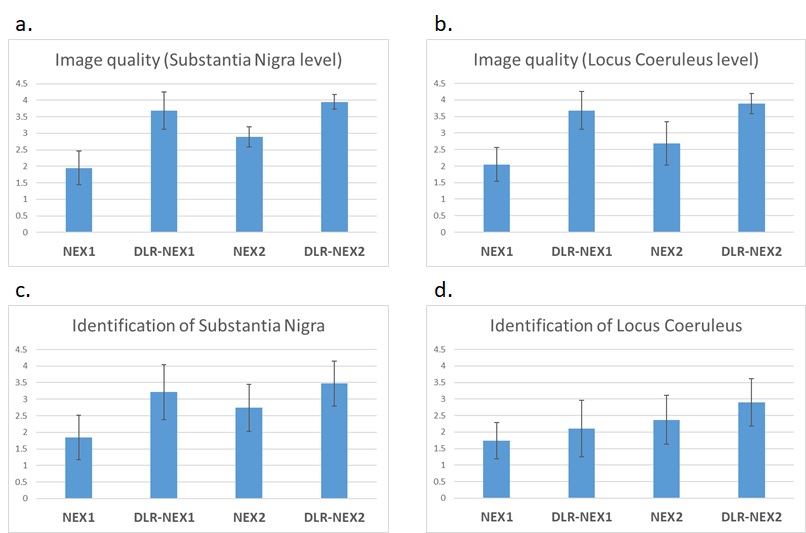
The image quality at SN level (a) and identification of SN (c) was significantly better in the order of DLR-NEX2, DLR-NEX1, NEX2 and NEX1.
The image quality at LC level (b) of DLR-NEX1 and DLR-NEX2 were superior to NEX1 and NEX2.
As for identification of LC (d), DLR-NEX1 was better than NEX1, and DLR-NEX2 was better than NEX2. There was no significant difference between DLR-NEX1 and NEX2.