1521
Quantifying Nigrosome-1 Loss in the Substantia Nigra on Susceptibility-Map Weighted Images in Essential Tremor and Parkinson’s Disease
Septian Hartono1,2, Isabel Hui Min Chew3, Amanda Jieying Lee3, Joey Xin Yi Oh3, Leon Qi Rong Ooi4, Yao-Chia Shih3, Jongho Lee5, Zheyu Xu1,2, Eng King Tan1,2, and Ling Ling Chan2,3
1Department of Neurology, National Neuroscience Institute, Singapore, Singapore, 2Duke-NUS Medical School, Singapore, Singapore, 3Department of Diagnostic Radiology, Singapore General Hospital, Singapore, Singapore, 4Department of Electrical & Computer Engineering, National University of Singapore, Singapore, Singapore, 5Department of Electrical & Computer Engineering, Seoul National University, Seoul, Korea, Republic of
1Department of Neurology, National Neuroscience Institute, Singapore, Singapore, 2Duke-NUS Medical School, Singapore, Singapore, 3Department of Diagnostic Radiology, Singapore General Hospital, Singapore, Singapore, 4Department of Electrical & Computer Engineering, National University of Singapore, Singapore, Singapore, 5Department of Electrical & Computer Engineering, Seoul National University, Seoul, Korea, Republic of
Synopsis
Our study is the first to investigate the value of susceptibility map-weighted imaging in quantifying Nigrosome-1 loss in the substantia nigra to distinguish between tremor-dominant Parkinson’s disease (TDPD) and Essential Tremor (ET). Region-of-interest (ROI) masks of the Substantia Nigra and midbrain background were manually drawn on SMWI images of 50 subjects comprising 18 healthy controls, 25 ET and 7 TDPD patients. The SN in TDPD patients contained significantly more voxels more hypointense than the background than in ET patients. This could be explained by greater Nigrosome-1 loss and iron deposition in TDPD patients early in the disease.
Introduction
Tremors are common in the elderly men, and could be related to idiopathic Parkinson’s disease, Essential Tremor (ET) or aging.1,2 Parkinson’s disease is heterogeneous, with tremor being the dominant symptom in the tremor-dominant Parkinson’s disease (TDPD) subtype. TDPD is typically characterised by rest tremors, whereas ET usually involves action or postural tremors. These symptoms can overlap, making clinical diagnosis challenging.3Nigrosome-1, at the caudal and dorsolateral part of the substantia nigra (SN), is the most affected area with dopamine-containing neurons in patients with Parkinson’s disease. Nigrosome-1 imaging, based on high resolution susceptibility weighted imaging, has been used as a visual surrogate for dopaminergic cell loss in the SN in clinical Parkinsonism.4 Few studies have used Nigrosome-1 imaging in visual MRI brain analysis between ET and Parkinson’s disease patients.5,6 However, visual ratings are subjective and requires training.
High resolution susceptibility map-weighted images (SMWI) was developed to improve Nigrosome-1 visualisation by utilizing the quantitative susceptibility mapping mask to improve the contrast-to-noise ratio between regions with high iron content and surrounding structures.7 In this study, we investigated the value of SMWI imaging in quantifying Nigrosome-1 loss in the substantia nigra to distinguish between TDPD and ET.
Methods
Institutional ethics approval and informed consent from 18 age-matched healthy controls (HC), 25 ET and 7 TDPD patients were obtained. The patients were diagnosed with Parkinson’s disease and ET based on prevailing clinical criteria by movement disorder neurologists at our tertiary referral centre. Clinical demographics, including The Essential Tremor Rating Scale (TETRAS) and MDS-Unified Parkinson’s Disease Rating Scale (MDS-UPDRS), excluding rest tremor components, were charted. All subjects underwent brain MRI scans on a 3T scanner. 3D high resolution T2* SWI images were acquired in an oblique-coronal plane using a multi-echo GRE sequence using the following parameters: TR/TE/FA=48ms/13.77,26.39,39ms/20o; in-plane resolution 0.5x0.5x1.0mm3; 32 slices; scan duration=4:08mins. QSM and SMWI images were reconstructed from SWI images using the SMWI software (Seoul National University, Seoul, South Korea).7SN and background masks were manually drawn on SMWI images by two independent raters,8 blinded to the status of the subjects (Figure 1). These SN and background masks were also superimposed onto the QSM images.
Histogram analysis was performed on the quantitative measures from the SN and background masks. The difference in the mean susceptibility values from the SN and background masks were computed from the QSM images. Statistical analyses were conducted using Mann-Whitney test. Inter-rater reliability was assessed by intraclass correlation coefficient.
Results
Subject clinical demographics are tabulated in Figure 2. Disease duration of ET patients was significantly longer than TDPD patients. TETRAS and UPDRS tremor scores were similar between patient groups, highlighting the similarity in tremor severity.Figure 3 shows representative QSM & SMWI images of the 3 cohorts. Inter-rater reliability was excellent (>0.9) for all quantitative measures on SMWI and QSM.
Mean quantitative values from the SN masks on SMWI and QSM images amongst the study subjects are graphically depicted in Figure 4. The SN mask was smaller in TDPD than HC (p=.449) and ET (p=.338) groups, albeit statistically insignificant (Fig4a). Similarly, the SN mask was more hypointense in TDPD than HC (p=.109) and ET (p=.158) groups (Fig4b). The SN mask in TDPD contained more voxels more hypointense than the background than in ET patients (p=.043) (Fig4c). Similar findings were found between TDPD and HC groups, albeit not significant (p=.196). The SN of TDPD patients had higher susceptibility values than HC (p=0.290) and ET (p=.092), although statistically insignificant (Fig4d).
Discussion
The SN mask was the smallest, most hypointense and contained the most voxels more hypointense than the background in TDPD than HC and ET groups, although the comparison was only statistically significant with respect to the SN containing more hypointense voxels in TDPD than ET patients. These findings can be explained by loss of the hyperintense Nigrosome-1 on SMWI and susceptibility effects secondary to iron deposition, which would be the highest in TDPD patients.9,10 Our results are consistent with previous studies indicating that Nigrosome-1 degrades early in Parkinson’s disease (4 years in our TDPD patients) but not in ET (even nearly 20 years into the disease in our ET patients) despite similarity in clinical tremor scores.5The quantitative differences between our ET and TDPD groups reached statistical significance only when the proportion of voxels in the SN mask with signal intensity thresholded against the background was compared. Nevertheless, this could be used to aid differentiation between ET and TDPD patients when clinical doubt exists.4
The excellent ICC between the 2 raters in segmentation of the SN mask suggest the possibility of automating the process. Further subject recruitment to enlarge the study cohort and ROC analysis for a cut off value for the proportion of voxels in the SN mask with hyperintensity relative to the background on SMWI that could aid in disease classification of TDPD from ET is in process.
Conclusion
The SN in TDPD patients 4 years after diagnosis contained significantly more voxels more hypointense than the background than in ET patients 20 years after diagnosis. This could be explained by greater Nigrosome-1 loss and iron deposition in TDPD patients.Acknowledgements
We would like to thank the Lee Foundation, Singapore for funding this study.References
- Deuschl G, Petersen I, Lorenz D, et al. Tremor in the elderly: essential and aging-related tremor. Movement Disord 2015; 30: 1327–1334.2.
- Louis ED, Ferreira JJ. How common is the most common adult movement disorder? Update on the worldwide prevalence of essential tremor. Mov Disord 2010 25:534–41. doi: 10.1002/mds.228383.
- Kwon KY, Lee HM, Lee SM, Kang SH, Koh SB. Comparison of motor and non-motor features between essential tremor and tremor dominant Parkinson's disease. Journal of the neurological sciences. 2016 Feb 15;361:34-8.4.
- Kim EY, Sung YH, Lee JH. Nigrosome 1 imaging: technical considerations and clinical applications. Br J Radiol. 2019 Sep;92(1101):20180842.5.
- Jin L, Wang J, Wang C, et al. Combined Visualization of Nigrosome-1 and Neuromelanin in the Substantia Nigra Using 3T MRI for the Differential Diagnosis of Essential Tremor and de novo Parkinson's Disease. Front Neurol. 2019 Feb 12;10:100.6.
- Perez Akly MS, Stefani CV, Ciancaglini L, Bestoso JS, Funes JA, Bauso DJ, Besada CH. Accuracy of nigrosome-1 detection to discriminate patients with Parkinson's disease and essential tremor. Neuroradiol J. 2019 May 31:1971400919853787. doi: 10.1177/1971400919853787. [Epub ahead of print]7.
- Nam YH, Gho SM, Kim DH, et al. Imaging of nigrosome-1 in substantia nigra at 3T using multi-echo susceptibility map-weighted imaging (SMWI). J Magn Reson Imaging. 2017 Aug;46(2):528-536.8.
- Kim EY, Sung YH, Shin HG, et al. Diagnosis of Early-Stage Idiopathic Parkinson's Disease Using High-Resolution Quantitative Susceptibility Mapping Combined with Histogram Analysis in the Substantia Nigra at 3 T. J Clin Neurol. 2018 Jan;14(1):90-97.9.
- Damier P, Hirsch EC, Agid Y, Graybiel AM. The substantia nigra of the human brain: II. Patterns of loss of dopamine-containing neurons in Parkinson's disease. Brain. 1999 Aug 1;122(8):1437-48.10.
- Good PF, Olanow CW, Perl DP. Neuromelanin-containing neurons of the substantia nigra accumulate iron and aluminum in Parkinson's disease: a LAMMA study. Brain Res. 1992 Oct 16;593(2):343-6.
Figures
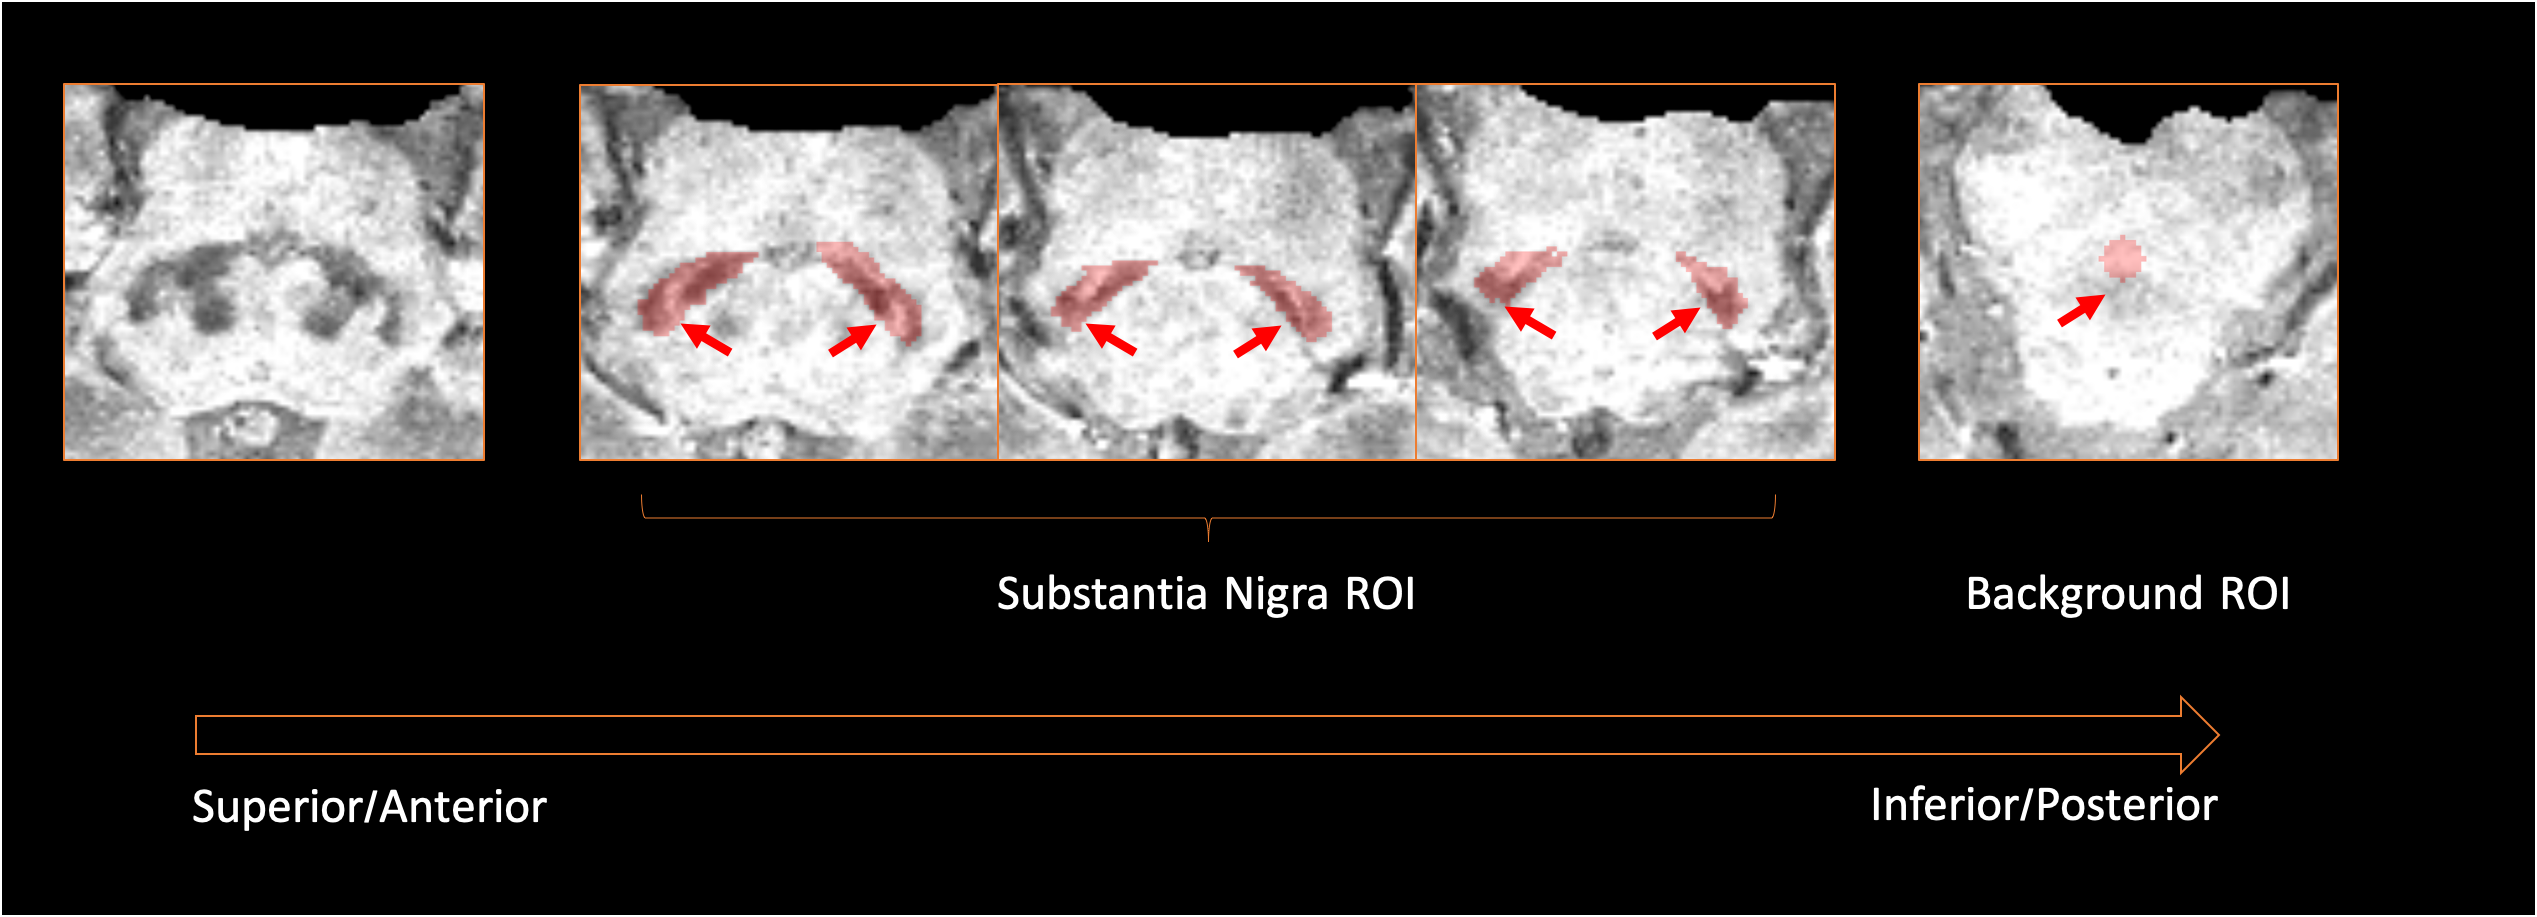
ROIs Placement for the SN and background on SWMI images. Images were visually inspected in the superoinferior-anteroposterior direction to identify the last slice where the inferior tail of the red nucleus is still visible, as shown on the leftmost image. ROI masks were drawn along the margins of the SN on the next consecutive 3 slices. The background ROI mask was placed over the decussation of the superior cerebellar peduncles, which lies inferior to the SN.[ROI=region-of-interest; SN=substantia nigra]
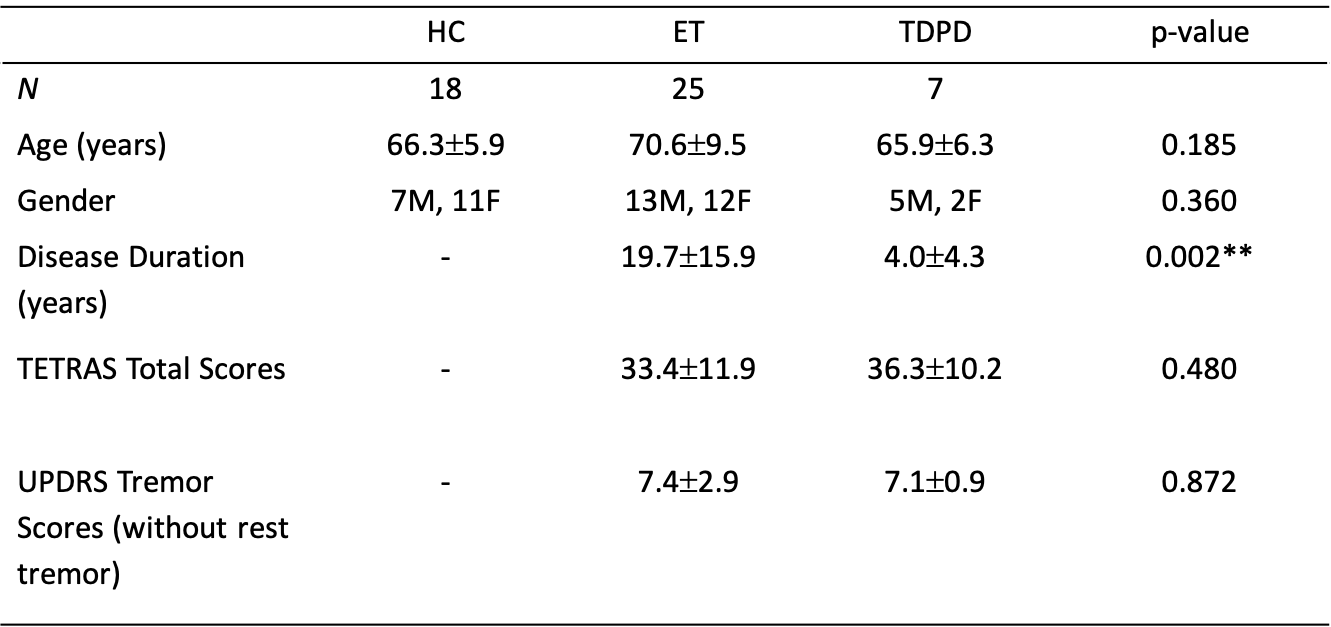
Study demographics of the 3 cohorts. There were no significant differences in the TETRAS and UPDRS Tremor scores (without rest tremor components) between TDPD and ET cohorts, thereby indicating the similar severity of tremors.
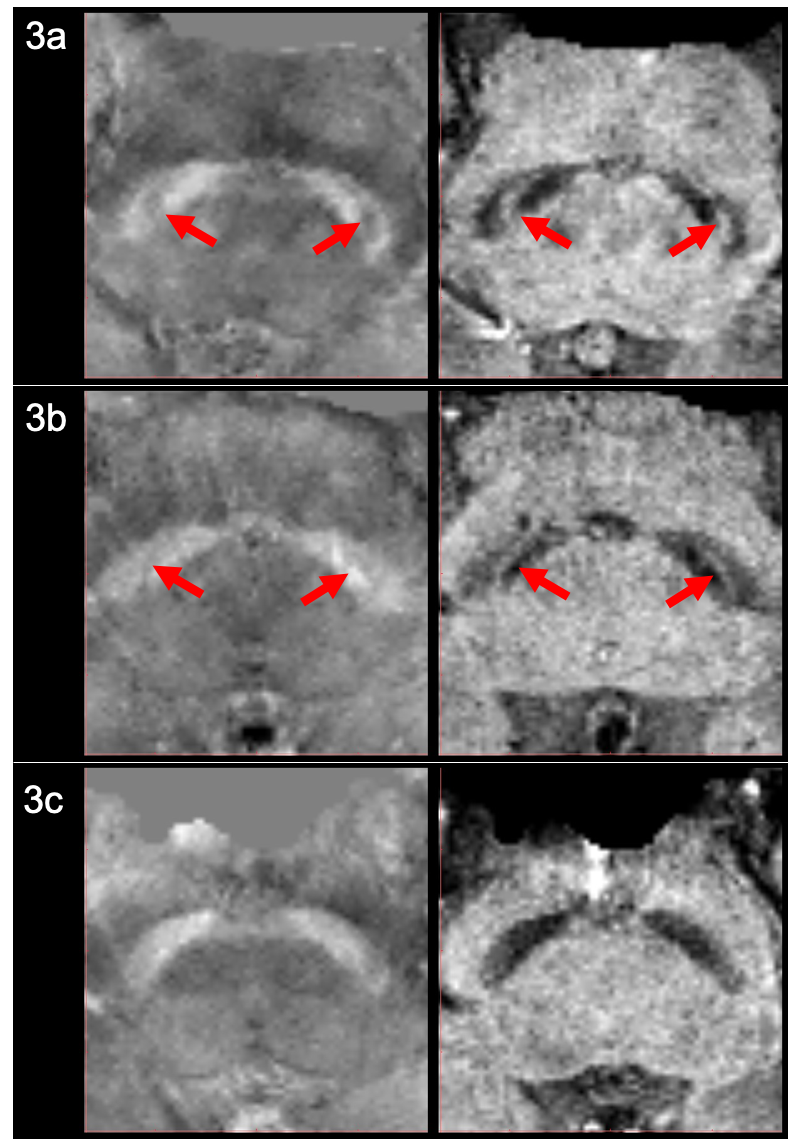
Representative QSM & SMWI images of HC, ET and TDPD Subjects. The left and right columns show the oblique axial QSM and SMWI images respectively for a representative HC (3a), ET (3b) and PD (3c) patient. The presence of the Nigrosome-1, which appears as the thin curvilinear area of hypointensity or hyperintensity within the Substantia Nigra on QSM and SMWI images respectively for HC (3a) and ET (3b) subjects, are indicated by the red arrows. There is loss of the Nigrosome-1 in the Substantia Nigra of the PD patient (3c).
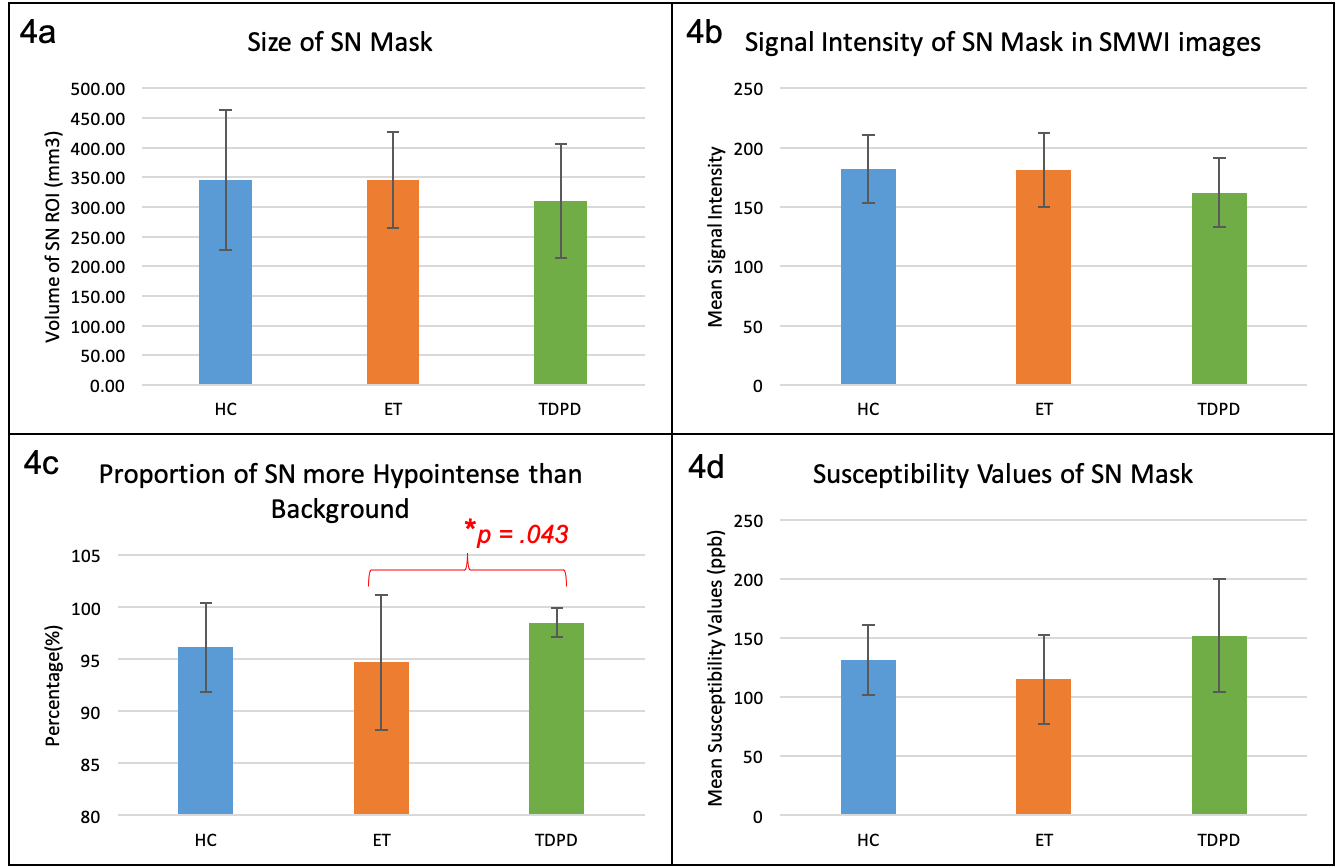
Comparison of Mean Substantia Nigra Metrics on SMWI and QSM images amongst HC, ET and TDPD Subjects. On SMWI (4a-c), the SN mask was smallest (4a) and most markedly hypointense (4b) in TDPD patients. The SN mask in TDPD patients contained the most voxels more hypointense than the background (4c), signifying highest Nigrosome-1 loss. This was significantly higher than that in ET patients. Corroborating evidence of the highest iron content (4d) in the SN of TDPD patients was noted on QSM. [SN=substantia nigra, SI=signal intensity]