1520
Brain Perfusion in Parkinson’s Disease and Multiple System Atrophy using Arterial Spin Labelling MRI1Centre for Biomedical Engineering, Indian Institute of Technology Delhi, New Delhi, India, 2Department of Neuroimaging & Interventional Radiology, National Institute of Mental Health and Neuro Sciences, Bengaluru, India, 3Indian Institute of Technology Delhi, New Delhi, India
Synopsis
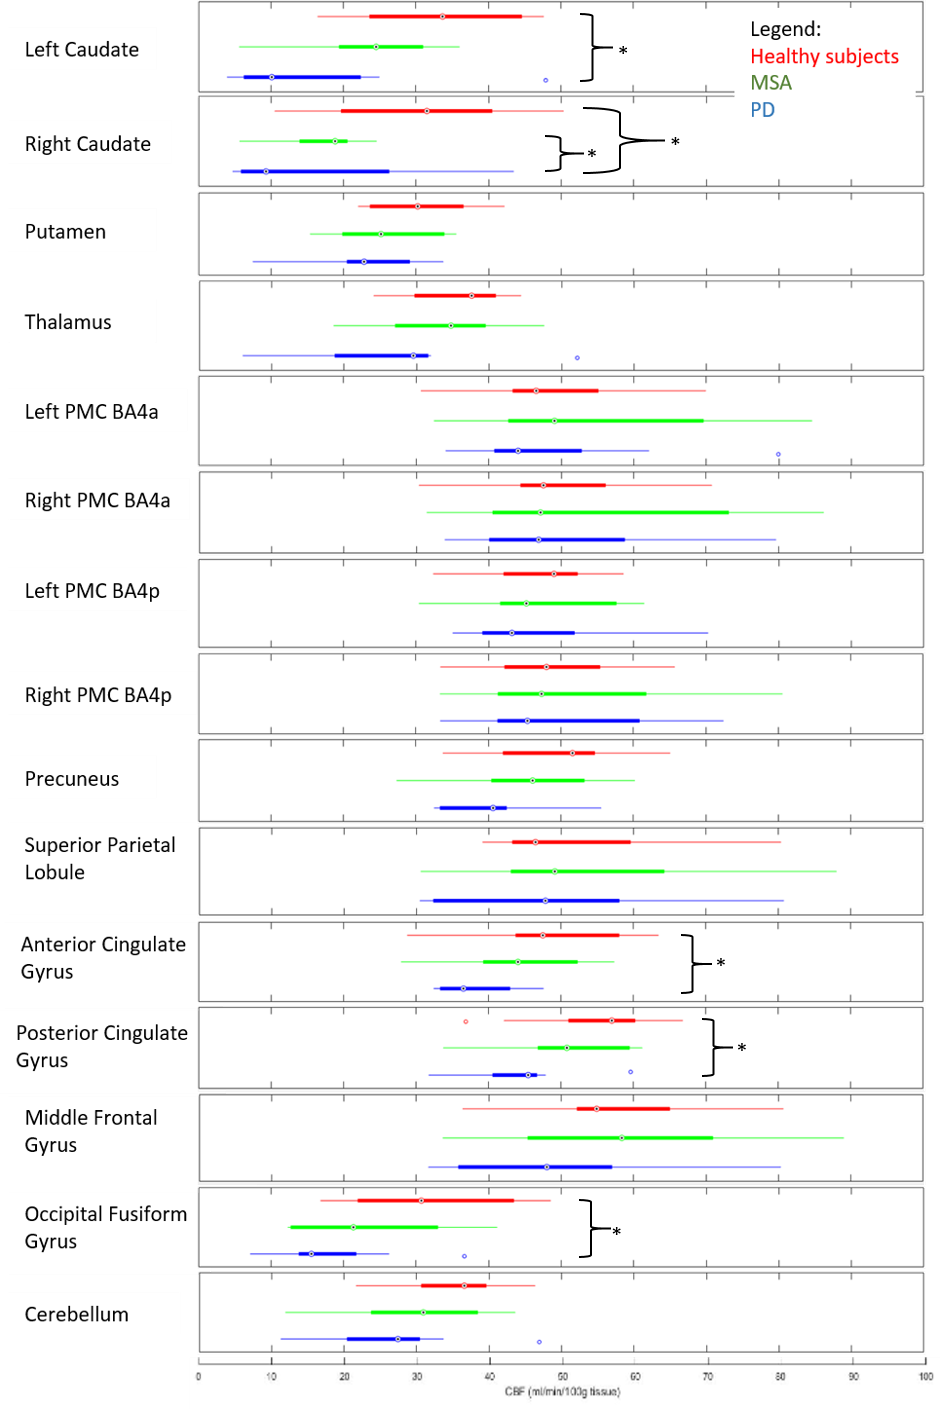
Absolute perfusion varies in different brain regions for Parkinson’s disease (PD) and Multiple System Atrophy (MSA). These were studied quantitatively using ASL-MRI and the mean perfusion for each brain region was compared. Significant decrease in perfusion was noted for PD compared to healthy subjects for left and right caudate, anterior and posterior cingulate gyrus and occipital fusiform gyrus. For MSA, right caudate showed significant decrease in perfusion compared to healthy subjects.
Purpose
Arterial Spin labelling (ASL) is a non-invasive method to quantitatively study perfusion. It gives a direct measure of perfusion through the use of magnetically labelled blood protons which act as endogenous contrast[1]. Study of perfusion helps to gain a better pathophysiological understanding of various diseases including neurodegenerative disorders[1]. Parkinson’s disease (PD) and Multiple system atrophy (MSA) are neurodegenerative disease which often have overlapping features. Study of perfusion patterns can assist in better understanding and differential diagnosis of the disorders. ASL, as a tool, has not yet been used to study MSA, to the best of our knowledge[2]. Using ASL, the perfusion (ml/min/100g tissue) in different regions of the brain in healthy subjects, and patients with MSA and PD have been measured and compared in this study.Methodology
ASL image, M0 calibration image, and T1 structural image data of 31 subjects (n=31) was acquired at NIMHANS, Bangalore, for 9 patients with multiple systems atrophy (MSA) (n=9, Age: 50.88±8.75 yrs., M:F=4:5), 10 patients with Parkinson’s disease (PD) (n=10, Age: 58.5±6.75 yrs., M:F=9:1), and 12 healthy subjects (HS) (n=12, Age: 52.33±8.80 yrs., M:F=8:4) using 3T MRI (Achieva, Philips Healthcare). Single TI ASL image was prepared using pseudo continuous ASL labelling with PLD=1.8s. 20 tag-control repeats were acquired, using the FEEPI technique with repetition time = 4400ms. The tag and control image slices in the ASL image were rearranged into the appropriate format, using MATLAB. ASL analysis and processing was performed using FSL-BASIL[3] for each patient. The absolute perfusion map was calculated and calibrated using the M0 image with the help of the BASIL toolbox[3]. The absolute perfusion map was registered to patient specific T1 structural data and standard MNI template using FSL-FLIRT[4,5]. Brain regions were selected based on previously reported literature[6,7]. Using the Harvard-Oxford Cortical and Subcortical Structural Atlas, and the Juelich Histological Atlas, thalamus, putamen, precuneus, anterior and posterior cingulate gyrus, middle frontal gyrus, occipital fusiform gyrus, superior parietal lobule, cerebellum and, left and right caudate and, GM primary motor cortex BA4a and BA4p, were segmented and the mean perfusion in areas were calculated for each subject in the three groups.Results
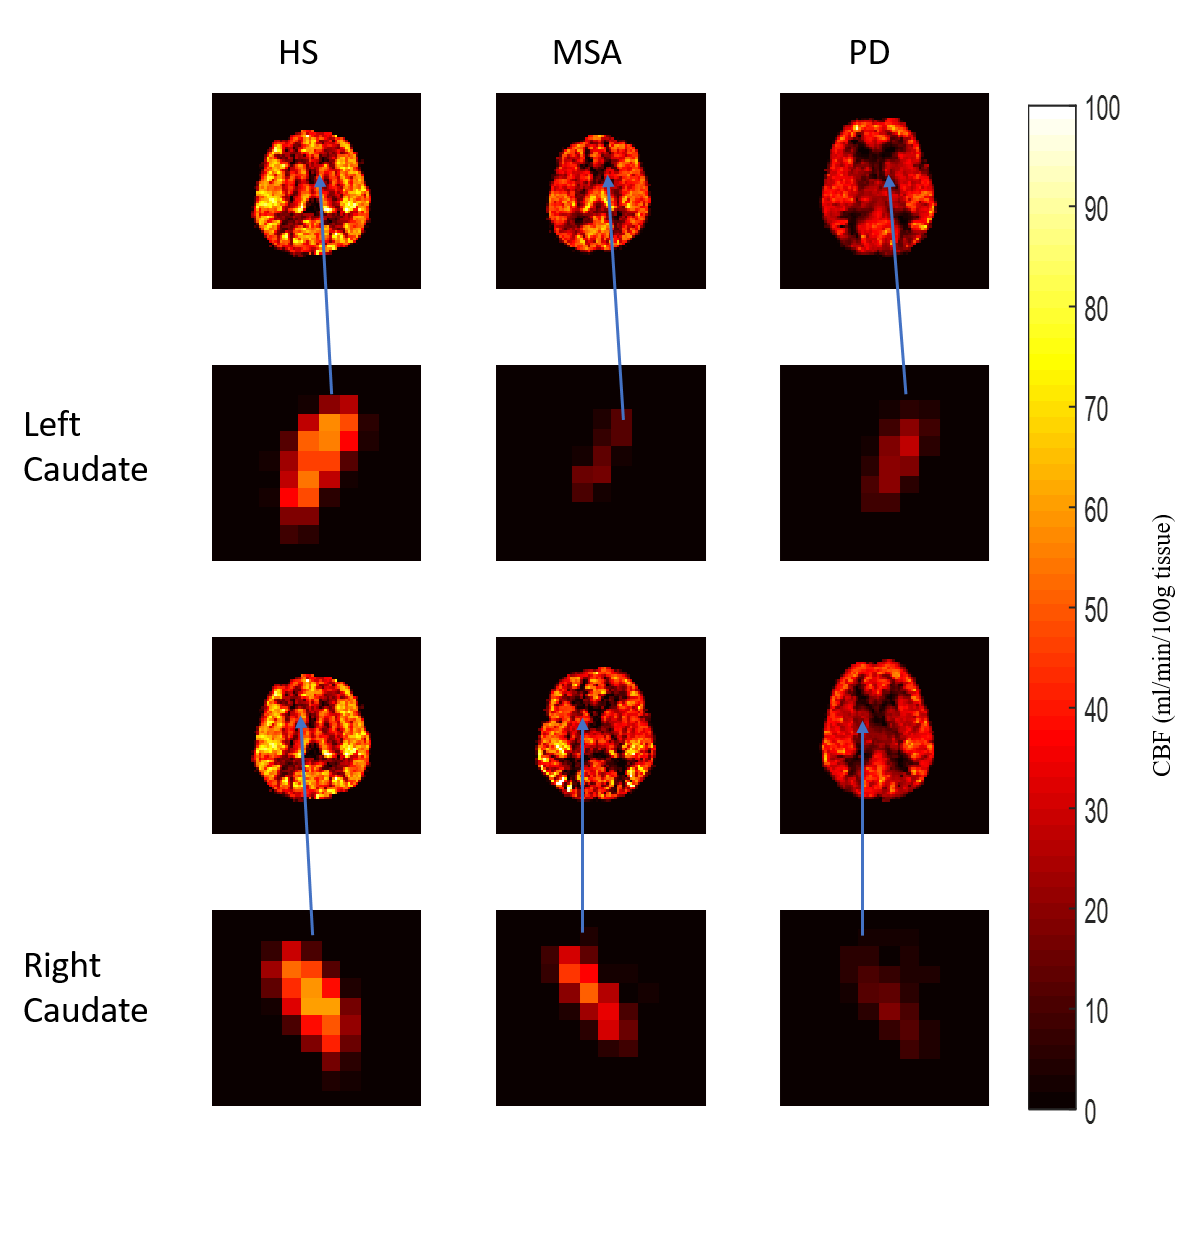
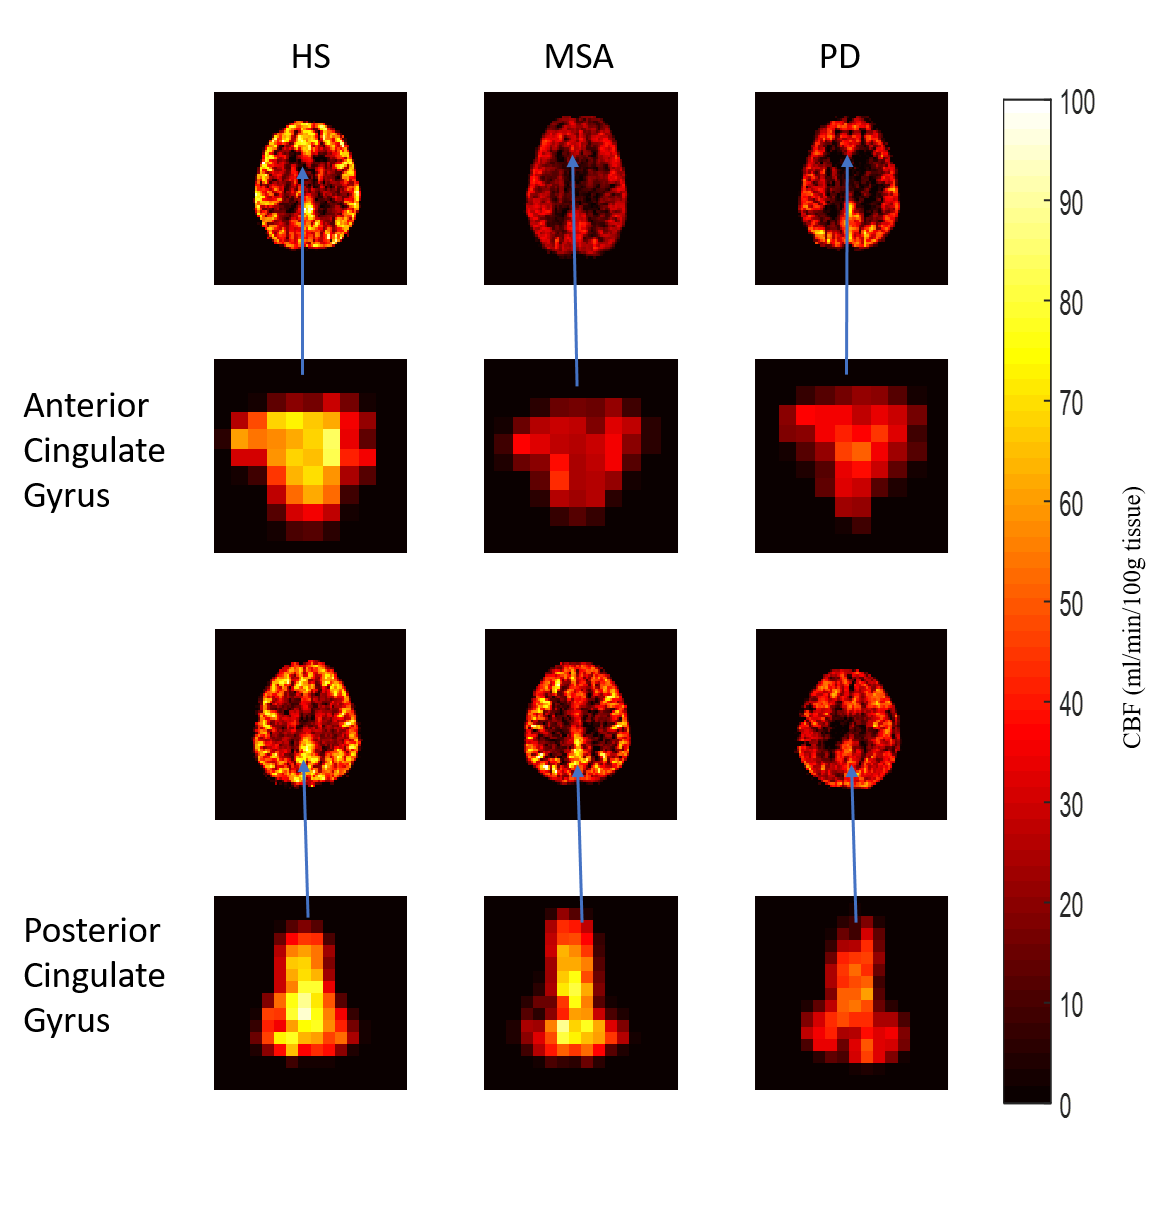
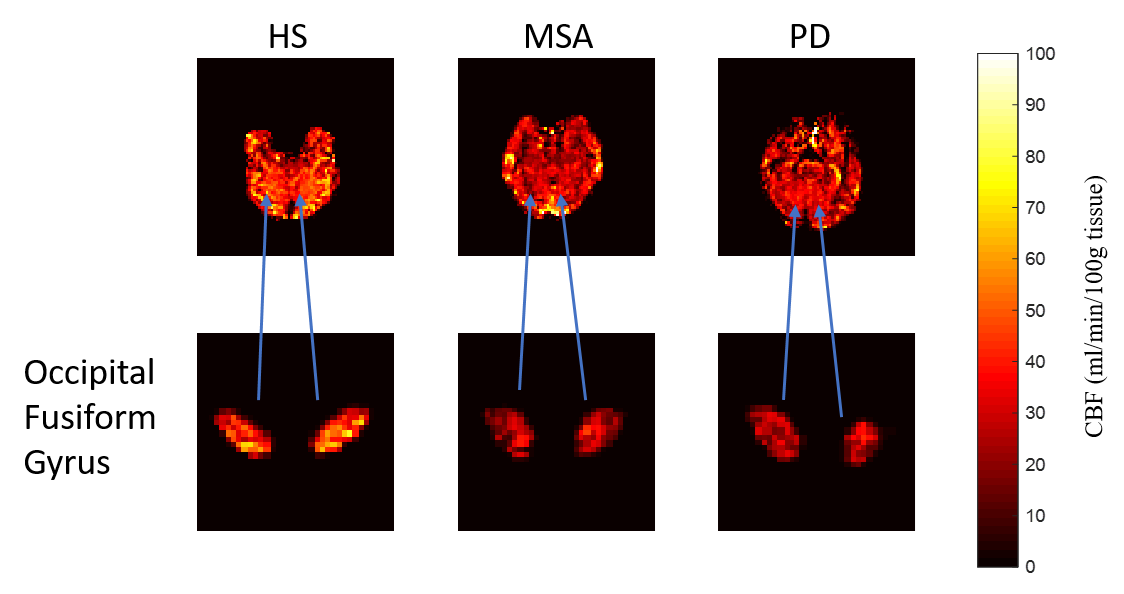
Figure 1 shows the box and whiskers plots for the perfusion values in each brain region, for the subjects in the three groups, i.e., healthy subjects, MSA and PD. Significantly lower (p<0.05) perfusion is observed in PD than healthy subjects for left caudate (PD=15.36±13.46; HS=33.62±11.01), right caudate (PD=15.88±14.19; HS=30.57±13.05), anterior cingulate gyrus (PD=38.17±5.52; HS=49.13±10.52), posterior cingulate gyrus (PD=44.28±7.54; HS=54.81±8.84) and occipital fusiform gyrus (PD=17.85±8.62; HS=32.24±11.35). Significantly lower (p<0.05) perfusion is observed in right caudate for MSA patients (17.32±5.90) than healthy subjects (30.57±13.05). Figure 2, 3 and 4 represent perfusion maps with zoomed-in ROIs for the three groups - healthy subjects, MSA and PD. ROIs with significantly lower perfusion, in left and right caudate, anterior and posterior cingulate gyrus, and the occipital fusiform gyrus are shown. Reduced perfusion is observed in MSA and PD than in healthy subjects. This observation is in accordance with the Figure 1.Discussion
Perfusion in PD was observed to have significantly decreased compared to healthy subjects in occipital fusiform gyrus, anterior and posterior cingulate gyrus, and in left and right caudate. This correlates with previous findings in literature where hypo-perfusion was noted in caudate and occipital regions as well as in the cingulate gyrus[7,8]. Perfusion in PD was seen to not have any significant differences with healthy subjects for cerebellum, middle frontal gyrus, primary motor cortex, precuneus, putamen, superior parietal lobule, and thalamus. This could be due to the stage of disease, analysis method and even the selection of ROI from atlas used. For MSA, significant decrease in perfusion was noted only in the right caudate compared to healthy subjects. There were no significant differences observed between perfusion for patients with PD and MSA. No similar studies have been reported for MSA using ASL. There could be differences in perfusion at voxel level due to voxel-wise heterogeneity which has to be further investigated, however in the brain regions there was no difference at mean perfusion levels.Conclusion
Absolute perfusion maps were measured using raw ASL data for three groups, healthy subjects, patients with MSA and PD. Significant decrease in perfusion was noted for PD compared to heathy subjects in left and right caudate, anterior and posterior cingulate gyrus and in occipital frontal gyrus. Significant decrease in perfusion was noted for MSA compared to healthy subjects in the right caudate.Acknowledgements
This study was supported by IIT Delhi, New Delhi and NIMHANS, Bengaluru.References
1. Essig M, Shiroishi MS, Nguyen TB, et al. Perfusion MRI: the five most frequently asked technical questions. American Journal of Roentgenology. 2013;200(1):24-34.
2. Chelban V, Bocchetta M, Hassanein S, et al. An update on advances in magnetic resonance imaging of multiple system atrophy. Journal of neurology. 2019;266(4):1036-45.
3. Chappell MA, Groves AR, Whitcher B, et al. Variational Bayesian inference for a non-linear forward model. IEEE Transactions on Signal Processing. 2009;57(1):223-236.
4. M. Jenkinson, S.M. Smith. A global optimisation method for robust affine registration of brain images. Medical Image Analysis. 2001;5(2):143-156.
5. M. Jenkinson, P.R. Bannister, J.M. Brady, et al. Improved optimisation for the robust and accurate linear registration and motion correction of brain images. Neuroimage. 2002;17(2):825-841.
6. Matsui H, Udaka F, Miyoshi T, et al. Brain perfusion differences between Parkinson's disease and multiple system atrophy with predominant parkinsonian features. Parkinsonism & related disorders. 2005;11(4):227-32.
7. Heron CJ, Wright SL, Melzer TR, et al. Comparing cerebral perfusion in Alzheimer's disease and Parkinson's disease dementia: an ASL-MRI study. Journal of Cerebral Blood Flow & Metabolism. 2014;34(6):964-70.
8. Fernández-Seara MA, Mengual E, Vidorreta M, et al. Cortical hypoperfusion in Parkinson's disease assessed using arterial spin labeled perfusion MRI. Neuroimage. 2012;59(3):2743-50.
Figures