1519
Investigating Functional Connectivity of Substantia Nigra pars compacta in Parkinson’s Disease1Symbiosis Center of Medical Image Analysis, Symbiosis International University, PUNE, India, 2Department of Neurology, National Institute of Mental Health and Neurosciences, Bangalore, India, 3Department of Clinical Neurosciences, National Institute of Mental Health and Neurosciences, Bangalore, India, 4Department of Neuroimaging & Interventional Radiology, National Institute of Mental Health and Neurosciences, Bangalore, India, 5Symbiosis Center of Medical Image Analysis, Symbiosis International University, Pune, India
Synopsis
Parkinson’s disease (PD) is characterized by loss of dopaminergic neurons in Substantia Nigra pars compacta (SNc). SNc to whole brain resting state functional connectivity (rsFC) was compared between healthy controls (HC) and patients with PD to study the functional network of SNc in PD, and its association with disease progression was evaluated using a neuromelanin sensitive MRI based probabilistic atlas of SNc. Putamen, cerebellum and insular cortex connectivity with SNc was significantly reduced in PD as compared to HC. Widespread frontal, occipital regions, SMA and cerebellum were associated with duration and severity of PD.
Introduction
Introduction:Parkinson’s disease (PD) is a progressive neurodegenerative disorder characterized by loss of dopaminergic neurons in substantia nigra pars compacta (SNc). Degeneration of these nigral neurons disrupts the excitatory and inhibitory pathways of the cortico-basal ganglia (CBG) network, leading to motor dysfunction in PD1. Mapping a functional network of these dopaminergic neurons can provide deeper insights into functional mechanisms of SNc and its altered connectivity in PD patients. Previous studies evaluating differences in resting state functional connectivity (rsFC) of SNc in PD have localized SNc based on T2 weighted hypo intensity on the entire SN2. However, this contrast is reflective of iron content in Substantia Nigra pars reticulata (SNr), rather than the concentration of dopaminergic neurons in SNc3. A recently developed neuromelanin sensitive MRI (NMS-MRI) sequence facilitates dopamine based SNc localization by providing a hyper intense contrast on SNc based on neuromelanin, which is a byproduct of dopaminergic neurons in SNc4. This study aims at creating a NMS-MRI based probabilistic atlas of SNc to precisely delineate it, evaluate the differences in functional connectivity of SNc between PD and HC and its association with progression and severity of PD.
Methods
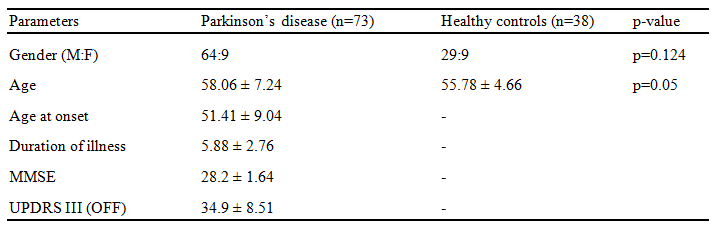
Methods: Seventy-nine patients with PD and forty-one age and gender matched healthy controls were scanned on a 3T Philips Achieva MRI scanner using a 32-channel head coil. T1-weighted images were acquired using TR/TE=8.06/3.6ms, voxel-size=1x1x1mm, FOV=256x256x160mm, slice thickness=1mm and flip angle=8, Functional images were acquired using echo planar imaging (EPI), with a TR/TE= 2000/ms, voxel size= 1.64x1.64x3 and no. of volumes=140. Subjects were instructed to keep their eyes closed and lie still during the scan. For creating probabilistic atlas of SNc, a different set of controls (n=27) were scanned on the same scanner.T1-weighted images were acquired using above mentioned protocol and Neuromelanin sensitive MRI (NMS-MRI) sequences was acquired using a fast spin echo 3D T1 acquisition with TE: 2.2ms, TR: 26ms; flip angle: 20º; reconstructed matrix size: 512 x 512; field of view: 180x180x50mm; voxel size: 0.9x0.9x1mm; number of slices: 50; slice thickness: 1mm. Method for constructing probabilistic atlas of SNc is described in Figure 1, wherein bilateral SNc ROIs were initially manually segmented on the NMS-MRI images for all subjects. The NMS-MRI images were registered to T1w images using affine transformation (t1), these T1 images were transformed (t2) to MNI space using deformable SyN registration5. The t1 and t2 transformations were concatenated and applied on the SNc ROIs to register them to MNI space. A probabilistic atlas of the MNI spaced SNc ROIs was created and thresholded at probability of 0.5. Resting state fMRI (rsfMRI) analysis was performed using CONN software6. The pre-processing steps included realignment of all functional images to mean functional image to correct head motion, co-register fMRI images to T1 images and normalise them to MNI space. Pre-processed fMRI images were linearly detrended and denoised by regressing out nuisance covariates such as WM, CSF and 12 motion parameters obtained from realignment, followed by a band pass filter of 0.01 to 0.1 Hz. Seed to voxel rsFC analysis was performed using SNc atlas as the seed and computing Fisher’s z transformed Pearson’s correlation coefficient between the mean time series of each bilateral SNc ROI and all other brain voxels. Eight subjects with excessive motion (>30% of fMRI volumes exceeding movement threshold of 0.9) were discarded from further analysis. Detailed demographics and clinical scores of dataset used for group analysis is mentioned in Figure 2. For group comparison, a one-way ANCOVA with age and gender as covariates was performed to obtain significant differences in SNc connectivity between HC and PD groups with a height threshold of uncorrected p<0.003 and FDR corrected cluster threshold of p<0.05. Association of SNc connections with UPDRS-OFF, age of onset of disease (AOO), duration of illness (DOI), LEDD and MMSE scores were evaluated by performing multiple regression using above mentioned significance threshold.Results
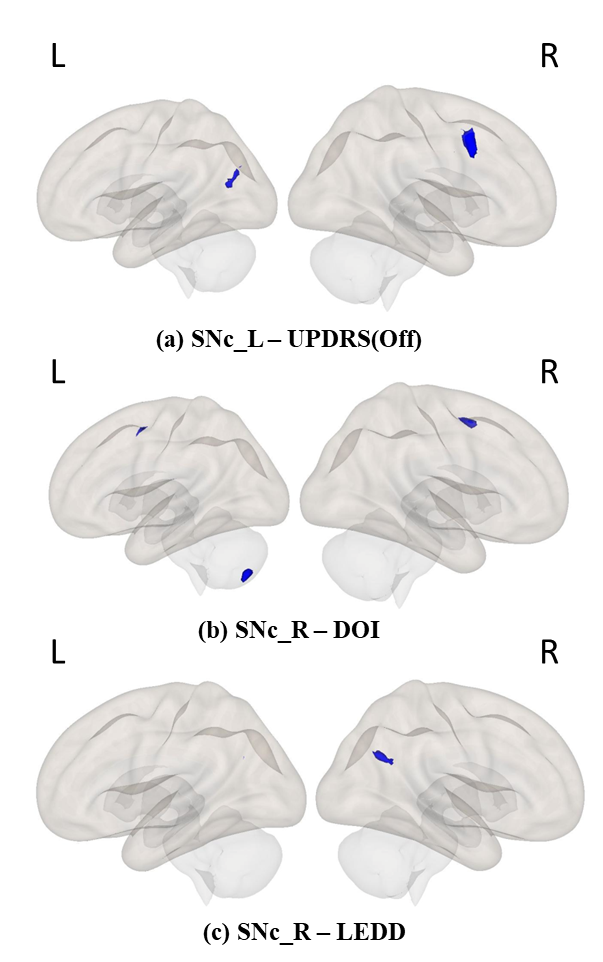
Results:The left SNc (SNc_L) showed significantly reduced connectivity with cerebellum_R, temporal pole_R, planum polare_R, heschls gyrus_R, putamen_L and insular cortex_L whereas right SNc (SNc_R) showed significantly reduced connectivity with inferior and superior lateral occipital cortex_L (iLOC_L, sLOC_L) and occipital pole_L in PD patients compared to HC as shown in Figure 3. Regression analysis results are shown in Figures 4 and 5, where SNc_L connectivity with middle and superior frontal gyrus_R, iLOC_L, sLOC_R was negatively associated with UPDRS-OFF scores. DOI scores also showed a negative relationship with SNc_R connections with bilateral supplementary motor area (SMA), cerebellum_L and paracingulate gyrus_R. A negative association was found between LEDD scores and SNc_R connectivity with bilateral Precunes and cingulate gyrus_R.Conclusion
Conclusions: Abnormal connectivity of SNc with the putamen and cerebellum is suggestive that functional mechanism of dopaminergic neurons of SNc and its synchronicity with the basal ganglia network is severely altered in PD patients. The association of SNc connectivity with severity and duration of PD further signifies the widespread functional disruption in PD due to loss of dopaminergic neurons of SNc.Acknowledgements
Department of Science and Technology –Science Education and Research Board (DST-SERB) (ECR/2016/000808) provided partial funding for setting up the computing facility.References
References:
1. Alexander, G. E., & Crutcher, M. D. (1990). Functional architecture of basal ganglia circuits: neural substrates of parallel processing. Trends in neurosciences, 13(7), 266-271.
2. Wu, T., Wang, J., Wang, C., Hallett, M., Zang, Y., Wu, X., & Chan, P. (2012). Basal ganglia circuits changes in Parkinson's disease patients. Neuroscience letters, 524(1), 55-59.
3. Langley, J., Huddleston, D. E., Merritt, M., Chen, X., McMurray, R., Silver, M., ... & Hu, X. (2016). Diffusion tensor imaging of the substantia nigra in P arkinson's disease revisited. Human brain mapping, 37(7), 2547-2556.
4. Sasaki, M., Shibata, E., Tohyama, K., Takahashi, J., Otsuka, K., Tsuchiya, K., ... & Sakai, A. (2006). Neuromelanin magnetic resonance imaging of locus ceruleus and substantia nigra in Parkinson's disease. Neuroreport, 17(11), 1215-1218.
5. Avants, B. B., Epstein, C. L., Grossman, M., & Gee, J. C. (2008). Symmetric diffeomorphic image registration with cross-correlation: evaluating automated labeling of elderly and neurodegenerative brain. Medical image analysis, 12(1), 26-41.
6. Whitfield-Gabrieli, S., & Nieto-Castanon, A. (2012). Conn: a functional connectivity toolbox for correlated and anticorrelated brain networks. Brain connectivity, 2(3), 125-141.
Figures