1517
Substantia nigra changes in Parkinson’s Disease: correlation between Neuromelanin contrast and Free Water fraction1Department of Bioengineering, ISR-Lisbon/LARSyS, Lisbon, Portugal, 2Neurological Imaging Department, Hospital de Santa Maria - CHLN, Lisbon, Portugal, 3Instituto de Medicina Molecular, Faculty of Medicine, University of Lisbon, Lisbon, Portugal, 4Champalimaud Neuroscience Programme, Champalimaud Centre for the Unknown, Lisbon, Portugal, 5CNS – Campus Neurológico Sénior, Torres Vedras, Portugal
Synopsis
Parkinson’s Disease is characterized by the degeneration of neuromelanin (NM)-containing neurons in the Substantia Nigra (SN). MRI techniques have emerged aiming to evaluate PD disease progression. NM-MRI (current gold-standard), depicts a reduction in signal intensity at the posterior SN. Recently, free water (FW) fraction maps obtained from DWI, have shown an increase of FW in the SN in PD. This work’s goal was to evaluate how the FW and NM signal relate. A negative correlation between FW and NM was observed in the SN posterior region, suggesting that both metrics can potentially be used as imaging biomarkers.
Introduction
Parkinson’s Disease (PD) is characterized by the loss of dopaminergic neurons in the substantia nigra (SN). Imaging biomarkers sensitive to this pathological change are continuously being sought. Neuromelanin(NM)-MRI has shown promising results in early PD stages depicting a reduced signal intensity at the posterior SN where degeneration is known to occur1. Recently, Diffusion-weighted Imaging (DWI) has been used to derive free water (FW) fraction maps, corresponding to a compartment with no barriers to diffusion; an increase in FW has been observed in the SN in PD and interpreted as due to neurodegeneration2 but its spatial location has not been compared to changes seen in NM-MRI. The main purpose of this work was to assess how the FW metric relates to the NM signal.Methods
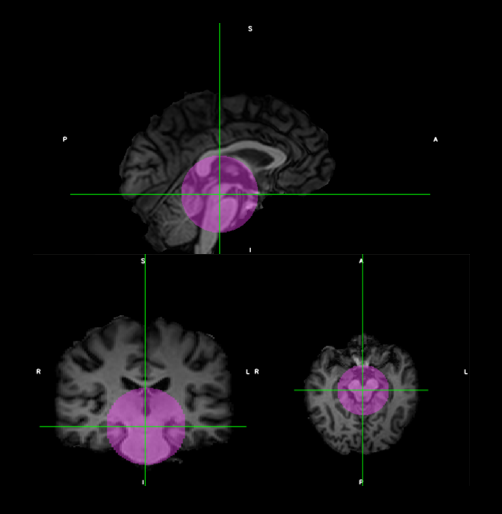
Three PD groups were studied: PD de novo (7 patients at the time of clinical diagnosis, age [mean ± standard deviation]: 62 ± 11), PD 2-5 (7 patients with disease durations ranging from 2-5 years, mean age: 68 ± 5) and PD-LS (5 patients, age: 75 ± 5, H&Y>3) and compared with an age-matched control group (6 subjects, age: 59 ± 8). DWI (b-1000 s/mm2, 32 directions, 1 b=0 s/mm2, TE/TR 55ms/16s, acquired resolution 2.0x02.0x2.0mm3), NM-MRI (multi-slice Fast Spin Echo, TE/TR 10/633ms, resolution 0.4x0.4x2.5mm3) and T1 3D Gradient Echo sequence (reconstructed resolution 0.5x0.5x2mm3) were acquired in a 3T MR scanner using an 8 channel head coil. A previously described algorithm3 was implemented4 in DIPY5 and used to estimate FW maps. The non-DWI was non linearly registered to the T1 structural image and the estimated transformation was applied to the FW maps. The NM image was registered to the T1 space, using weighting volumes centered on the midbrain, as shown in Fig.1. The SN probability maps of elderly subjects (age: 70 ± 5) from the ATAG6 atlas presented in7, were used to extract SN masks in the MNI-space (MNI152 1mm). An in-house python script was developed to separate these masks into anterior and posterior regions. Additionally, regions of interest (ROI) were drawn on the MNI-space in the crus cerebri (CC) for both hemispheres. Then, using the inverse of the non-linear transformation estimated from the T1 structural to the standard MNI-space, the SN and CC masks were transformed onto the T1 space. All image registrations were performed using the FSL software8. The CC ROIs were used as reference for calculating the relative contrast ratio (CR) of the NM signal in both SN regions. The mean FW and NM CR were computed for each ROI and the Kruskal-Wallis test (significance level of 0.05) was used to detect differences between groups. In order to assess the relation between FW maps and the NM signal, scatterplots were computed for both SN regions. All statistical analyses were performed with the R software.Results & Discussion
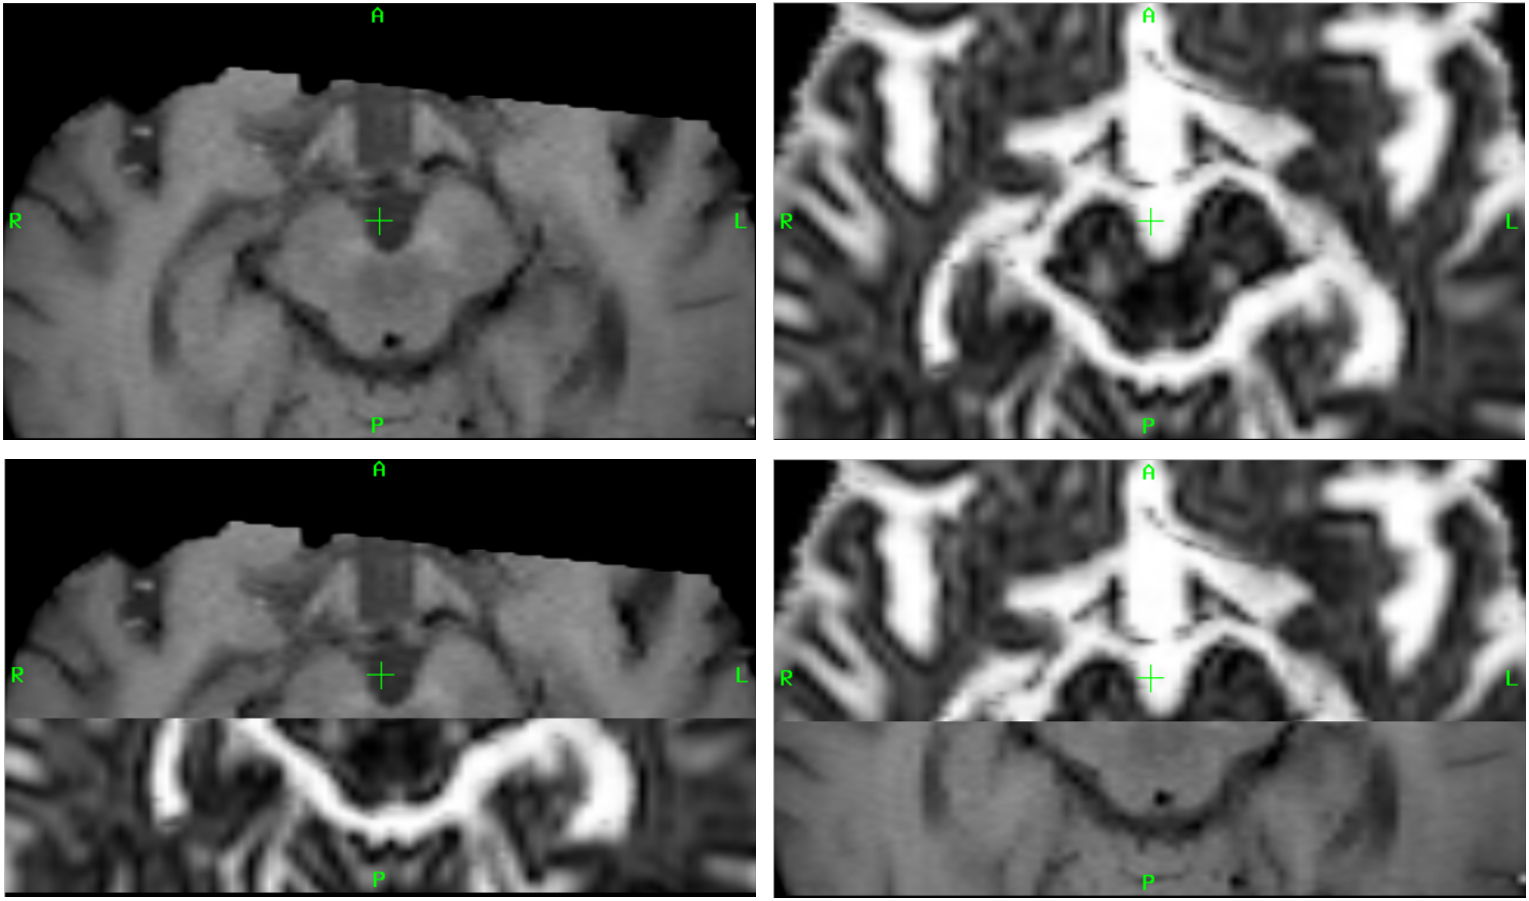
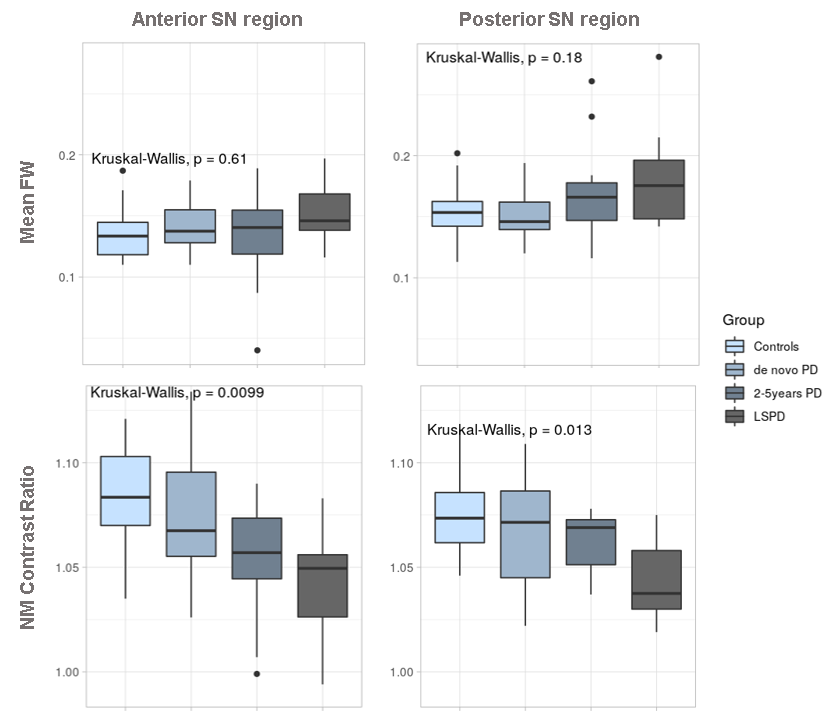
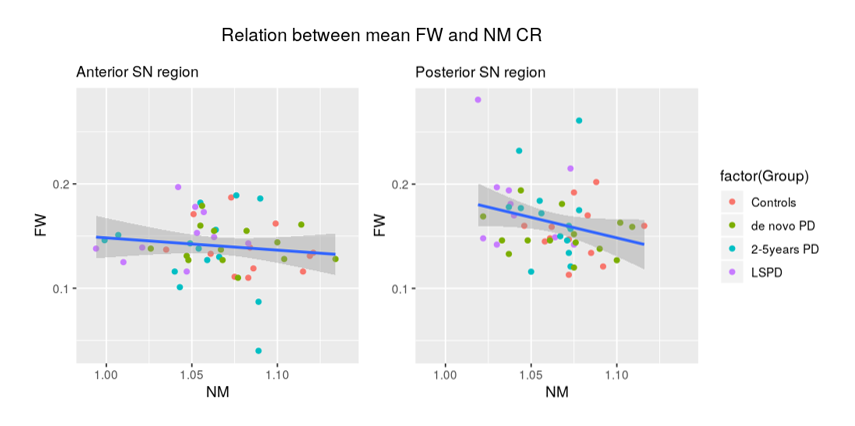
Representative NM-MR and FW images of a PD subject are shown in Fig.2, depicting a higher signal intensity in the anterior area of the SN for the NM-MRI and a higher FW value in the posterior portion of the SN region. The boxplots presented in Fig.3 reveal a tendency for the FW to increase and the NM signal to decrease as the disease worsens, for both regions of the SN. However, statistically significant differences between groups were only found for the anterior (p-value=0.010) and posterior (p-value=0.013) NM CR. It is also interesting to note that the median FW in the posterior part of the SN is higher for every group compared to the anterior SN. The median NM CRs in the anterior and posterior SN are very similar for each group, but these small CR differences between SN regions most likely arise from the fact that a 3D SN mask was used in this work, whereas NM signal is typically thought to be visible on only a few slices in the 2D NM-MRI image - which is why 2D ROIs are typically used9 to measure NM CR. The relation between the FW and NM signal is shown in Fig.4. Even though there is no clear separation between groups, the computed linear regression shows a negative correlation between FW and NM, more marked in the posterior region of the SN.Conclusion
These findings suggest that both the NM CR and the FW metric can potentially be used as imaging biomarkers as this result is consistent with the degeneration of neurons in the posterior region of the SN. Further studies are required with larger cohorts to confirm this relation. The use of multi-shell DWI acquisitions for FW mapping in PD should also be tested, since FW estimation is known to be an ill-posed problem when using single-shell data, requiring careful regularization3.Acknowledgements
We acknowledge the Portuguese Foundation for Science and Technology (FCT - IF/00364/2013, UID/EEA/50009/2019).References
1. Sasaki, M., Shibata, E., Tohyama, K., Takahashi, J., Otsuka, K., Tsuchiya, K., Takahashi, S., Ehara, S., Terayama, Y. and Sakai, A., 2006. Neuromelanin magnetic resonance imaging of locus ceruleus and substantia nigra in Parkinson's disease. Neuroreport, 17(11), pp.1215-1218.
2. Ofori, E., Pasternak, O., Planetta, P.J., Burciu, R., Snyder, A., Febo, M., Golde, T.E., Okun, M.S. and Vaillancourt, D.E., 2015. Increased free water in the substantia nigra of Parkinson's disease: a single-site and multi-site study. Neurobiology of aging, 36(2), pp.1097-1104.
3. Pasternak, O., Sochen, N., Gur, Y., Intrator, N. and Assaf, Y., 2009. Free water elimination and mapping from diffusion MRI. Magnetic Resonance in Medicine: An Official Journal of the International Society for Magnetic Resonance in Medicine, 62(3), pp.717-730.
4. Golub, M. et al., 2019. Open source algorithm for single shell free water DTI: potentials and limitations. (poster W789) OHBM Annual Meeting, Rome.
5. Garyfallidis, E., Brett, M., Amirbekian, B., Rokem, A., Van Der Walt, S., Descoteaux, M. and Nimmo-Smith, I., 2014. Dipy, a library for the analysis of diffusion MRI data. Frontiers in neuroinformatics, 8, p.8.
6. NeuroImaging Tools and Resources Collaboratory. Atlasing of the basal ganglia. https://www.nitrc.org/projects/atag. Accessed Nov 5, 2019.
7. Keuken, M.C., Bazin, P.L., Backhouse, K., Beekhuizen, S., Himmer, L., Kandola, A., Lafeber, J.J., Prochazkova, L., Trutti, A., Schäfer, A. and Turner, R., 2017. Effects of aging on T1, T2∗, and QSM MRI values in the subcortex. Brain Structure and Function, 222(6), pp.2487-2505.
8. Jenkinson, M., Beckmann, C.F., Behrens, T.E., Woolrich, M.W. and Smith, S.M., 2012. FSL. Neuroimage, 62(2), pp.782-790.
9. Fabbri, M., Reimão, S., Carvalho, M., Nunes, R.G., Abreu, D., Guedes, L.C., Bouça, R., Lobo, P.P., Godinho, C., Coelho, M. and Gonçalves, N.C., 2017. Substantia nigra neuromelanin as an imaging biomarker of disease progression in Parkinson’s disease. Journal of Parkinson's disease, 7(3), pp.491-501.
Figures