1516
Investigating Iron deposition in the Substantia Nigra of Early Parkinson’s Disease and Idiopathic REM Sleep Behavior Disorder using QSM and R2*1CENIR - Center for Neuroimaging Research, ICM - Brain and Spine Institute, Paris, France, 2Move'IT - Movement Investigations and Therapeutics, ICM - Brain and Spine Institute, Paris, France, 3Clinical Investigation Center (CIC-9503), INSERM - French National Institute of Medical Research and Health, Paris, France, 4Department of Neurology, Pitie-Salpetriere Hospital, Paris, France, 5Biogen Inc., Cambridge, MA, United States, 6Sleep Disorders Unit, Pitie-Salpetriere Hospital, Paris, France
Synopsis
Parkinson’s disease (PD) and idiopathic rapid eye movement sleep behavior disorder (iRBD) demonstrate neurodegenerative changes in the substantia nigra (SN) associated with an increase in iron deposition in PD patients. We aimed to quantify iron overload in the SN in early stage PD and iRBD patients using QSM-based and neuromelanin (NM)-based automated segmentation for QSM and R2* maps. We observed an increase in iron deposition in both early PD and iRBD patients with respect to healthy volunteers (HV).
Introduction
Parkinson’s disease (PD) demonstrates a progressive loss of dopaminergic neurons in the substantia nigra (SN) pars compacta (SNc) associated with the increase in iron deposition. Dopaminergic neurons contain neuromelanin (NM) pigment that can be imaged using MRI. However, iron deposition in the entire SN, including SNc and SN pars reticulata (SNr) can be evaluated using quantitative susceptibility mapping (QSM) or the apparent transverse relaxation rate (R2*)1,2. Various studies have substantiated that iron-sensitive MRI techniques such as QSM and R2* are capable of quantifying SN iron content in PD patients, with raised levels often observed when compared with the healthy volunteers (HV)1,2. Previous studies have shown that QSM correlated well with the iron load in iron-rich regions and also that it could better differentiate PD patients and HV compared to R2* mapping1. Idiopathic rapid eye movement sleep behavior disorder (iRBD) is considered to be a prodromal stage of Parkinsonism. Nonetheless, a previous study did not report any difference in the SN between the iRBD and HV groups using R2*3. Here, we used an automated segmentation method using a QSM and NM template-based approach in order to examine the changes in iron load in early stage PD and iRBD patients using QSM and R2*.METHODS
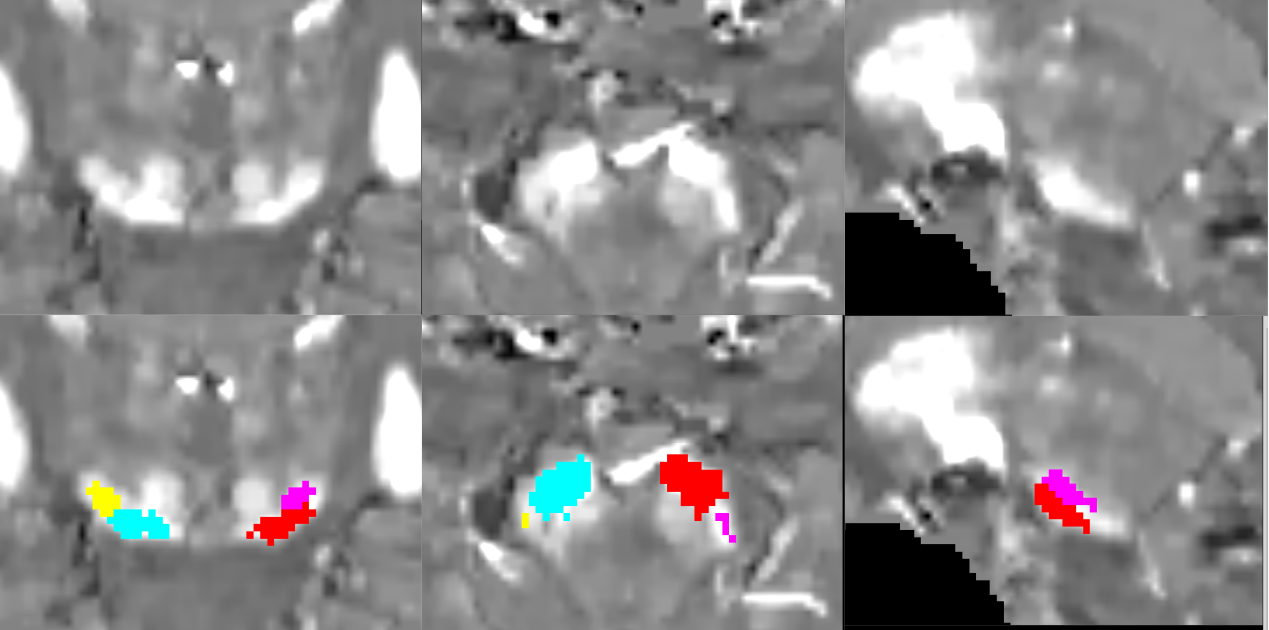
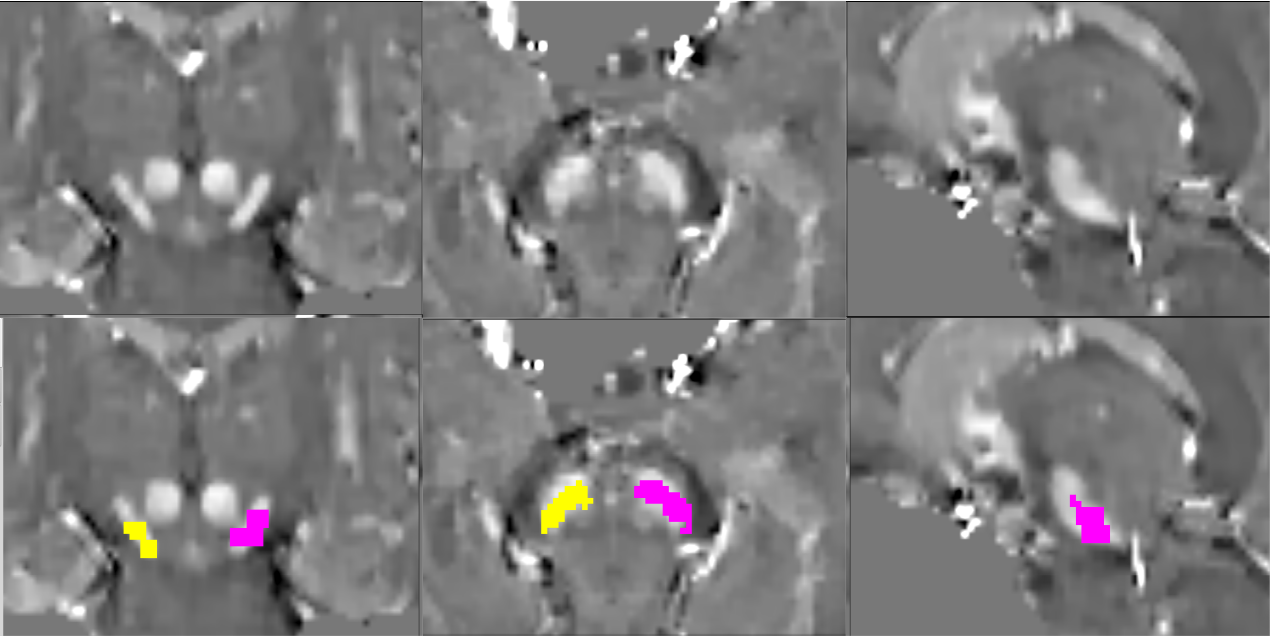
We prospectively studied a baseline pool of early PD and iRBD patients along with their age-matched HV. All subjects were scanned using a 3T whole body PRISMA scanner (Siemens, Germany) using a 64-channel head coil for signal reception. NM-sensitive images were acquired using a T1-weighted 2D axial TSE protocol with TR/TE= 890 ms/13 ms, 3 averages, and voxel size: 0.4x0.4x3 mm3. QSM and R2* were obtained using 3D multi gradient echo (GRE) protocol with 12 echoes, acquired voxel size: 1*1*2 mm3; reconstructed voxel size 1-mm isotropic, Flip Angle: 15°, TR = 40 ms, 12 equally-spaced TEs ranging from 4 to 37 ms. R2* maps were computed using a nonlinear fit over TEs. QSM images were calculated using the MEDI toolbox6,7. The reconstructed QSM images were then used to construct a QSM template with Advanced Normalization Tools (ANTs)8. SN ROI were manually delineated as the hyperintense area dorsal to the cerebral peduncle and ventral to the red nucleus on the template by an independent examiner and cross-validated by two other examiners. Thereafter, QSM-based SN ROI was obtained on each subject by using ANTs and subsequently applying mathematical morphology opening operation on the ROI (Figure 1). Quantitative mean susceptibility values in ppm and R2* values for each subject ROI were computed. Also, in each subject’s NM-sensitive image, the SNc were manually delineated by two independent examiners similar to a previous study9 and aligned to the corresponding GRE image using NiftyReg10,11 to obtain NM-based SN ROI (Figure 2). A one-way general linear model – Multivariate analysis of variance (ANOVA) was conducted with Status of subject (PD, iRBD and HV) as a factor along with Age and Gender as covariables to test whether there was a significant difference in susceptibility or R2* value measurements between groups and thus, diagnostic values were calculated using receiver operating characteristic (ROC) analysis.RESULTS
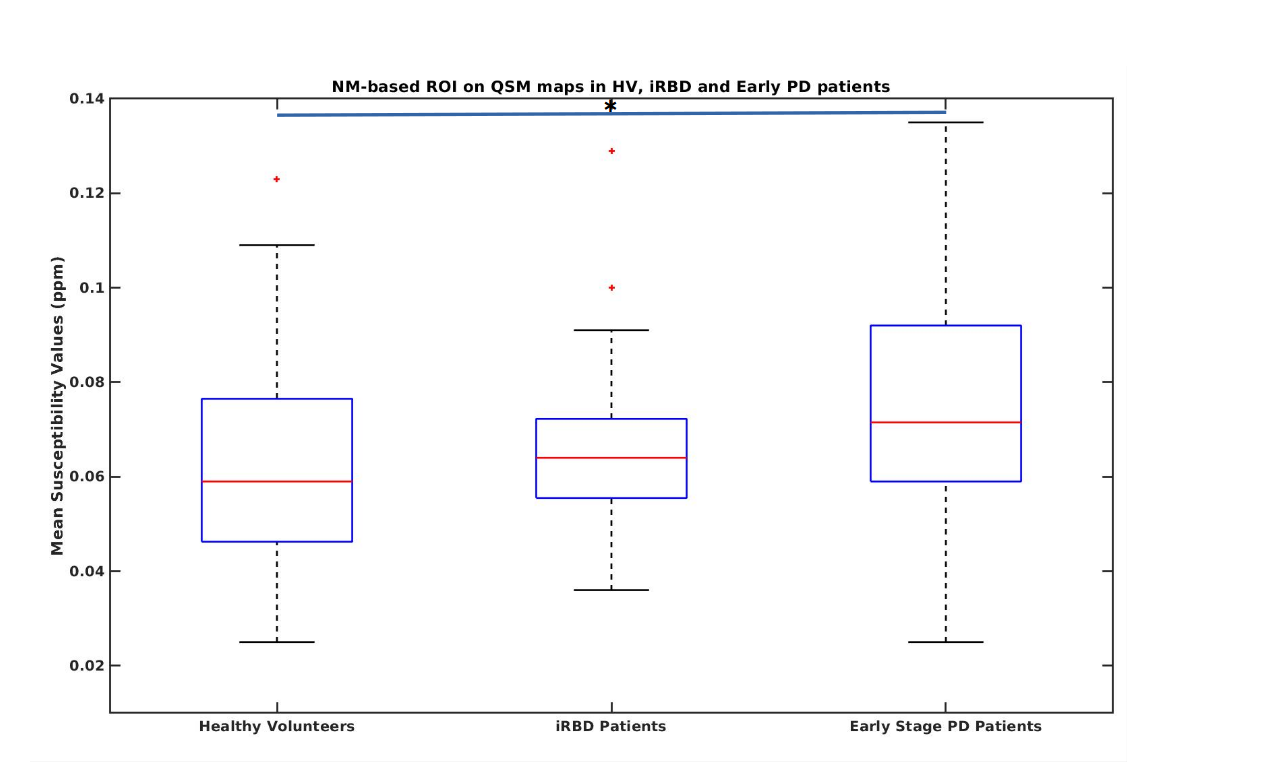
Clinical characteristics. 100 early PD (mean age = 61.4±9.0 years, mean disease duration = 1.5±1.0 years, mean MDS-UPDRS-III-OFF score= 30.4±8.0), 34 iRBD patients (mean age = 67.5±4.8 years, MDS-UPDRS-III-OFF score=11.1±5.6) were compared to their 48 age-matched HV (mean age = 61.9±9.7 years, MDS-UPDRS-III-OFF score =5.8±5.8).Quantitative measurements. For QSM-based ROI on QSM maps, there was no significant difference for Status factor between groups where early PD patients demonstrated a 6.3% increase in susceptibility values (0.138±0.037 ppm) compared to HV (0.129±0.036 ppm) while IRBD patients demonstrated a 5.3% increase (0.137±0.043 ppm) compared to the HV. For NM based ROI on QSM maps, there was a highly significant effect for Status factor (ANOVA, p =0.002) where early PD patients demonstrated a significant 20.0% increase in susceptibility values (0.076±0.023 ppm) compared to HV (0.061±0.025 ppm, t-test p=0.002) whereas IRBD patients demonstrated a non-significant 12.7% increase (0.070±0.032) compared to the HV.
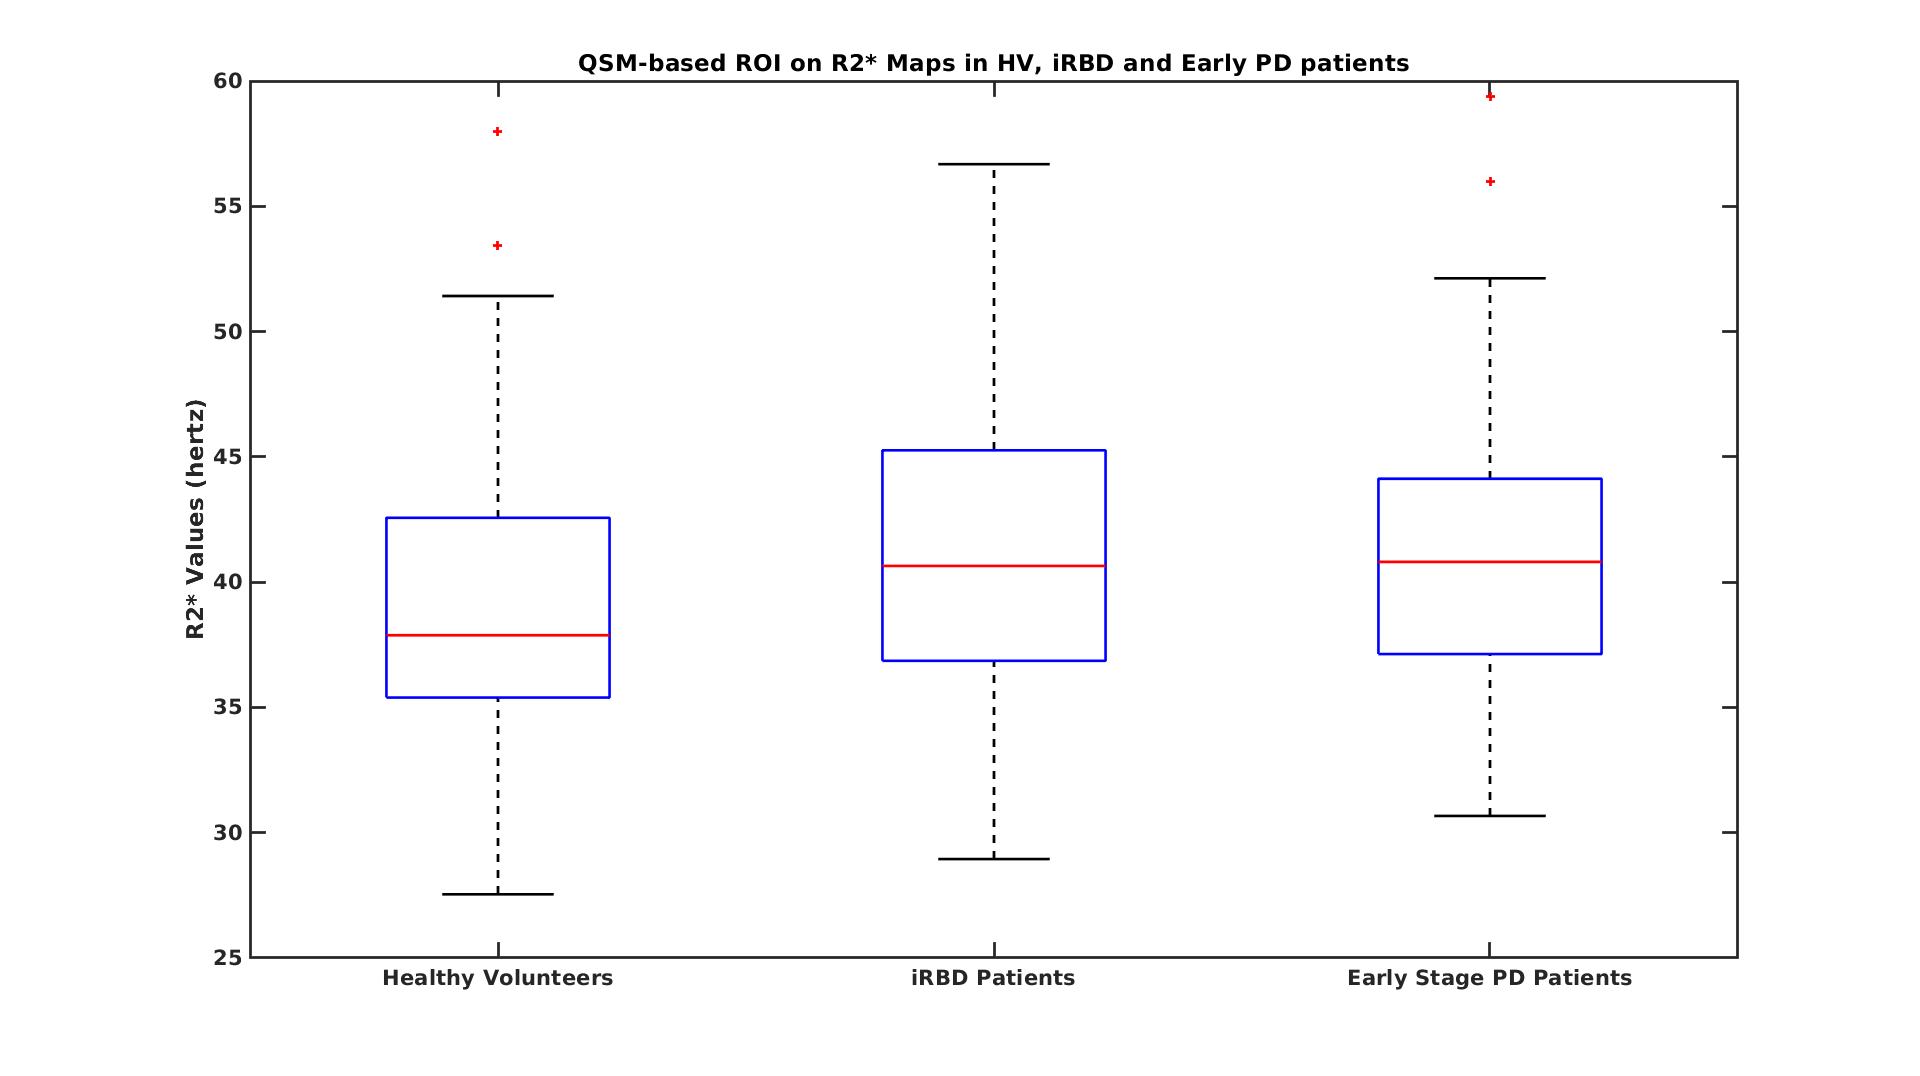
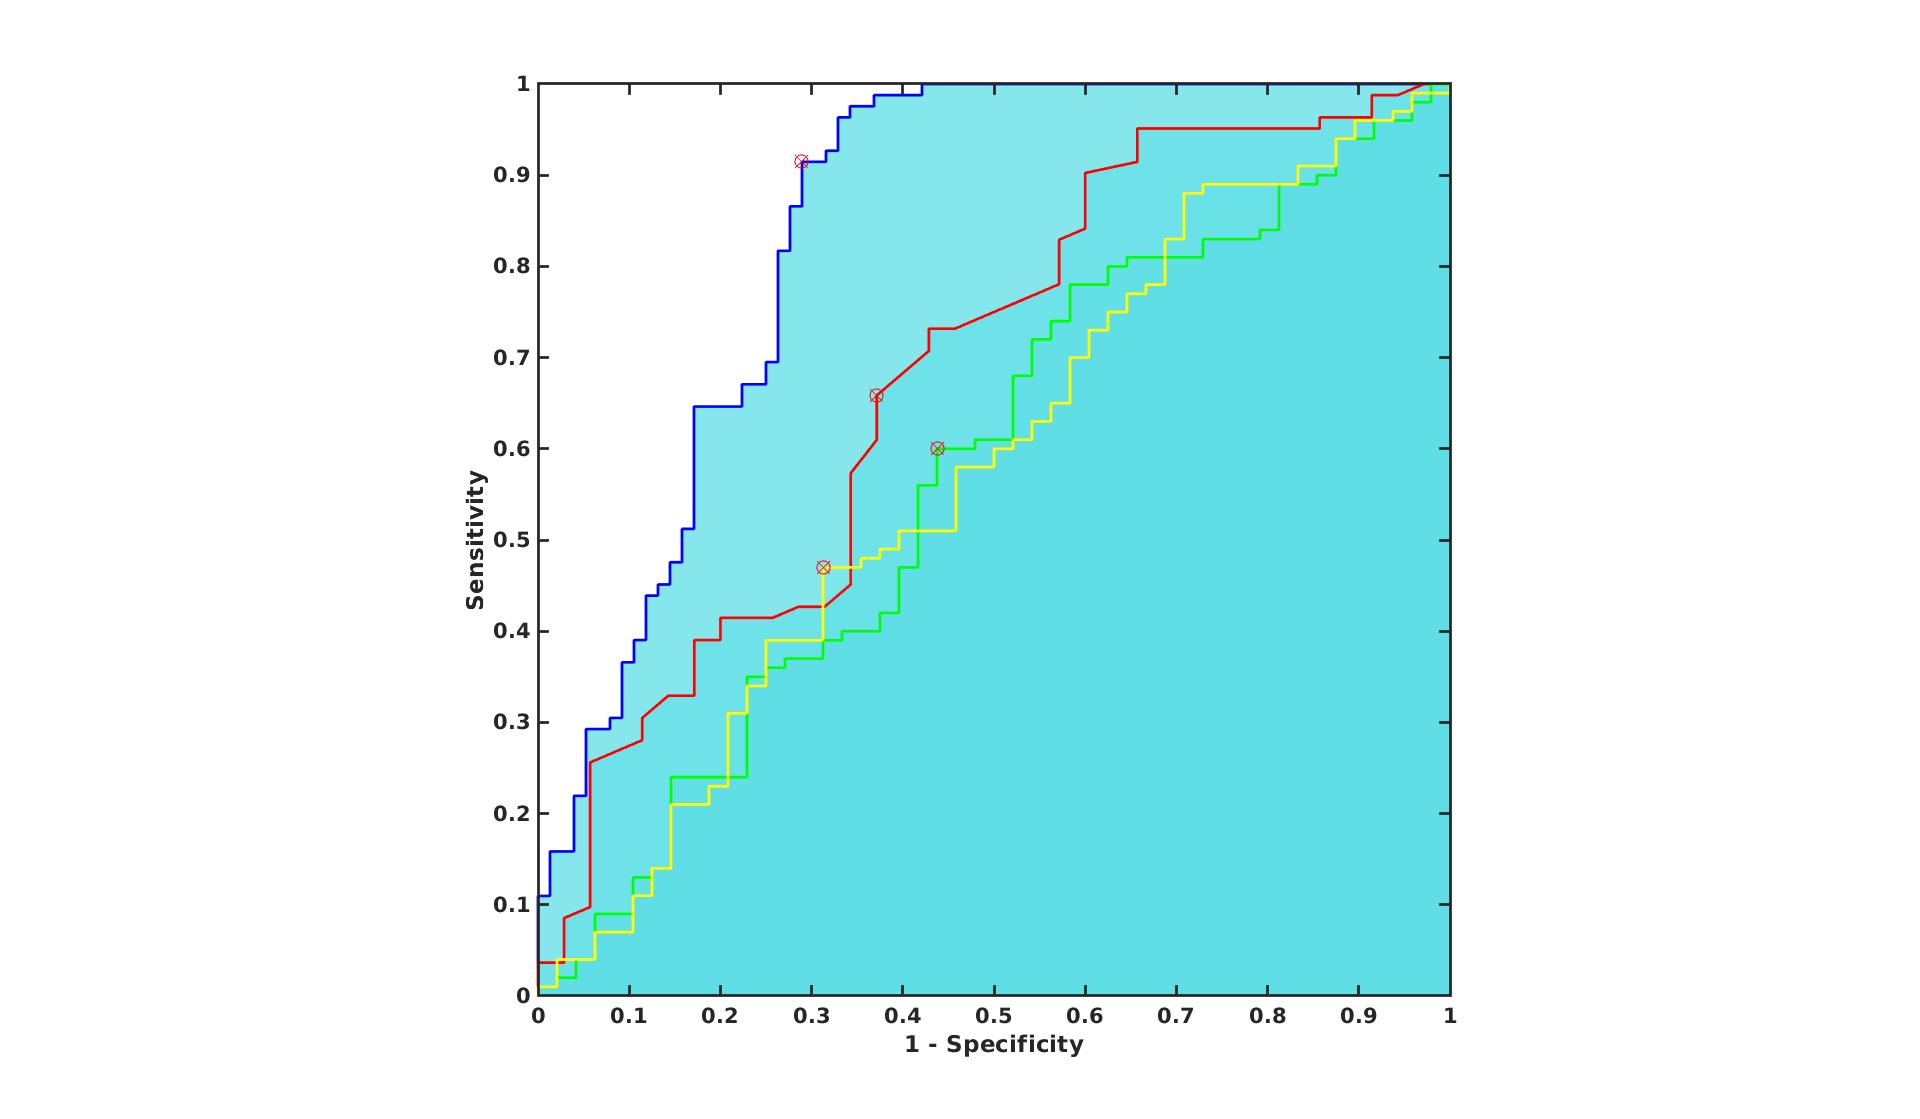
For QSM-based ROI on R2* maps, there was no significant difference either for Status factor where early PD patients demonstrated a non-significant 3.0% increase in R2* values (0.041±0.006) compared to HV (0.040±0.007) whereas IRBD patients demonstrated a non-significant 3.8% increase (0.041±0.007) compared to the HV (Figure 3). For NM based ROI on R2* maps, there was a highly significant effect for Status factor (ANOVA p =0.003) where early PD patients demonstrated a highly significant 7.8% increase in R2* values (0.031±0.004) compared to HV (0.029±0.004, t-test p=0.001) while IRBD patients demonstrated a non-significant 4.8% increase (0.030±0.005) compared to the HV (Figure 4). ROC analysis provided an area under the curve of 0.6 for QSM-based ROI and 0.8 for NM-based ROI on R2* maps (Figure 3).
CONCLUSION
A progressive increase in iron load was observed in iRBD and early PD patients compared to the HV for both QSM and R2*. Hence, quantifying the SN alterations with our template-based approach could be useful for the diagnosis of PD.Acknowledgements
This study was funded by grants from ANR Nucleipark, DHOS-Inserm, France Parkinson, École des NeuroSciences de Paris (ENP), Fondation pour la Recherche Médicale (FRM), and the Investissements d'Avenir, IAIHU-06 (Paris Institute of Neurosciences – IHU), ANR-11-INBS-0006, Fondation d’Entreprise EDF, Biogen Inc., Fondation Thérèse and René Planiol, Unrestricted support for Research on Parkinson’s disease from Energipole (M. Mallart) and Société Française de Médecine Esthétique (M. Legrand). The authors would like to thank all the subjects who participated in this study.References
1. Barbosa, J. H. O., Santos, A. C., Tumas, V., Liu, M., Zheng, W., Haacke, E. M., & Salmon, C. E. G. (2015).Quantifying brain iron deposition in patients with Parkinson's disease using quantitative susceptibility mapping, R2 and R2. Magnetic resonance imaging, 33(5), 559-565.
2. Langkammer, C., Pirpamer, L., Seiler, S., Deistung, A., Schweser, F., Franthal, S., ... & Stoegerer, E. M. (2016). Quantitative susceptibility mapping in Parkinson's disease. PLoS One, 11(9), e0162460.
3. Lee, J. H., Han, Y. H., Cho, J. W., Lee, J. S., Lee, S. J., Kim, D. J., ... & Mun, C. W. (2014). Evaluation of brain iron content in idiopathic REM sleep behavior disorder using quantitative magnetic resonance imaging. Parkinsonism & related disorders, 20(7), 776-778.
4. Du, G., Liu, T., Lewis, M. M., Kong, L., Wang, Y., Connor, J., ... & Huang, X. (2016). Quantitative susceptibility mapping of the midbrain in Parkinson's disease. Movement Disorders, 31(3), 317-324.
5. Lotfipour, A. K., Wharton, S., Schwarz, S. T., Gontu, V., Schäfer, A., Peters, A. M., ... & Bajaj, N. P. (2012). High resolution magnetic susceptibility mapping of the substantia nigra in Parkinson's disease. Journal of Magnetic Resonance Imaging, 35(1), 48-55.
6. Zhou, D., Liu, T., Spincemaille, P., & Wang, Y. (2014). Background field removal by solving the Laplacian boundary value problem. NMR in Biomedicine, 27(3), 312-319.
7. Liu, J., Liu, T., de Rochefort, L., Ledoux, J., Khalidov, I., Chen, W., ... & Wang, Y. (2012). Morphology enabled dipole inversion for quantitative susceptibility mapping using structural consistency between the magnitude image and the susceptibility map. Neuroimage, 59(3), 2560-2568.
8. Avants, B. B., Tustison, N., & Song, G. (2009). Advanced normalization tools (ANTS). Insight j, 2, 1-35.
9. Pyatigorskaya, N., Gaurav, R., Arnaldi, D., Leu-Semenescu, S., Yahia-Cherif, L., Valabregue, R., ... & Lehéricy, S. (2017). Magnetic resonance imaging biomarkers to assess substantia nigra damage in idiopathic rapid eye movement sleep behavior disorder. Sleep, 40(11), zsx149.
10. Ourselin, S., Roche, A., Subsol, G., Pennec, X., & Ayache, N. (2001). Reconstructing a 3D structure from serial histological sections. Image and vision computing, 19(1-2), 25-31.
11. Modat, M., Ridgway, G. R., Taylor, Z. A., Lehmann, M., Barnes, J., Hawkes, D. J., ... & Ourselin, S. (2010). Fast free-form deformation using graphics processing units. Computer methods and programs in biomedicine, 98(3), 278-284.
Figures