1515
Beyond Single Tensor Diffusion Metrics to Quantify White Matter Disorganization in Parkinson’s disease With Freezing of Gait1Cleveland Clinic Lou Ruvo Center for Brain Health, Las Vegas, NV, United States, 2University of Colorado, Boulder, Boulder, CO, United States, 3Department of Brain Health, University of Nevada, Las Vegas, Las Vegas, NV, United States, 4University of California, San Diego, San Diego, CA, United States, 5Stanford University, Stanford, CA, United States
Synopsis
Freezing-of-gait (FoG) which is one of the main causes of falls in Parkinson’s disease (PD), results in significant morbidity and mortality. Currently, there are no robust methods of elucidating the neural mechanisms underlying this disabling aspect of PD. Utilizing a well-characterized cohort of PD-patients with-FoG (PD-FoG), PD-patients without-FoG (PD-nFoG), and healthy controls, we showed that diffusion kurtosis imaging and free-water corrected single-tensor diffusion MRI (dMRI)-derived measures identified significant differences in dMRI-derived measures between PD-FoG and PD-nFoG. Our study indicate that these beyond single-tensor dMRI models may identify robust and generalizable dMRI-derived measures to elucidate the neural mechanisms underlying PD-FoG.
Introduction
Freezing-of-gait (FoG) is a debilitating condition in participants with Parkinson’s disease (PD) affecting almost 81% of PD participants1, and has been suggested as one of the main causes of falls in PD2,3 resulting in subsequent morbidity and mortality. PD-FoG is theorized to be due to deterioration of underlying locomotor networks combined with a global dysfunction during concurrent processing of neuronal information4. Despite several MRI studies comparing PD-FoG and PD-non-FoG (PD-nFoG) involving volumetric5,6, diffusion (dMRI)7,8, and functional MRI (fMRI)9–14, no robust method yet exists that identifies neuroanatomical pathways of PD-FoG which could be targeted for effective therapeutics. Therefore, concurrent fMRI and dMRI have been proposed15,16 to better elucidate the neural mechanisms underlying PD-FoG. However with technological advancements of acquiring sophisticated dMRI data in clinically feasible time, it is currently unknown which dMRI model provides the most sensitive and specific measure that: (a) can differentiate between PD-FoG and PD-nFoG, (b) correlated with clinical symptoms within these groups, and (c) may be further combined with fMRI measures to provide predictive imaging markers for PD-FoG. Hence, in this study of a well-characterized cohort of seventeen PD-FoG, twenty-one PD-nFoG, and seventeen healthy controls (HC), we acquired multi-shell dMRI data, and estimated conventional single-tensor (ST) measures (fractional anisotropy (FA), radial diffusivity (RD), axial diffusivity (AxD), mean diffusivity (MD)), free-water corrected ST (FW-ST) measures (FW-FA, FW-MD, FW-AxD, FW-RD), FW measures, diffusion kurtosis imaging17 (DKI) measures (axonal kurtosis (AK), radial kurtosis (RK), axonal water fraction (AWF), mean kurtosis (MK)), and neurite orientation dispersion and density imaging (NODDI)18 measures (KAPPA, orientation dispersion index (ODI), intracellular volume fraction (FICVF), isotropic volume fraction (FISO)). We hypothesized that sophisticated dMRI models such as NODDI and DKI will not only provide robust white matter (WM) dMRI-derived measures that are both sensitive and specific to PD-FoG but also provide supplementary information to conventional ST measures that might improve our understanding of the neural mechanisms underlying PD-FoG.Methods
Participants: We recruited seventeen PD-FoG, twenty-one PD-nFoG, and seventeen HC which were cognitively intact and demographically matched. Furthermore, PD-FoG and PD-nFoG participants were matched for disease duration, affected side, and disease severity (Table.1). Diagnosis of PD-FoG was determined by direct observation of FoG by a movement disorders specialist during a physical therapy task designed to elicit FoG, rather than relying on patient self-report measures. All participants utilized in this study were scanned with the following dMRI acquisition parameters on a 3T Siemens Skyra scanner: number of b-values=3, b-values=500s/mm2, 1000s/mm2, 2500s/mm2 (multi-shell dMRI data was acquired in the same run to keep the shimming factor consistent across various b-values), number of diffusion-encoding directions at each shell=71, number of non-diffusion weighted images (b0)=25 (b0 images were acquired in an interleaved fashion), isotropic spatial resolution=1.5mm3, repetition time(TR)=5218ms, TE=100ms, multiband factor(MB)=3, acceleration factor (GRAPPA)=2, phase encoding direction= P>>A. We also acquired a b0 image with the same parameters but with opposite phase encoding direction (A>>P) for eddy-current distortion correction19. Total acquisition time=23 minutes. Pre-processing: Eddy-current distortion correction was performed using eddy tool in FSL 6.0, and translational head motion during the scan was computed for each participant. Post-processing: In-house determination of whole-brain FW was performed for each participant utilizing the lower shell dMRI data (b=500s/mm2, 1000s/mm2), and FW-ST measures were estimated for all participants. DKI and NODDI measures were also established for all participants using dMRI at all three-shells using appropriate toolboxes. Additionally, we also computed ST measures utilizing the lower shell dMRI data (b=500s/mm2, 1000s/mm2) using dtifit toolbox in FSL 6.0. Statistical analysis: Nonparametric comparisons between the means of each dMRI measure between groups, and correlations of these measures with clinical measures were performed using permutation analysis of linear models (PALM)20 in FSL. Significance was established at pcorr<0.05.Results
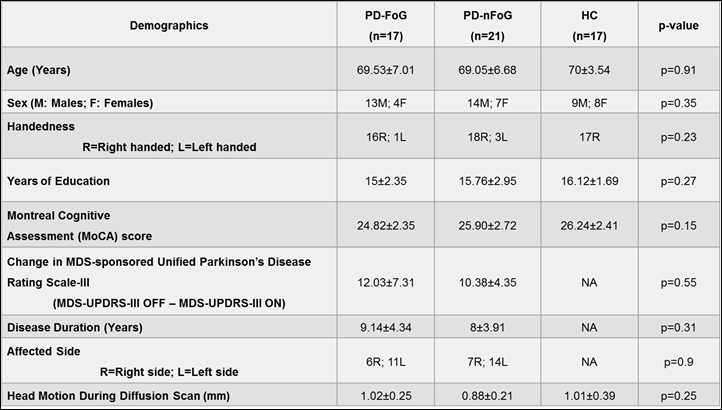
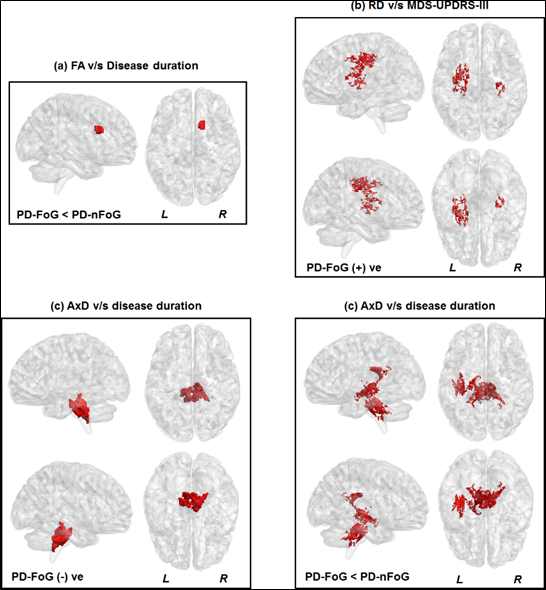
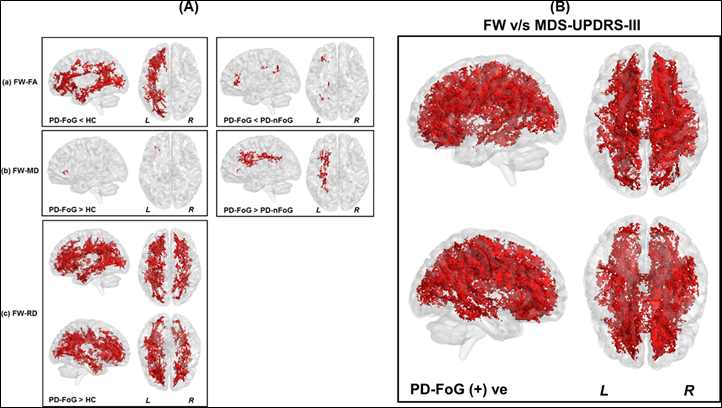
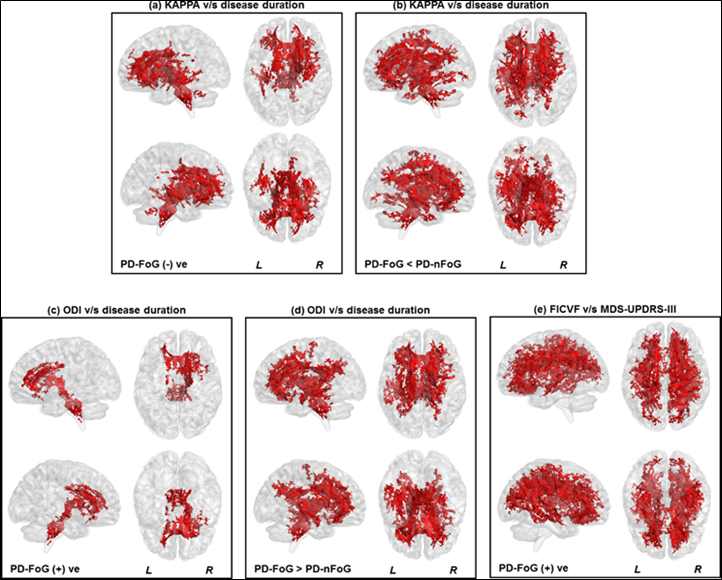
Non-significant (p>0.05) head motion during dMRI scan was observed between groups (Table.1). Although ST measures were correlated with clinical variables (Fig.1), no ST dMRI-derived measures were found to be significantly different between the groups. However, FW-FA measures were lower while FW-MD and FW-RD were higher in PD-FoG (Fig.2a) when compared to PD-nFoG and HC, and only FW was found to be correlated with disease severity (Fig.2b). Similarly, DKI measures (RK and AWF) were significantly lower in PD-FoG as compared to both PD-nFoG and HC (Fig.3a). AK showed a significant positive correlation with disease duration in PD-FoG (Fig.3b) and a significantly higher correlation as compared to PD-nFoG (Fig.3b). No NODDI measures were found to be significantly different between the groups, although KAPPA, ODI, and FICVF measures were found to be correlated with clinical variables in PD-FoG (Fig.4).Discussion
Our analysis revealed that DKI and FW-ST dMRI-derived measures were both sensitive and specific to white matter disorganization in PD-FoG, especially dMRI-derived measures in the WM tracts of brainstem, cerebellum, thalamus, and limbic cortex. Furthermore, correlations of WM disorganization with clinical variables suggest dMRI could serve as a neuroanatomical biomarker of disease progression and severity in PD-FoG.Conclusion
DKI and FW-ST models were found to be both sensitive and specific dMRI models to understand WM disorganization in PD-FoG. Analysis with longitudinal data and multimodal analyses utilizing resting-state fMRI and DKI/FW-ST observed predictors of PD-FoG that might identify neural mechanisms underlying PD-FoG, are currently underway.Acknowledgements
This research project was supported by the NIH COBRE grant 5P20GM109025, Keep Memory Alive-Young Investigator Award, and philanthropic funds from Peter and Angela Dal Pezzo, Lynn and William Weidner, and Stacie and Chuck Matthewson.References
1. Hely MA, Reid WGJ, Adena MA, Halliday GM, Morris JGL. The Sydney multicenter study of Parkinson’s disease: the inevitability of dementia at 20 years. Mov Disord. United States; 2008;23:837–844.
2. Snijders AH, Leunissen I, Bakker M, et al. Gait-related cerebral alterations in patients with Parkinson’s disease with freezing of gait. Brain. 2010;134:59–72.
3. Okuma Y, Silva de Lima AL, Fukae J, Bloem BR, Snijders AH. A prospective study of falls in relation to freezing of gait and response fluctuations in Parkinson’s disease. Parkinsonism Relat Disord. England; 2018;46:30–35.
4. Shine JM, Matar E, Ward PB, et al. Freezing of gait in Parkinson’s disease is associated with functional decoupling between the cognitive control network and the basal ganglia. Brain. 2013;136:3671–3681.
5. Rubino A, Assogna F, Piras F, et al. Does a volume reduction of the parietal lobe contribute to freezing of gait in Parkinson’s disease? Park Relat Disord. 2014;20:1101–1103.
6. Herman T, Rosenberg-Katz K, Jacob Y, Giladi N, Hausdorff JM. Gray matter atrophy and freezing of gait in Parkinson’s disease: Is the evidence black-on-white? Mov Disord. John Wiley & Sons, Ltd; 2014;29:134–139.
7. Fling BW, Cohen RG, Mancini M, Nutt JG, Fair DA, Horak FB. Asymmetric pedunculopontine network connectivity in parkinsonian patients with freezing of gait. Brain. 2013;136:2405–2418.
8. Schweder PM, Hansen PC, Green AL, Quaghebeur G, Stein J, Aziz TZ. Connectivity of the pedunculopontine nucleus in parkinsonian freezing of gait. Neuroreport. 2010;21:914–916.
9. Tessitore A, Amboni M, Esposito F, et al. Resting-state brain connectivity in patients with Parkinson’s disease and freezing of gait. Park Relat Disord. 2012;18:781–787.
10. Fling BW, Cohen RG, Mancini M, et al. Functional Reorganization of the Locomotor Network in Parkinson Patients with Freezing of Gait. PLoS One. Public Library of Science; 2014;9:e100291.
11. Canu E, Agosta F, Sarasso E, et al. Brain structural and functional connectivity in Parkinson’s disease with freezing of gait. Hum Brain Mapp. John Wiley & Sons, Ltd; 2015;36:5064–5078.
12. Shine JM, Matar E, Bolitho SJ, et al. Modeling freezing of gait in Parkinson’s disease with a virtual reality paradigm. Gait Posture. 2013;38:104–108.
13. Gilat M, Shine JM, Walton CC, O’Callaghan C, Hall JM, Lewis SJG. Brain activation underlying turning in Parkinson’s disease patients with and without freezing of gait: a virtual reality fMRI study. npj Park Dis. 2015;1:15020.
14. Shine JM, Matar E, Ward PB, et al. Exploring the cortical and subcortical functional magnetic resonance imaging changes associated with freezing in Parkinson’s disease. Brain. England; 2013;136:1204–1215.
15. Wang M, Jiang S, Yuan Y, et al. Alterations of functional and structural connectivity of freezing of gait in Parkinson’s disease. J Neurol. 2016;263:1583–1592.
16. Bluett B, Banks S, Cordes D, et al. Neuroimaging and neuropsychological assessment of freezing of gait in Parkinson’s disease. Alzheimer’s Dement Transl Res Clin Interv. 2018;4:387–394.
17. Jensen JH, Helpern JA, Ramani A, Lu H, Kaczynski K. Diffusional kurtosis imaging: the quantification of non-gaussian water diffusion by means of magnetic resonance imaging. Magn Reson Med. United States; 2005;53:1432–1440.
18. Zhang H, Schneider T, Wheeler-Kingshott CA, Alexander DC. NODDI: practical in vivo neurite orientation dispersion and density imaging of the human brain. Neuroimage. United States; 2012;61:1000–1016.
19. Andersson JLR, Sotiropoulos SN. An integrated approach to correction for off-resonance effects and subject movement in diffusion MR imaging. Neuroimage. United States; 2016;125:1063–1078.
20. Winkler AM, Ridgway GR, Webster MA, Smith SM, Nichols TE. Permutation inference for the general linear model. Neuroimage. United States; 2014;92:381–397.
Figures