1514
Data-driven model of Parkinson’s disease progression performs precision staging with magnetic resonance imaging biomarkers1Department of Computer Science, University College London, London, United Kingdom, 2Department of Medical Physics and Biomedical Engineering, University College London, London, United Kingdom, 3Department of Neurodegenerative Diseases, University College London, London, United Kingdom
Synopsis
We estimate a data-driven signature of de novo Parkinson's disease progression as a sequence of disease events. We show that clinical decline in classic markers precedes grey-matter and white-matter neurodegeneration estimated from T1-weighted MRI and diffusion-weighted MRI. Using only cross-sectional data from the PPMI data set, we show model utility for fine-grained staging/stratification of patients, which holds promise for future clinical applications.
Introduction
Parkinson’s disease (PD) is the second-most common neurodegenerative disease. PD is highly heterogeneous, with only crude symptom-based subtypes known and no disease-modifying treatments available. Magnetic Resonance Imaging (MRI) biomarkers in PD have shown highly-variable results with, at best, only weak “disease signal” in early stages, and no clear correlation with disease severity1. Here we study the value of MRI biomarkers for understanding PD progression in the context of a data-driven disease progression model2.Methods
We built an event-based model3,4,5 (EBM) using cross-sectional (baseline) input features from de novo PD patients (n=150; 0.6 ± 0.5 years since diagnosis) and healthy controls (n=40) in the Parkinson’s Progression Markers Initiative (PPMI) database (ppmi-info.org). Exclusion criteria was excessive missing data (>50% of our 12 features).The EBM estimates a fine-grained quantitative signature of disease progression as an ordered sequence of events (with uncertainty) corresponding to features becoming abnormal. To assess the value of MRI biomarkers we built EBMs both with, and without, MRI biomarkers.
Input features included three PD-specific clinical scores (Movement Disorders Society Unified PD Rating Scale, UPDRS; University of Pennsylvania Smell Identification Test, UPSIT; REM sleep Behaviour Disorder questionnaire, RBD), two DaTSCAN imaging biomarkers of dopamine deficiency in the striatum (striatal binding ratio, SBR), and seven MRI biomarkers: regional grey-matter atrophy (T1-weighted MRI; n=6); and microstructural integrity within the substantia nigra (diffusion-weighted MRI, DWI; n=1). DaTSCAN and DWI values were obtained directly from PPMI. The T1w MRI biomarkers were estimated by either Freesurfer 5.3.0 cross-sectional (n=3; Desikan-Killiany atlas; http://surfer.nmr.mgh.harvard.edu/) or Geodesic Information Flows6 (n=3; Neuromorphometrics atlas). For simplicity, we included the top 3 from each set of MRI biomarkers, ranked by Mann-Whitney U test results (controls vs PD).
To assess the value of MRI biomarkers, we investigated the discriminative power of model staging for patients, controls, and a third clinical group known as SWEDD (n=34) — Scan Without Evidence of Dopaminergic Deficit — who meet clinical criteria for PD but have a negative DaTSCAN (visual rating). Model staging assigns individuals to their most likely numerical stage (by aligning their data with the model), which is then used to discriminate clinical groups. We perform these experiments for each EBM (with/without MRI features).
We validated our models internally using 10-fold cross-validation (CV). Statistical model similarity is defined as $$$S = 1–H^2$$$, where $$$H$$$ is the average Hellinger distance (0 to 1) between model posteriors.
Results
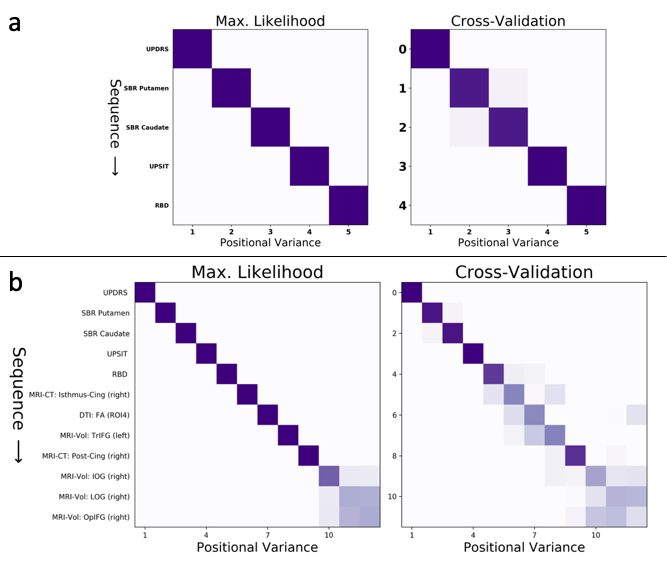
Figure 1 shows the sequence of events (top to bottom) in PD progression estimated by our event-based models: Figure 1a shows the EBM without MRI; and Figure 1b shows the EBM with MRI biomarkers.We observe that the ordering of non-MRI events is unchanged in all models: movement problems (UPDRS) precede bilateral dopamine deficits in the striatum (SBR), first in the putamen then the caudate, followed by olfactory deficits (UPSIT), and finally sleep problems (RBD). The EBM estimates that these classic markers of PD become detectably abnormal before MRI biomarker events, which occur later in PD progression and with less certainty in the ordering. Within the MRI biomarkers (Figure 1b), earlier events are cortical thinning in the isthmus cingulate and reduced fractional anisotropy in the substantia nigra, which both tend to precede grey-matter volume loss in frontal and occipital gyri.
Confidence in the orderings (row-wise in Figure 1) is generally very high and is strongest (dark diagonal) early in the sequences (Figure 1). The orderings (Figure 1, left) hold up well under cross-validation (Figure 1, right), with high CV similarity of 0.98 (without MRI) and 0.88 (with MRI), and also high similarity of $$$S_a = 0.98 \pm 0.02$$$ (without MRI) and $$$S_b = 0.91 \pm 0.08$$$ (with MRI) between the maximum-likelihood and cross-validated models (mean $$$\pm$$$ std).
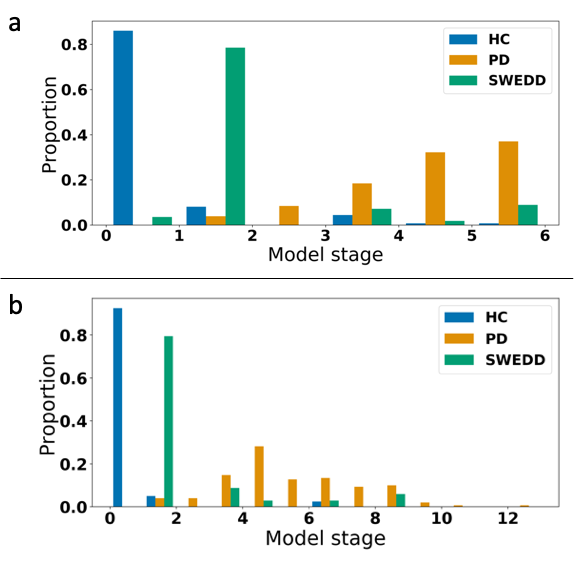
Model staging results are shown in Figure 2. Clear separation is observed between controls and patients, with the SWEDD group spread across intermediate stages. Classification performance using stage thresholds was very high and improved with MRI biomarkers in the model. Using either stage 1 or 2 as a threshold, balanced accuracy was 97% for HC vs PD (98% with MRI), 89% for HC vs SWEDD (96% with MRI), and 94% for SWEDD vs PD (94% with MRI).
Discussion
We highlight two contributions. Firstly, our data-driven model of de novo PD progression improves understanding of the precise sequence of events involved in the earliest stages of this heterogeneous disease. Secondly, our experiments showed that the inclusion of MRI biomarkers in a data-driven model adds value by improving discriminative power through high-precision patient staging. We plan to investigate this in the future using Subtype and Stage Inference7.Conclusion
Data-driven disease progression modelling including MRI biomarkers can improve precision in de novo Parkinson’s disease. The clinical utility of this approach, and the value of MRI biomarkers, should be investigated in prospective clinical research and clinical practice.Acknowledgements
This project has received funding from the European Union’s Horizon 2020 research and innovation programme under grant agreement No. 666992. This work was supported by the National Institute for Health Research University College London Hospitals Biomedical Research Centre. R.S.W. and L.L. are supported by a Wellcome Clinical Research Career Development Fellowship (201567/Z/16/Z).
Data used in the preparation of this article were obtained from the Parkinson's Progression Markers Initiative (PPMI) database (www.ppmi-info.org/data). For up-to-date information on the study, visit www.ppmi-info.org.
References
- Saeed et al., Translational Neurodegeneration 2017
- Oxtoby & Alexander, Curr. Opin. Neurol. 2017
- Fonteijn et al., NeuroImage 2012
- Young et al, Brain 2014
- Oxtoby et al., under review 2019; Firth et al., bioRxiv 2018
- Cardoso et al., IEEE Trans. Med. Imag. 2015
- Young et al., Nat. Comms. 2018
Figures