1513
Default mode network connectivity differences in levodopa responsive subtypes of Parkinson’s disease patients with freezing of gait.1Cleveland Clinic Lou Ruvo Center for Brain Health, Las Vegas, NV, United States, 2University of California San Diego, La Jolla, CA, United States, 3Stanford University, Palo Alto, CA, United States
Synopsis
Dopaminergic deficiency can cause altered deactivation of the default mode network (DMN) connectivity, which subsequently impacts executive task performance resulting in freezing of gait (FOG). While the majority of Parkinson’s disease (PD) patients with FOG (PD-FOG) are responsive to levodopa, about 36% of PD patients are levodopa-resistant. Our results show increased DMN connectivity in levodopa-resistant PD-FOG group. Furthermore, we found that altered network connectivity in the levodopa-resistant group was correlated differently with neuropsychological measures. To the best of our knowledge this is the first study to investigate the functional connectivity differences in levodopa-resistant subtypes in PD-FOG.
Introduction
Freezing-of-gait (FOG) in Parkinson’s disease (PD) can be classified based on phenomenology and response to medication1. While the majority of PD-FOG patients are responsive to levodopa, about 36% of PD-FOG patients can be classified as levodopa-resistant (PD-FOG-NR)2. In addition, a recent behavioral study suggested that the pathophysiology of FOG-NR is potentially different when compared to other subtypes3. Whether the FOG-NR subtypes exhibit distinct functional connectivity (FC) patterns is still unknown. Therefore, in this pilot study, we investigated FC in FOG-NR patients using resting state functional MRI (rs-fMRI). Specifically, we studied the default mode network (DMN) in FOG-NR subjects. The DMN is the most commonly studied rs-fMRI network and DMN dysfunction has been implicated in several neuropsychiatric diseases including PD4-7. In PD-FOG, it has been suggested that dopaminergic deficiency could cause altered deactivation of the DMN which subsequently impacts executive task performance and may result in freezing of gait (FOG)7. Identifying the pathophysiology in this particular subtype can potentially be an important step in categorizing different subtypes of PD and subsequently aid in development of effective therapies.Methods
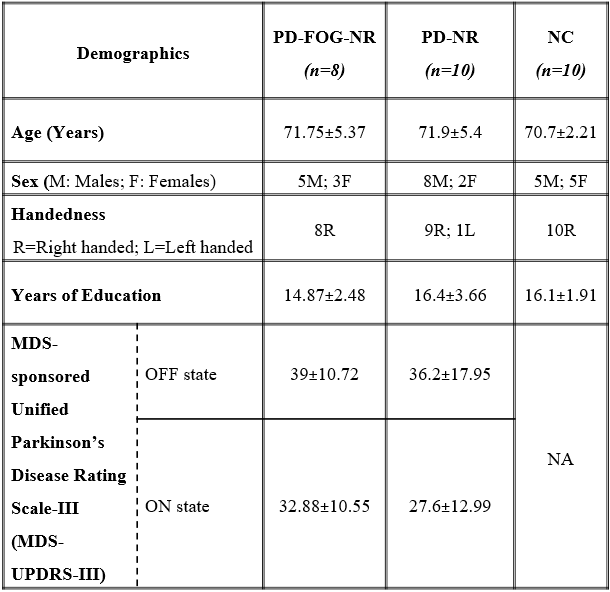
38 PD participants were recruited and 17 participants were identified as PD-FOG and 21 PD without FOG, based on a comprehensive battery of clinical testing by a movement disorders specialist, in addition to self-report measures. PD participants were identified as NR if the change in the Movement Disorders Society-Unified Parkinson’s Disease Rating Scale (MDS-UPDRS-III) score between the OFF and ON states was less than 30%8. This criteria yielded 8 PD-FOG-NR and 10 PD-NR participants. 5 of the 8 PD-FOG-NR in addition to <30% change in MDS-UPDRS-III score also showed FOG symptoms in ON state (FOG-NR1) based on movement disorders specialist evaluation and the remaining 3 subjects did not exhibit FOG symptoms in the ON state (FOG-NR2). We also included 10 matched controls (NC) (Refer table 1 for demographics). All participants (PD in ON state) underwent rs-fMRI scans and 850 volumes were acquired at a TR of 700ms on a 3T Siemens Skyra scanner. Mean time series were obtained from the following DMN regions9: medial prefrontal cortex, posterior cingulate cortex and bilateral inferior parietal lobule (IPL). Seed based FC maps were obtained for all participants. Nonparametric statistical analyses of group FC differences (PD-FOG-NR, PD-NR and NC) and FC association with MDS-UPDRS-III scores were then conducted using the permutation analysis of linear models (PALM) toolbox in FSL10. Statistical measures were considered significant at family-wise error corrected p<0.05. We also repeated the above analysis separately with the FOG-NR1 and FOG-NR2 subtypes to verify that the results were predominantly driven by the levodopa-resistant (FOG-NR1) subjects. Due to the small sample size of the subtypes we used the effect size (Cohen’s d) maps thresholded at d>0.8 (large effect) and puncorr<0.05 to determine the differences and associations that showed the largest effect.Results
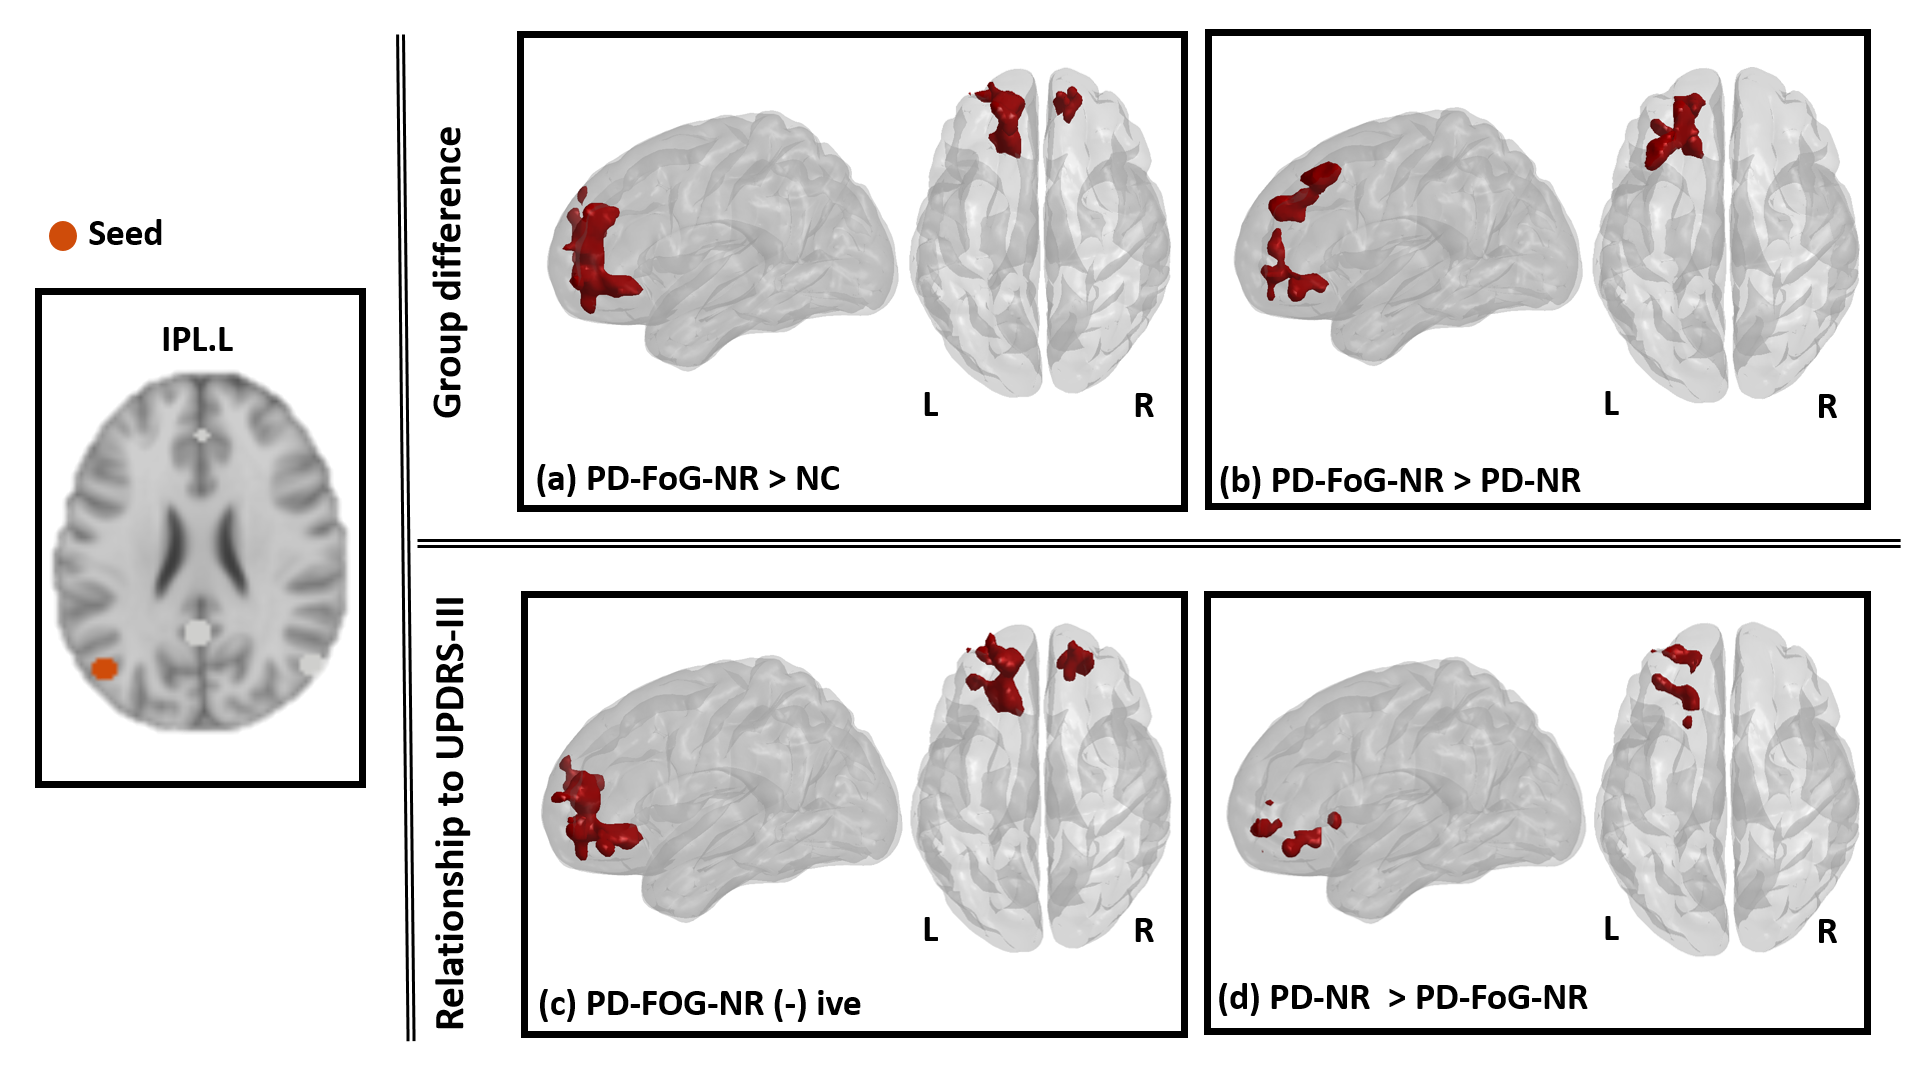
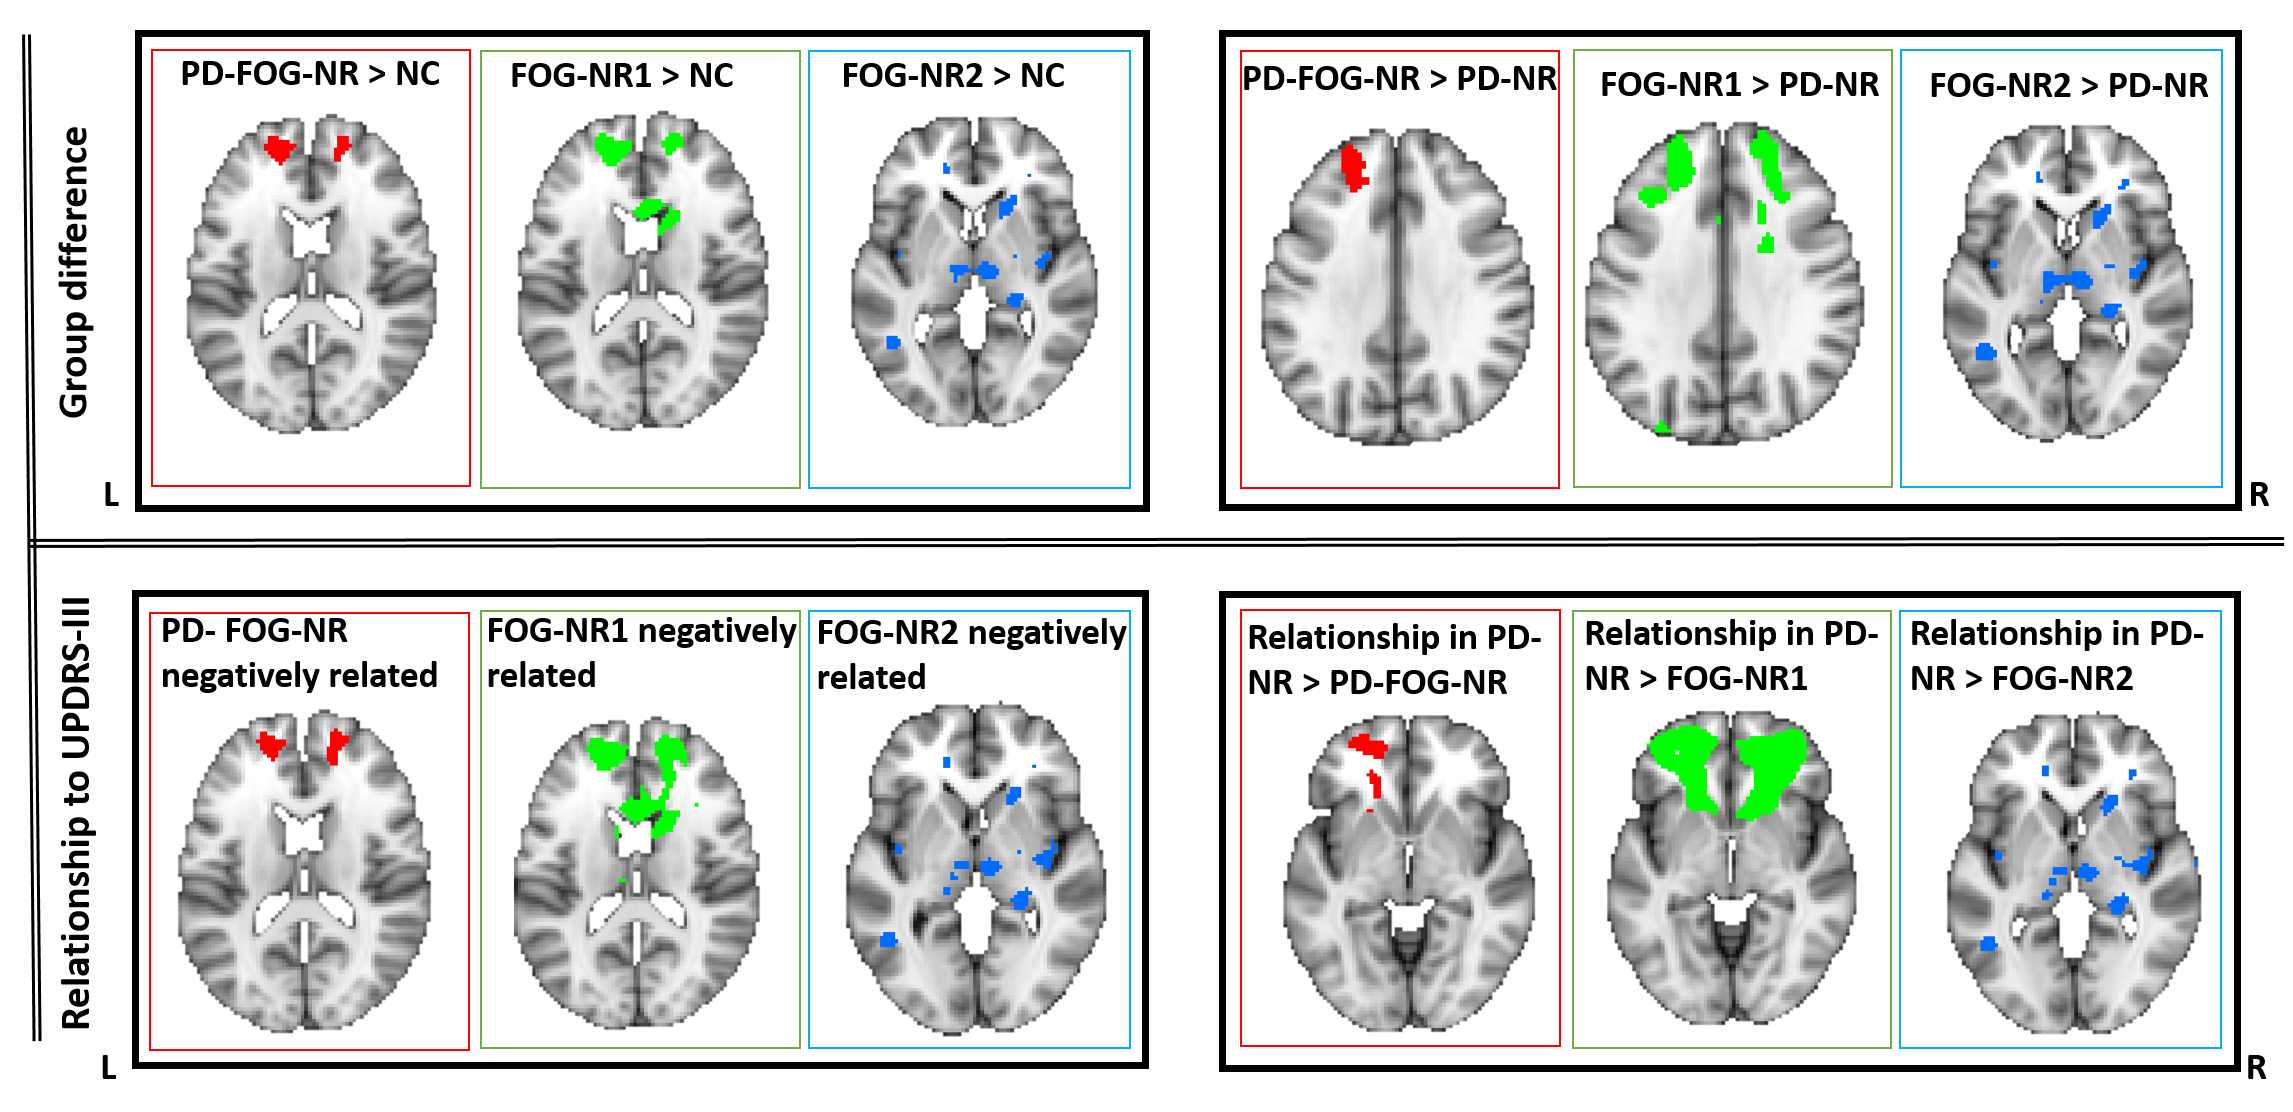
PD-FOG-NR, PD-NR and HC: Fig.1 (upper panel) shows clusters where left IPL (L.IPL) seed-based FC was different in between the different groups and the lower panel depicts the relationship between L.IPL connectivity and the MDS-UPDRS-III score. Fig.1a shows clusters that depicted hyper-connectivity in the PD-FOG-NR as compared to the NC group primarily comprising the bilateral superior orbital-frontal (sup.OFC), right gyrus rectus (R.GR) and left superior frontal gyrus (L.SFG). Fig.1b shows the clusters involving bilateral sup.OFC, right anterior cingulate cortex (ACC), R.SFG where PD-FOG-NR showed greater FC when compared to the PD-NR group. Fig.1c showed a negative relationship between the L.IPL and frontal regions (bilateral sup.OFC, R.ACC, R.SFG) FC and MDS-UPDRS-III in the PD-FOG-NR group and these regions also showed differential relationship when compared to the PD-NR group (Fig.1d). No other seed-based FC maps showed any significant differences between groups or relationship with MDS-UPDRS-III. FOG-NR1, PD-NR and NC: The middle plot in all the panels in Fig.2 shows the results for the analysis comparing the different groups. Similar to the results obtained using the PD-FOG-NR group majority of the connectivity difference and associations with the largest effect were observed mainly in the frontal regions. FOG-NR2, PD-NR and NC: The right plot in all the panels in Fig.2 shows the results for the analysis comparing the different groups. As can be observed, the large effects were mainly seen mainly in the subcortical, parietal and temporal regions and had minimal overlap with the differences and associations seen in earlier comparisons.Discussion and Conclusion
To the best of our knowledge, our study is the first to investigate the FC differences in the levodopa-resistant subtypes in PD-FOG. The preliminary analysis demonstrates that PD-FOG-NR subjects exhibit distinct patterns of altered connectivity in anterior DMN that is related differently to the MDS-UPDRS-III. The hyper-connectivity in the frontal regions might be a compensatory mechanism in PD-FOG-NR as studies have shown that the frontal and executive networks are altered in FOG. Although our PD-FOG-NR group was classified based on change in MDS-UPDRS-III, with the smaller-group analysis (FOG-NR1 and FOG-NR2) we have demonstrated that levodopa-resistant and levodopa responsive sub-types may exhibit different pathophysiology given the differences in connectivity patterns and association with MDS-UPDRS-III. However, it is important to further examine these differences using larger samples and directly comparing the other levodopa-resistant or induced subtypes to confirm our findings.Acknowledgements
This research project was supported by the NIH COBRE grant 5P20GM109025, Keep Memory Alive-Young Investigator Award, and philanthropic funds from Peter and Angela Dal Pezzo, Lynn and William Weidner, and Stacie and Chuck Matthewson.References
[1] Fasano A, Lang AE. Unfreezing of gait in patients with Parkinson’s disease. Lancet neurology 2015;14:675–677.
[2] Amboni M, Stocchi F, Abbruzzese G, et al. Prevalence and associated features of self-reported freezing of gait in Parkinson disease: The DEEP FOG study. Parkinsonism & related disorders 2015;21:644–649.
[3] McKay J, Goldstein F, Factor S. Anxiety and depression are associated with levodopa-responsive, but not levodopa-unresponsive, freezing of gait in Parkinson’s disease. Neurology Apr 2019, 92 (15 Supplement) P2.8-031
[4] Lustig C, Snyder AZ, Bhakta M, et al. Functional deactivations: change with age and dementia of the Alzheimer type. Proc Natl Acad Sci U S A. 2003;100(24):14504–14509.
[5] Calhoun VD, Maciejewski PK, Pearlson GD, Kiehl KA. Temporal lobe and “default” hemodynamic brain modes discriminate between schizophrenia and bipolar disorder. Hum Brain Mapp. 2008;29(11):1265–1275. [PMC free article] [PubMed] [Google Scholar]
[6] Ghahremani M, Yoo J, Chung SJ, Yoo K, Ye JC, Jeong Y. Alteration in the Local and Global Functional Connectivity of Resting State Networks in Parkinson's Disease. J Mov Disord. 2018;11(1):13–23. doi:10.14802/jmd.17061
[7] van Eimeren T, Monchi O, Ballanger B, Strafella AP. Dysfunction of the default mode network in Parkinson disease: a functional magnetic resonance imaging study. Arch Neurol. 2009;66(7):877–883. doi:10.1001/archneurol.2009.97
[8] Postuma, R. B., Berg, D. , et. al. (2015), MDS clinical diagnostic criteria for Parkinson's disease. Mov Disord., 30: 1591-1601. doi:10.1002/mds.26424
[9] Philippi CL, Pujara MS, Motzkin JC, Newman J, Kiehl KA, Koenigs M. Altered resting-state functional connectivity in cortical networks in psychopathy. J Neurosci. 2015;35(15):6068–6078. doi:10.1523/JNEUROSCI.5010-14.2015
[10] Winkler AM, Ridgway GR, Webster MA, Smith SM, Nichols TE. Permutation inference for the general linear model. Neuroimage 2014; 92: 381–397.
[11] Xia M, Wang J, He Y (2013) BrainNet Viewer: A Network Visualization Tool for Human Brain Connectomics. PLoS ONE 8(7): e68910. doi:10.1371/journal.pone.0068910.
Figures