1512
ViSTa Myelin Water Imaging in Parkinson’s Disease
Septian Hartono1,2, Leon Qi Rong Ooi3, Amanda May Yeng Choo1, Celeste Yan Teng Chen1, Amanda Jieying Lee4, Weiling Lee4, Pik Hsien Chai4, Kuan Jin Lee5, Jongho Lee6, Eng King Tan1,2, and Ling Ling Chan2,4
1National Neuroscience Institute, Singapore, Singapore, 2Duke-NUS Medical School, Singapore, Singapore, 3National University of Singapore, Singapore, Singapore, 4Singapore General Hospital, Singapore, Singapore, 5Singapore BioImaging Consortium, Singapore, Singapore, 6Seoul National University, Seoul, Republic of Korea
1National Neuroscience Institute, Singapore, Singapore, 2Duke-NUS Medical School, Singapore, Singapore, 3National University of Singapore, Singapore, Singapore, 4Singapore General Hospital, Singapore, Singapore, 5Singapore BioImaging Consortium, Singapore, Singapore, 6Seoul National University, Seoul, Republic of Korea
Synopsis
There is increasing evidence that myelin can be directly involved in Parkinson's disease (PD). We investigated the utility of ViSTa myelin water imaging (MWI) to characterize changes in myelination in PD. Slight decrease of global white matter myelin water fraction (MWF) was observed in PD patients. MWF was also associated with cognitive status, while no such association was found between DTI metrics and cognitive status. These indicated that MWF may potentially be a more specific biomarker for dysmyelination in the brain.
Introduction
Non-invasive assessment of white matter (WM) microstructure in Parkinson’s disease (PD) is usually done via diffusion tensor imaging (DTI). DTI provides an indirect marker of predominantly axonal fiber orientation as well as myelin integrity.1 There is increasing evidence that myelin may be directly involved in PD through autoantibodies against oligodendrocyte proteins2,3, which highlights the need of more specific imaging techniques targeting myelin. A new myelin water imaging (MWI) method, namely direct visualization of short transverse relaxation time component (ViSTa), has recently been developed4 as an alternative to more conventional MWI techniques such as T2 relaxometry with GRASE MWI.5 In this case control study, we investigated changes on MWI in PD using ViSTa.Methods
The study is approved by the local ethics board. Seventeen age-matched healthy controls (HC) and 21 PD patients formed the study population (Figure 1). Patients were diagnosed by movement disorder neurologist based on prevailing clinical criteria. All participants underwent motor and cognitive assessments (Figure 1), including the Unified Parkinson’s Disease Rating Scale (UPDRS), Hoehn and Yahr Scale (H&Y) and Montreal Cognitive Assessment (MoCA), and brain MRI on a 3T scanner using standardized protocol, with both MWI and DTI acquisitions. 3D segmented EPI-based ViSTa MWI sequence4 had: TR/TE=1160/6.8ms, TI1/TI2=560/220 ms, in-plane resolution=1.4×1.4×4.0mm3, number of slices=32, scan time=6:53mins. Saturation pulses were applied to prevent fat and flow artifacts. For ViSTa quantification, a PD-weighted GRE sequence based on the same EPI as the ViSTa sequence, but without the two inversion pulses, was acquired (TR=100ms; FA=28°; scan time=35s).Comparison of MWI with diffusion metrics were performed using diffusion data from the diffusion spectrum imaging scheme with: SMS slice factor 3, TR/TE=4100/110ms, in-plane resolution=2x2x2mm3, number of slices=81, 128 diffusion samplings with b-values up to 3000 s/mm2, scan duration=9:17mins. Two non-diffusional gradient images (b0, b=0 s/mm2) and one b0 image with reverse phase encoding direction were also acquired. The diffusion data were reconstructed in the MNI space using standard DTI model in DSI studio (Fiber Tractography Lab, University of Pittsburgh, Pennsylvania, USA).
For the quantitative analysis, myelin water fraction (MWF) was calculated by dividing ViSTa data by proton density (PD) weighted gradient echo (GRE) data and multiplying it by a scaling factor.4 The resulting ViSTa MWF was referred to as the apparent MWF (aMWF), which was roughly one third of conventional MWF due to the incomplete scaling factor.6
Skeletons of aMWF and FA were generated using TBSS in FSL to investigate statistical group differences between PD and HC.7 Skeletons of aMWF and FA were generated independently as they measure different quantities of the brain tissue.8 Radial diffusivity (RD) value was extracted using FA skeleton. Statistical analysis was performed with significance defined at p<0.05.
Results
Sample images of aMWF map derived from ViSTa MWI were shown in Figure 2.Mean global MWI and DTI metrics of the study cohort were tabulated in Figure 3.
Global aMWF was slightly reduced in PD (3.55±0.39%) compared to HC (3.72±0.30%) groups, albeit not statistically significant (p=0.141). FA (p=0.805) and RD (p=0.759) were similar between PD and HC (Figure 3).
Global aMWF was strongly correlated with RD (r=-0.576, p=0.0006) and FA (r=0.528, p=0.002). There was also a strong correlation between global FA and RD (r=-0.944, p<0.0001; Figure 4).
Global aMWF was moderately correlated with MOCA (r=0.423, p=0.016; Figure 5) in both PD and HC. No significant correlation was found between MOCA and FA (r=0.236, p=0.193) or RD (r=-0.292, p=0.105).
Discussion
The ViSTa sequence utilized double inversion preparation pulses to suppress long T1 components, and the remaining signal is a short T2* signal from myelin water. Although the aMWF derived from ViSTa is only one third of conventional MWF, some studies have validated aMWF as a measure of myelin water.4,9-10 Given its simplicity, it can be potentially be considered as an alternative to the conventional T2 relaxometry method which is more computationally tedious.A recent study using conventional T2 relaxometry to derive MWF in PD found no significant differences in overall MWF or FA in twenty white matter ROIs between the PD and control groups.11 We observed a slight decrease of myelination in PD patients, albeit not statistically significant. Nevertheless, our findings of moderate correlation between aMWF and MOCA were consistent with previous studies that found an association between myelin breakdown and cognitive decline12-13. This suggested that whilst aMWF itself might be a good surrogate for myelination, other factors (such as educational level)14 may also affect and confound the degree of myelination in the brain.
RD has been associated with the degree of myelination15-16.This was also evident in our finding of strong correlation between aMWF and RD. However, only aMWF was associated with MOCA, while no significant correlation was found between RD and MOCA. This supported prevailing understanding of DTI metrics, that they, being affected by other factors such as axon density, axon caliber, cell swelling and fiber architecture, are indirect and nonspecific measures of underlying neuronal microstructure. Hence, aMWF potentially provides complementary and more specific information to DTI.
Conclusion
We found slight decrease of global white matter myelin water fraction in PD patients. Myelin water fraction was associated with cognitive status, and might potentially be a more specific biomarker of dysmyelination in PD.Acknowledgements
We would like to thank National Medical Research Council, Singapore for their funding support.References
- Melzer TR, Watts R, MacAskill MR, et al. White matter microstructure deteriorates across cognitive stages in Parkinson disease. Neurology 2013;80:1841–1849.
- Papuæ E, Kurzepa J, Kurys-Denis E, Grabarska A, Krupski W, Rejdak K. Humoral response against glial derived antigens in Parkinson’s disease. Neurosci Lett 2014;566:77–81.
- Papuæ E, Rejdak K. Anti-MAG autoantibodies are increased in Parkinson’s disease but not in atypical parkinsonism. J Neural Transm 2017;124:209–216.
- Oh SH, Bilello M, Schindler M, et al. Direct visualization of short transverse relaxation time component (ViSTa). Neuroimage 2013 Dec;83:485-92.
- Prasloski T, Rauscher A, MacKay AL, et al. Rapid whole cerebrum myelin water imaging using a 3D GRASE sequence. Neuroimage 2012;63(1):533-9.
- Choi JY, Jeong IH, Oh SH, et al. Evaluation of normal-appearing white matter in multiple sclerosis using direct visualization of short transverse relaxation time component (ViSTa) myelin water imaging and Gradient Echo and Spin Echo (GRASE) myelin water imaging. J Magn Reson Imaging 2018;49:1091–1098.
- Smith SM, Jenkinson M, Johansen-Berg H, et al. Tract-based spatial statistics: Voxelwise analysis of multi-subject diffusion data. NeuroImage 2006;31:1487-1505.
- Choi JY, Hart T, Whyte J, et al. Myelin water imaging of moderate to severe diffuse traumatic brain injury. Neuroimage Clin 2019;22:101785.
- Kim D, Lee HM, Oh SH, et al. Probing signal phase in direct visualization of short transverse relaxation time component (ViSTa). Magn Reson Med 2015;74:499–505.
- Lee HM, Kim D, Oh SS, et al. The phase and magnetization transfer characteristics of a novel myelin water imaging method (ViSTa). Proc Intl Soc Mag Reson Med 2014:338.
- Baumeister TR, Kim JL, Zhu M, et al. White matter myelin profiles linked to clinical subtypes of Parkinson's disease. J Magn Reson Imaging 2019;50(1):164-174.
- Bartzokis G, Lu PH, Mintz J. Quantifying age-related myelin breakdown with MRI: novel therapeutic targets for preventing cognitive decline and Alzheimer's disease. J Alzheimers Dis. 2004 Dec;6(6 Suppl):S53-9.
- Bartzokis G, Lu PH, Geschwind DH, et al. Apolipoprotein E genotype and age-related myelin breakdown in healthy individuals: implications for cognitive decline and dementia. Arch Gen Psychiatry 2006 Jan;63(1):63-72.
- Flynn SW, Lang DJ, Mackay AL, et al. Abnormalities of myelination in schizophrenia detected in vivo with MRI, and post-mortem with analysis of oligodendrocyte proteins. Mol Psychiatry. 2003 Sep;8(9):811-20
- Song SK, Sun SW, Ramsbottom MJ, et al. Dysmyelination revealed through MRI as increased radial (but unchanged axial) diffusion of water. Neuroimage 2002;17(3):1429-1436.
- Song SK, Yoshino J, Le TQ, et al. Demyelination increases radial diffusivity in corpus callosum of mouse brain. Neuroimage 2005;26:132-140.
Figures
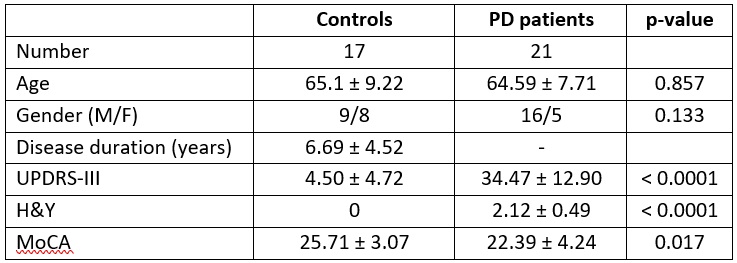
Figure
1. Study subject demographics.
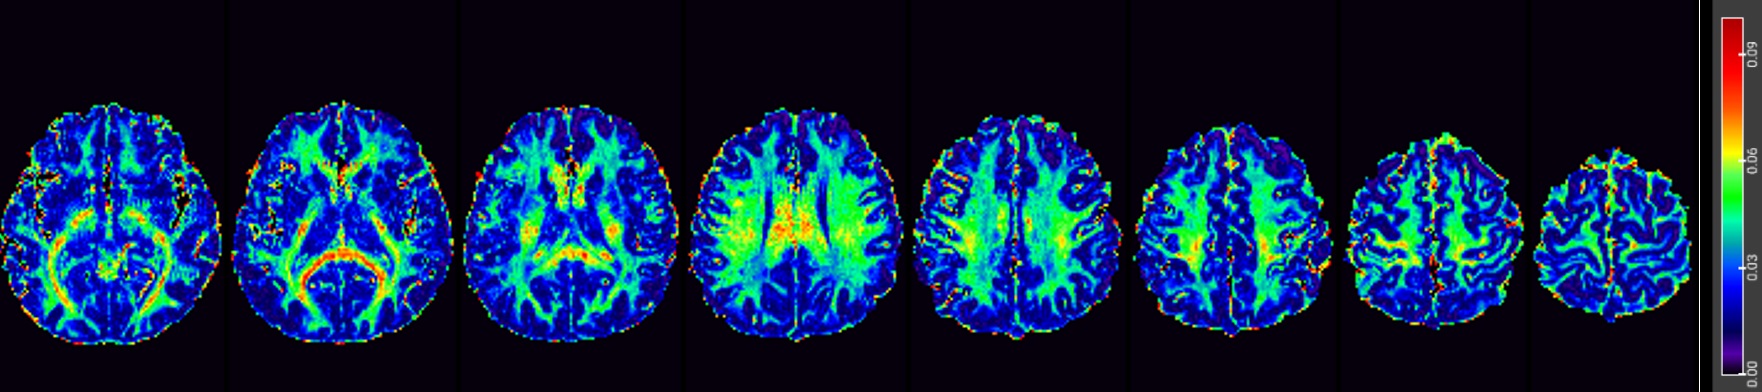
Figure 2. Representative
ViSTa apparent Myelin Water Fraction (aMWF) map from a healthy subject.
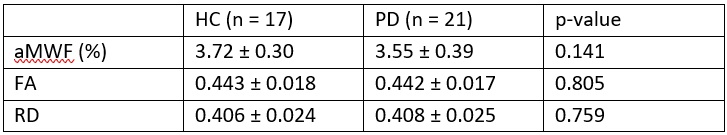
Figure 3. Mean
global values of the imaging metrics in the study cohort. aMWF: apparent myelin
water fraction, FA: fractional anisotropy, RD: radial diffusivity. The values
are mean ± standard deviation of all voxels on each global white matter
skeleton. RD used the same TBSS skeleton as FA.
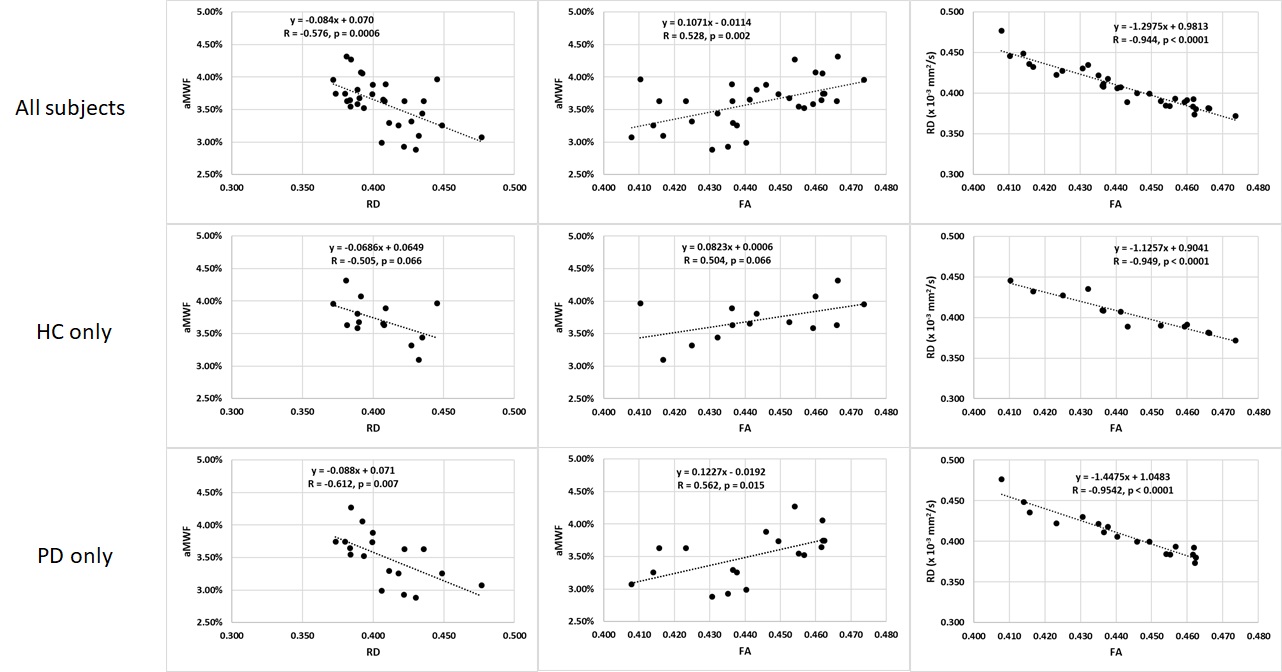
Figure 4.
Correlation between global aMWF, FA and RD in all subjects (top), HC only (middle)
and PD only (bottom).
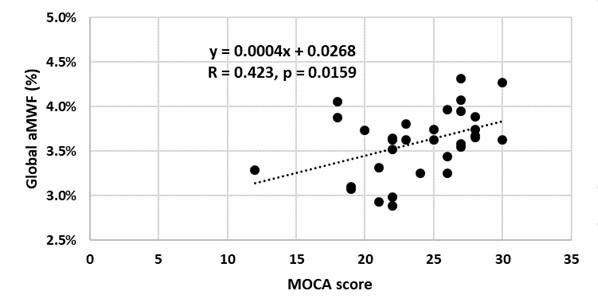
Figure 5.
Moderate positive correlation between global aMWF and MOCA score.