1511
Susceptibility Map-Weighted Imaging and Neuromelanin-Sensitive MRI in Parkinson’s Disease
Septian Hartono1,2, Isabel Hui Min Chew3, Weiling Lee3, Amanda May Yeng Choo1, Celeste Yan Teng Chen1, Leon Qi Rong Ooi4, Lirong Yin3, Kuan Jin Lee5, Jongho Lee6, Ching-Yu Cheng7, Eng King Tan1,2, and Ling Ling Chan2,3
1National Neuroscience Institute, Singapore, Singapore, 2Duke-NUS Medical School, Singapore, Singapore, 3Singapore General Hospital, Singapore, Singapore, 4National University of Singapore, Singapore, Singapore, 5Singapore BioImaging Consortium, Singapore, Singapore, 6Seoul National University, Seoul, Republic of Korea, 7Singapore Eye Research Institute, Singapore, Singapore
1National Neuroscience Institute, Singapore, Singapore, 2Duke-NUS Medical School, Singapore, Singapore, 3Singapore General Hospital, Singapore, Singapore, 4National University of Singapore, Singapore, Singapore, 5Singapore BioImaging Consortium, Singapore, Singapore, 6Seoul National University, Seoul, Republic of Korea, 7Singapore Eye Research Institute, Singapore, Singapore
Synopsis
Nigrosome-1 imaging and neuromelanin contrast have been identified as good radiological biomarkers of dopaminergic nigral degeneration in Parkinson's disease (PD) pathology. We evaluated the sensitivity of quantitative Susceptibility-Mapping Weighted Imaging (SMWI) derived from Quantitative Susceptibility Mapping (QSM) and neuromelanin sensitive (NMS) imaging in differentiating a case control cohort of PD patients. Region-of-interest analysis of the substantia nigra on both QSM/SMWI and NMS offered excellent differentiation of PD and healthy controls. However, QSM/SMWI offered more robust disease classification compared to NMS and might be preferred for use in the clinical setting.
Introduction
Patients with Parkinson’s disease (PD) are known to have dopaminergic denervation in the substantia nigra (SN). Prior studies have shown that nigrosome-1, a subregion of SN, and neuromelanin contrast are useful imaging surrogates to detect PD pathology.1,2 The nigrosome-1 is radiologically delineated as a region of signal hyperintensity on T2* susceptibility-weighted imaging (SWI) in healthy subjects, but lost in PD.3 Dark pigmentation of the SN is attributed to neuromelanin, which has T1-shortening properties manifest on neuromelanin-sensitive imaging (NMS), and reduced in PD.High resolution susceptibility map-weighted images (SMWI) has recently been developed to improve visualization of the nigrosome-1 region of the substantia nigra (SN) on 3T imaging.4 SMWI utilizes susceptibility weighting mask derived from quantitative susceptibility mapping (QSM) to enhance the contrast for the SWI magnitude images.
In this study, we evaluated the sensitivity of quantitative SMWI & NMS in differentiating PD from HC.
Methods
This study was approved by the local ethics board. Twenty-eight PD patients clinically diagnosed by a movement disorder specialist and 25 healthy controls (HC) were included in the study (Figure 1). All participants underwent motor assessments (Figure 1), viz the Unified Parkinson’s Disease Rating Scale (UPDRS), Hoehn and Yahr Scale (H&Y), and brain MRI scan on a 3T scanner.3D high resolution T2* SWI images were acquired using a multi-echo gradient echo sequence with TR=48ms, TE=13.77/26.39/39ms, FA=20°, in-plane resolution= 0.5x0.5x1mm3, number of slices = 32, scan duration 4:09mins. An oblique-coronal imaging plane oriented perpendicular to the midbrain structure was chosen (Figure 2).4
A high resolution NMS imaging was performed using a T1 TSE sequence with TR/TE=938/15 ms, voxel size=0.5x0.5x3mm3, number of slices=13, scan duration 10:25mins. The imaging tilting was copied from the SWI acquisition and the first slice placement follows SWI acquisition.
QSM and SMWI images were reconstructed from the multi-echo GRE images using SMWI software (Seoul National University, Seoul, South Korea).4
Region-of-interest (ROI) of the SN was manually drawn on SMWI and NMS images, whilst blinded to subject status (Figure 3). SMWI images were inspected in the superoinferior-anteroposterior direction to identify the last slice where the inferior tail of the red nucleus was still visible. The SN mask was drawn along its margins on the next consecutive 3 slices. A background ROI mask was placed over the decussation of the superior cerebellar peduncles, which lies inferior to the SN.5
On the NMS images, the SN mask was drawn on the slice corresponding to the first SMWI slice containing the SN mask. The SN mask was drawn on this and the next inferior slice.
Histogram analysis was performed on the mask metrics from both QSM/SMWI and NMS. The difference in the mean susceptibility values from the SN and background masks were computed from the QSM images. Chi-square test was used to compare the sex distribution between PD patients and healthy controls. Mann-Whitney U test or independent Student’s t-test was performed according to the normality of each continuous variable distribution.
Results
Clinical demographics were reported in Figure 1. Representative images of NMS, QSM and SMWI in a HC and PD patient were shown in Figure 4. SN masks on SWMI and NMS were similar in volume between PD and HC (p=0.675).Mean quantitative values from the SN masks on QSM/SMWI and NMS images are tabulated in Figure 5. Susceptibility values in the SN was significantly higher in PD than HC (p<0.0001). Given that SMWI was derived from the QSM, similar results were also found in the SN masks on SMWI, where the mean signal in the SN was significantly lower in PD than HC.
There was no significant difference in mean signal of the SN masks on NMS between PD and HC (p=0.104). After filtering for voxels which are higher than background signal, the SN masks in HC were significantly bigger than PD.
Discussion
To our knowledge, this is the first study evaluating the sensitivity of QSM/SMWI and NMS imaging in PD. Our quantitative SMWI results confirmed and added to the existing literature showing the utility of SMWI as a tool to visualize nigrosome-1.1,4,6 SMWI heightens the contrast between regions with high iron content such as SN and its surrounding structures, as shown by the strong differentiation between PD and HC in our results. As such, it would be an ideal tool for radiologists in clinical diagnosis.Although NMS imaging was also able to distinguish PD and HC well, it was not as robust as SMWI in sensitivity. NMS images needed additional post-processing to accentuate the difference between PD and HC by filtering out signal contribution from the background which are visually distracting. Besides, the SN boundaries on NMS images were not as crisp as those on SMWI images, as the viable, neuromelanin-containing dopaminergic neurons appeared more diffuse distributed on NMS images, especially in PD (Figure 4).
Conclusion
Both QSM/SMWI and NMS offered excellent differentiation of PD and HC through targeted imaging of nigrosome-1 and neuromelanin-containing dopaminergic neurons respectively. Nevertheless, QSM/SMWI offered more robust results compared to NMS and may be preferred for use in the clinical setting.Acknowledgements
We would like to thank National Medical Research Council, Singapore for their funding support.References
- Kim EY, Sung YH, Lee J. Nigrosome 1 imaging: technical considerations and clinical applications. Br J Radiol. 2019;92(1101):20180842.
- Pavese N, Tai YF. Nigrosome Imaging and Neuromelanin Sensitive MRI in Diagnostic Evaluation of Parkinsonism. Mov Disord Clin Pract 2018;5(2):131-140.
- Schwarz ST, Afzal M, Morgan PS, et al. The 'swallow tail' appearance of the healthy nigrosome - a new accurate test of Parkinson's disease: a case-control and retrospective cross-sectional MRI study at 3T. PLoS One. 2014;9(4):e93814.
- Nam Y, Gho SM, Kim DH, et al. Imaging of nigrosome 1 in substantia nigra at 3T using multiecho susceptibility map-weighted imaging (SMWI). J Magn Reson Imaging. 2017;46(2):528-536.
- Kim EY, Sung YH, Shin HG, et al. Diagnosis of Early-Stage Idiopathic Parkinson’s Disease Using High-Resolution Quantitative Susceptibility Mapping Combined with Histogram Analysis in the Substantia Nigra at 3 T. J Clin Neurol 2018;14(1):90-97.
- Sung YH, Lee J, Nam Y, et al. Initial diagnostic workup of parkinsonism: Dopamine transporter positron emission tomography versus susceptibility map-weighted imaging at 3T. Parkinsonism Relat Disord. 2019 May;62:171-178.
Figures
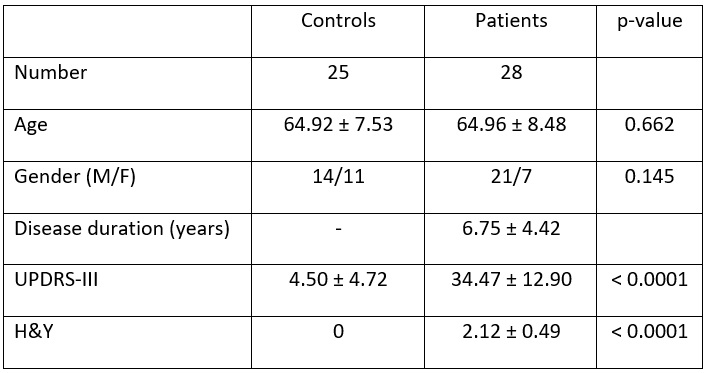
Figure 1. Study subject demographics.
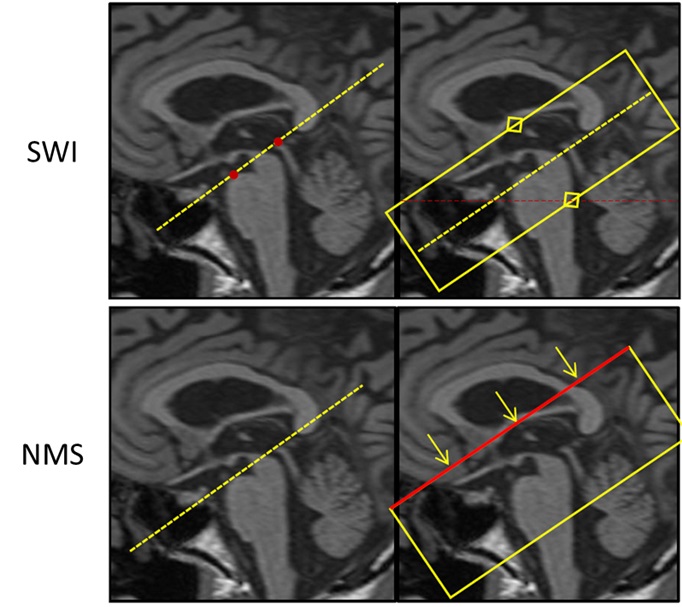
Figure 2. Mid-sagittal MPRAGE images depicting oblique axial scan angulation of SWI & NMS acquisitions parallel to the line joining the posterior commissure to superior border of the pons (red dots) for SWI scan (top row). For the NMS scan (bottom row), imaging plane is copied from the SWI acquisition with the first slice placement identical to the SWI acquisition.
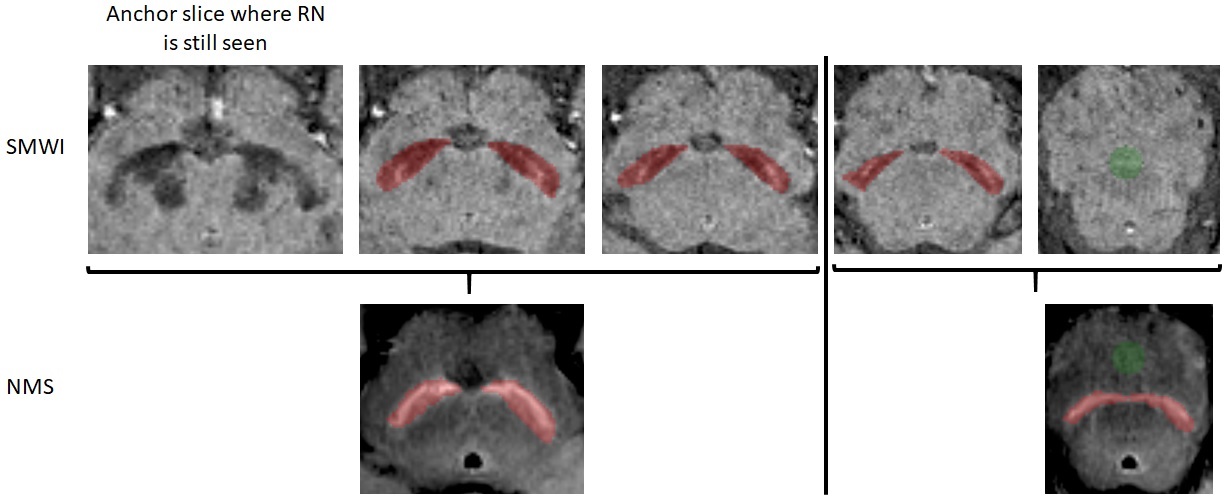
Figure 3. Placement of SN (red) and background (green) masks on SMWI (top, slice thickness 1 mm) and NMS (bottom, slice thickness 3 mm) images.
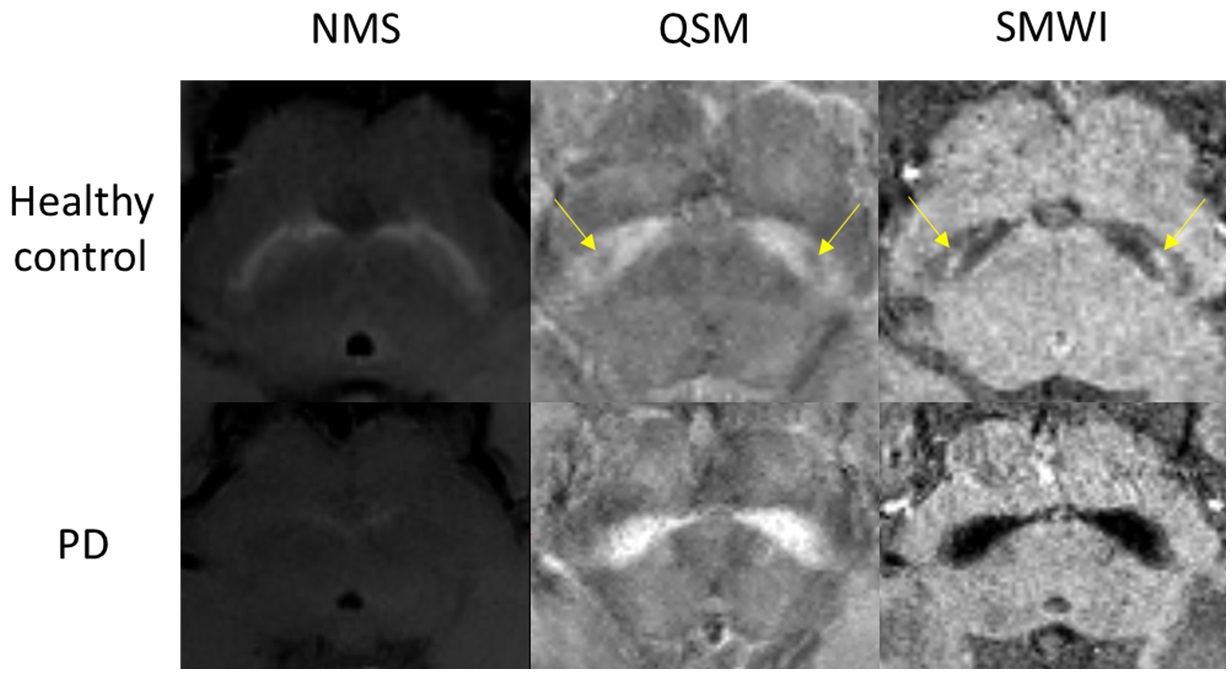
Figure 4.
Representative images of NMS (left), QSM (middle) and SMWI (right) in a healthy control subject (top) and PD patient (bottom). The SN was hypointense on NMS, susceptibility increased on QSM and hypointense on SMWI in PD patient. Nigrosome-1 (yellow arrow) was clearly seen in healthy subject in QSM/SMWI images but was lost in PD patient.
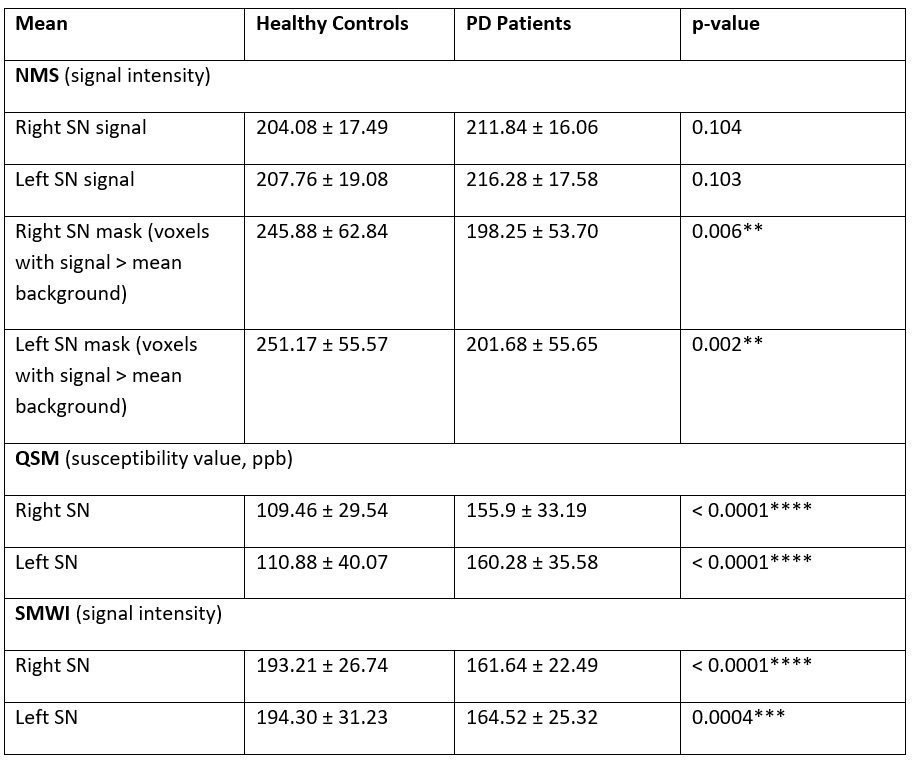
Figure 5.
Comparison of SN
metrics on NMS, QSM and SMWI images between healthy controls and PD patients.
**) p < 0.01, ***) p < 0.001, ****) p < 0.0001.