1509
Comparison of T1/T2 values of white matter and deep gray matter between healthy controls and Parkinson’s disease patients using plug-and-play MRF1Human Brain Research Center, Graduate School of Medicine, Kyoto University, Kyoto, Japan, 2Center for Advanced Imaging Innovation and Research (CAI2R) and Bernard and Irene Schwartz Center for Biomedical Imaging, Department of Radiology, New York University School of Medicine, New York, NY, United States, 3Department of Neurology, Kyoto University Graduate School of Medicine, Kyoto University, Kyoto, Japan, 4Department of Human Health Sciences, Kyoto University Graduate School of Medicine, Kyoto University, Kyoto, Japan, 5Department of Neuroscience, Kyoto University Graduate School of Medicine, Kyoto University, Kyoto, Japan
Synopsis
To investigate changes in T1 and T2 of deep gray matter in Parkinson’s disease (PD) patients at 7T, healthy volunteers (N=104, age range 20-77) and PD patients (N=42, age range 50-72) were scanned using a 1ch-Tx/32ch-Rx coil and a Plug-and-Play MR Fingeprinting (prototype) sequence. ROIs were drawn in six regions (left and right putamen, globus pallidus, caudate head, thalamus, frontal white matter (WM)) and a linear and quadratic curve fitting was performed. T2 value of the putamen was larger in PD than the age-matched subgroup of HC, but was not significant.
Introduction
MR Fingerprinting is one of the recently introduced techniques for efficient measurement of tissue T1 and T2 values (1). Higher SNR with ultra-high-field MR imaging could achieve faster imaging with better precision. However, reduced RF wavelength creates unwanted interference within the object to scan (2). By including B1+ into a dictionary to be matched with the acquired signal, Plug-and-Play MR Fingerprinting (PnP-MRF) could successfully overcome this issue of B1+ inhomogeneity at 7T(3)(4). With this method, changes in the T1/T2 values of the white matter and deep gray matter nucleus over the age was shown (5). Parkinson’s disease (PD) is one of the most prevalent neurological diseases in the aged population. A gradual loss of dopaminergic neurons in the Substantia Nigra (SN) results in various symptoms such as resting tremor, akinesia, muscular rigidity, and postural instability. Dopaminergic neurons from the SNpc to the striatum plays an important role in motor control. Administration of L-dopa could reduce the symptoms, but gradually it becomes less effective. A previous study has shown decreased T2’ (increased R2’) in SN (6). It is also reported with postmortem brain that iron deposition is increased in the SN in PD (7). However, there are controversial results for other brain regions (8). To investigate this issue, we compared T1 and T2 values of the white matter and deep gray matter between healthy controls and Parkinson’s disease patients using 2D PnP-MRF.Methods: Sequence design
The PnP-MRF sequence consists of segments of FISP and FLASH with variable flip angles. The FLASH segments encode B1+ and T1, and the FISP segments additionally encode the T2 relaxation component. In addition to the original PnP-MRF paper (3), non-selective adiabatic inversion pulse was applied at the start. The original PnP-MRF was designed for a parallel Tx system and used two “modes” of transmission. The sequence was customized to use only one (CP) mode for RF excitation. A constant TR and 2D radial readout with an increment of golden angle were used (9).Methods: Experiments
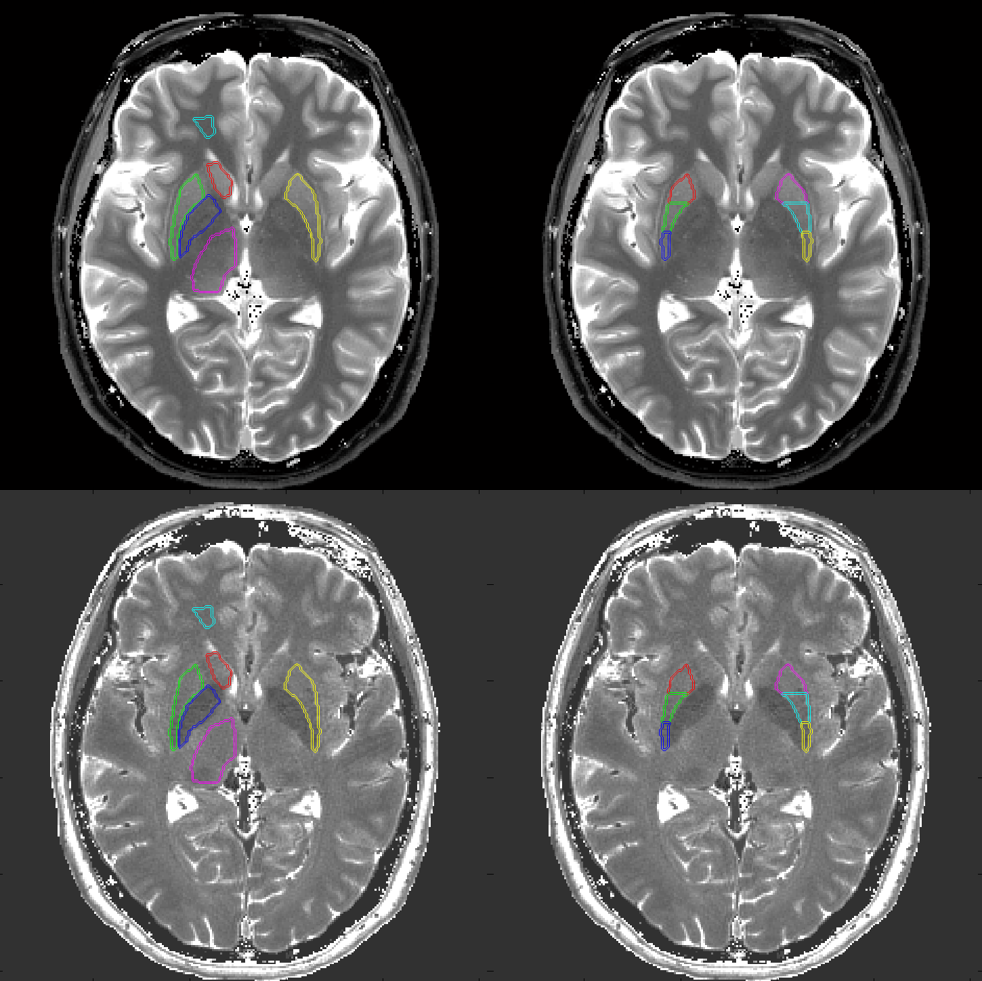
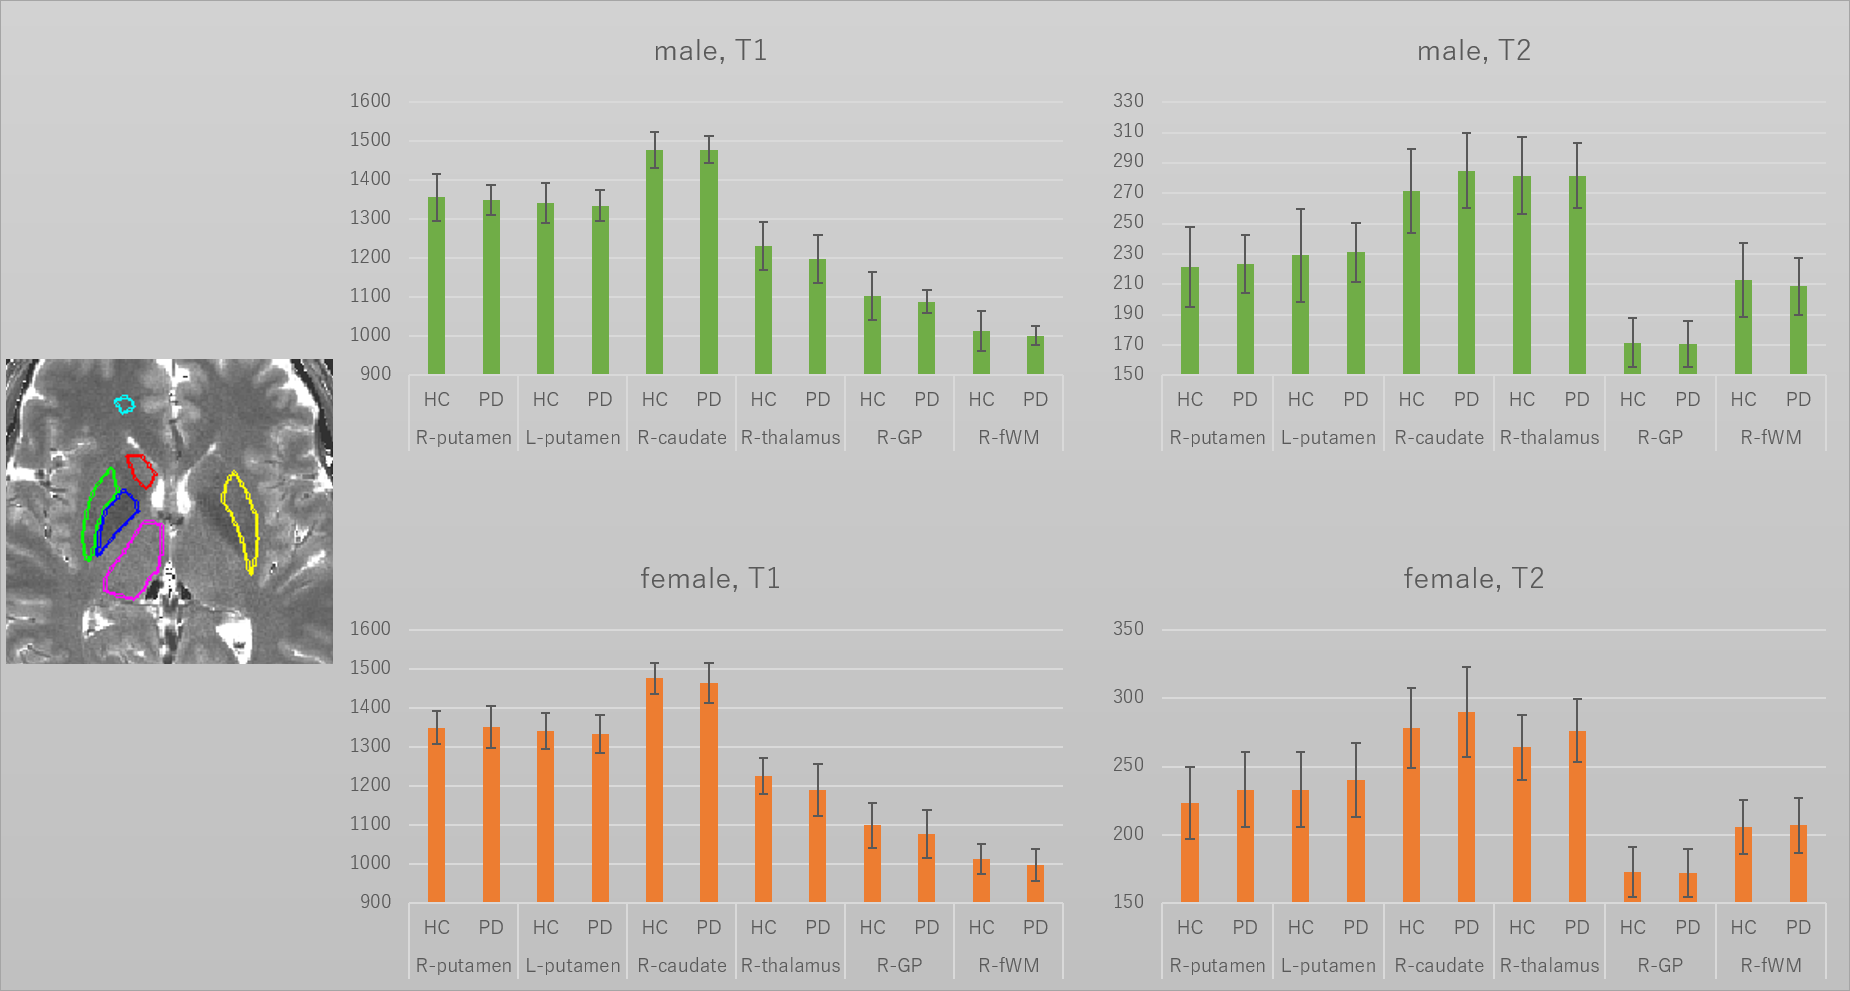
All experiments were performed on an investigational whole-body 7T scanner (MAGNETOM 7T, Siemens Healthineers, Erlangen, Germany) equipped with body gradients and a 1ch Tx, 32ch Rx coil (Nova Medical, Wilmington, MA). The sequence parameters were determined as follows based on the previous study (4). FOV=192, matrix=256x256, slice thickness=3mm, voxel size=0.75x0.75x3mm, FA=80, BW=480[Hz/pixel], TR=7.0ms, TE=3.1ms, Number of shots=7. The acquisition time for four slices was 3 minutes 36 seconds. Under the approval of IRB, 42 Parkinson’s disease (PD) patients (15 male, age-range 50-72; 27 female, age range 51-76) and 104 healthy controls (HC) (52 male, age-range 20-77; 52 female, age range 21-76) were recruited. After anatomical scans, four slices of PnP-MRF were obtained. By referring to the T1-weighted anatomical scan, slice location for PnP-MRF was manually determined to include substantia nigra, red nucleus, putamen, globus pallidus, and caudate head. A representative T1 map and T2 map was shown in Figure 1.Methods: Post-processing
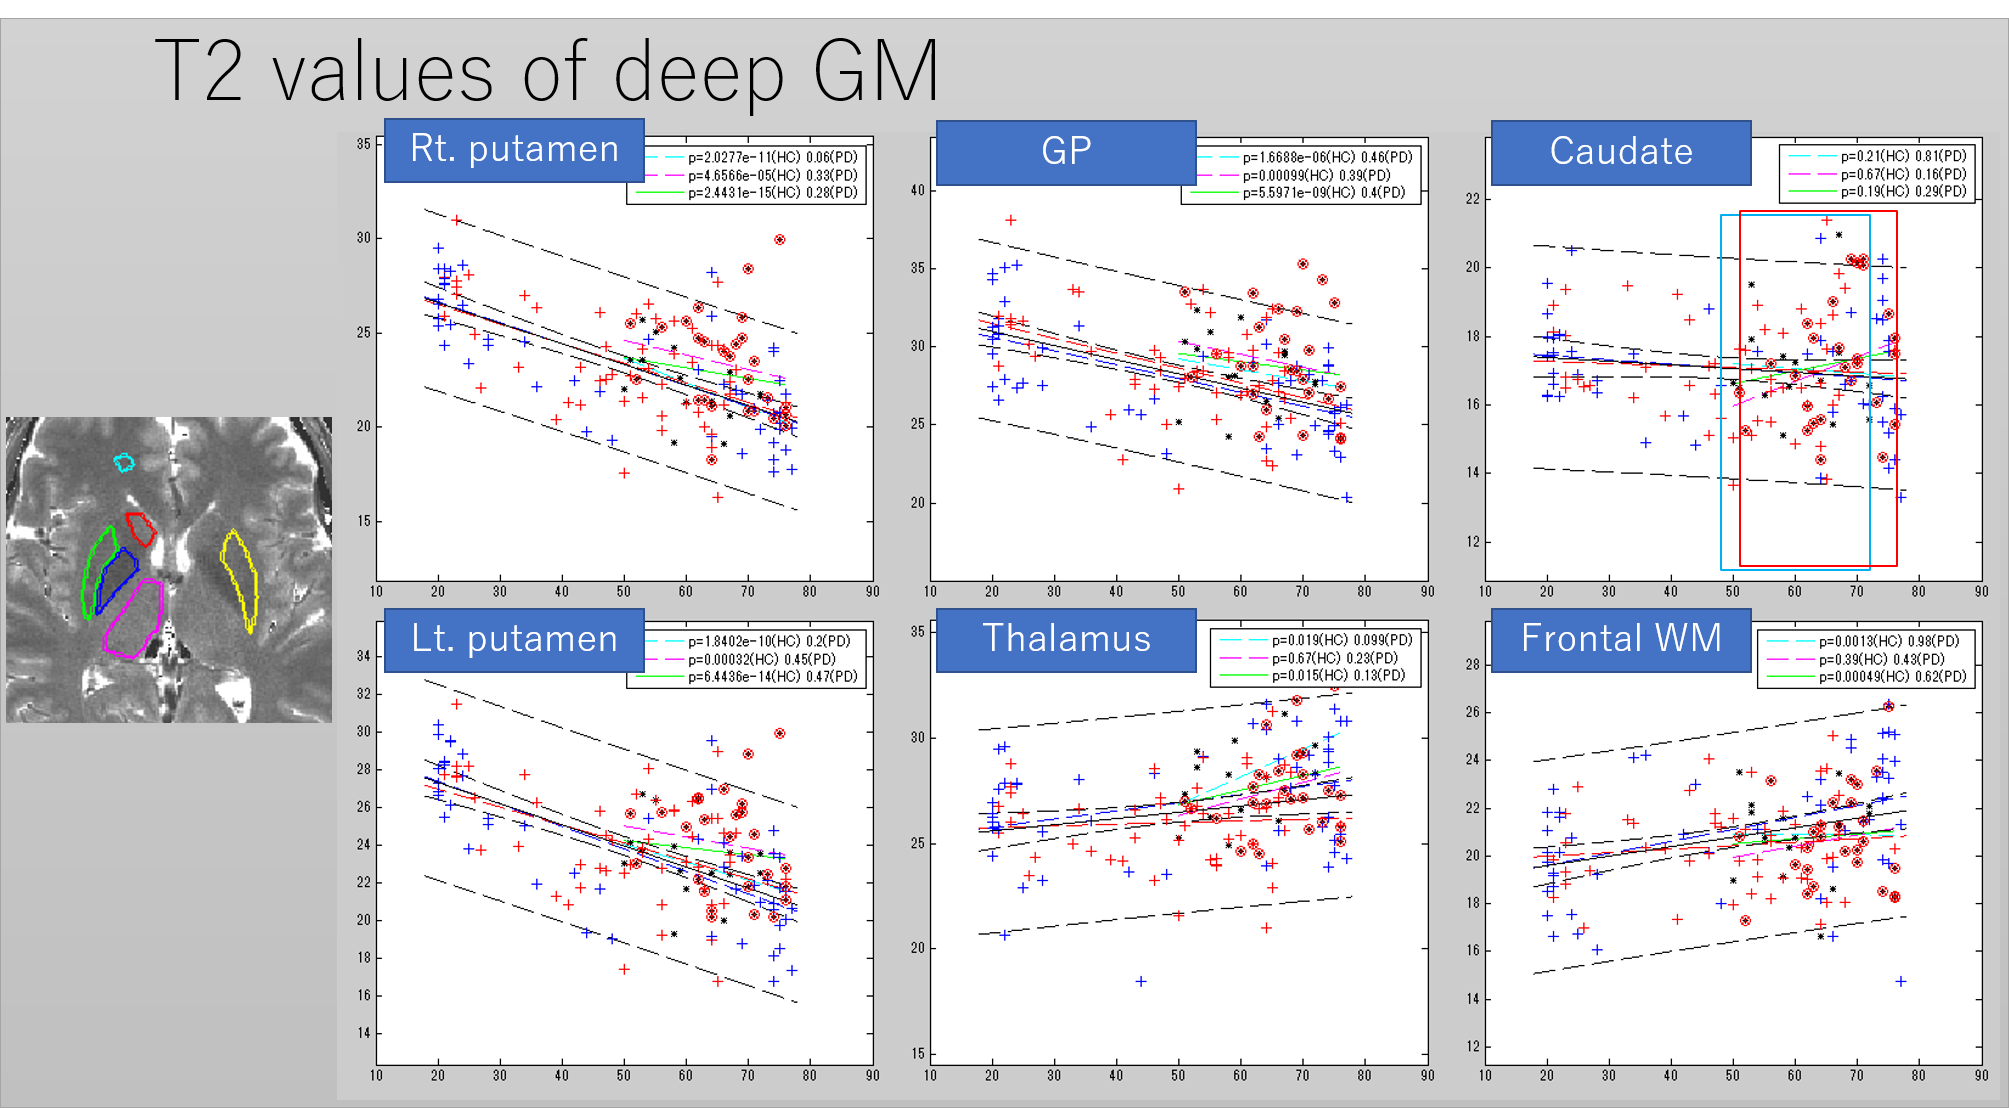
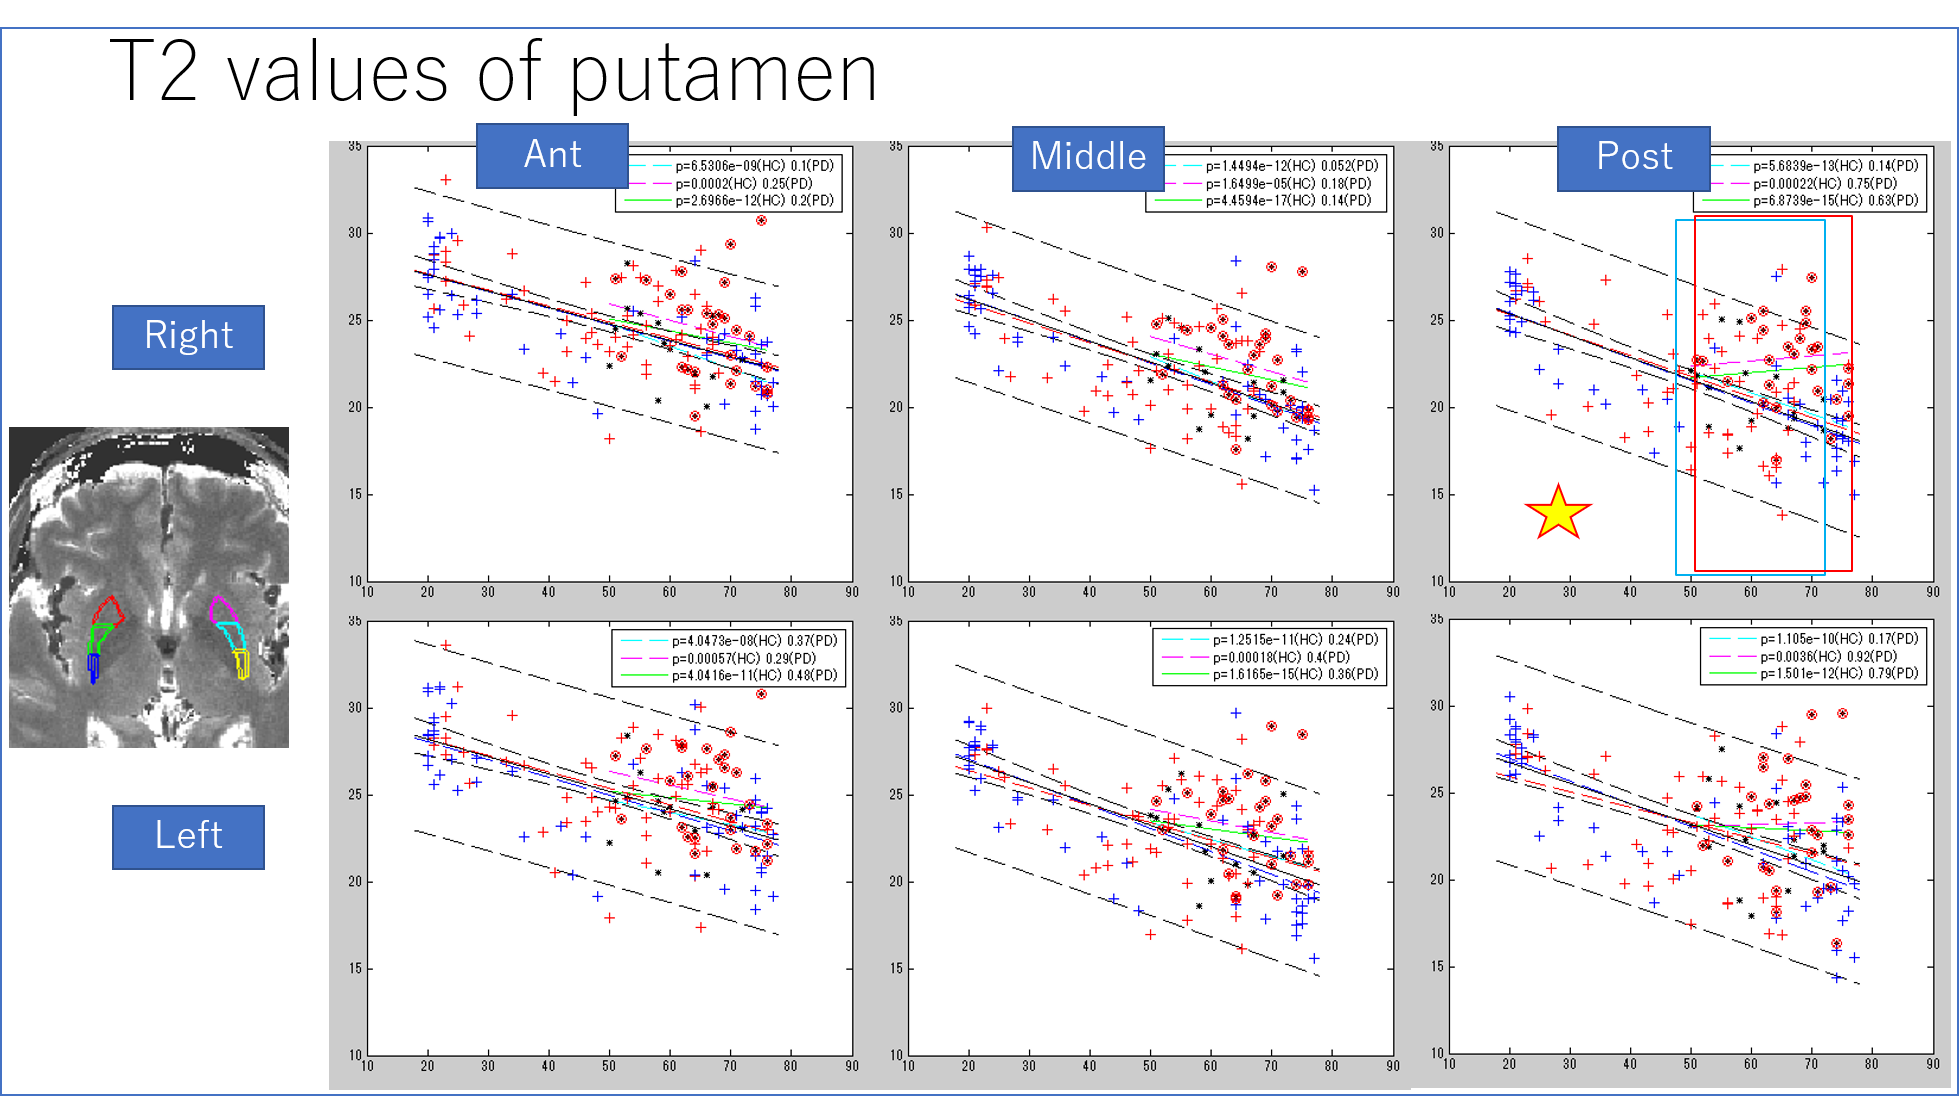
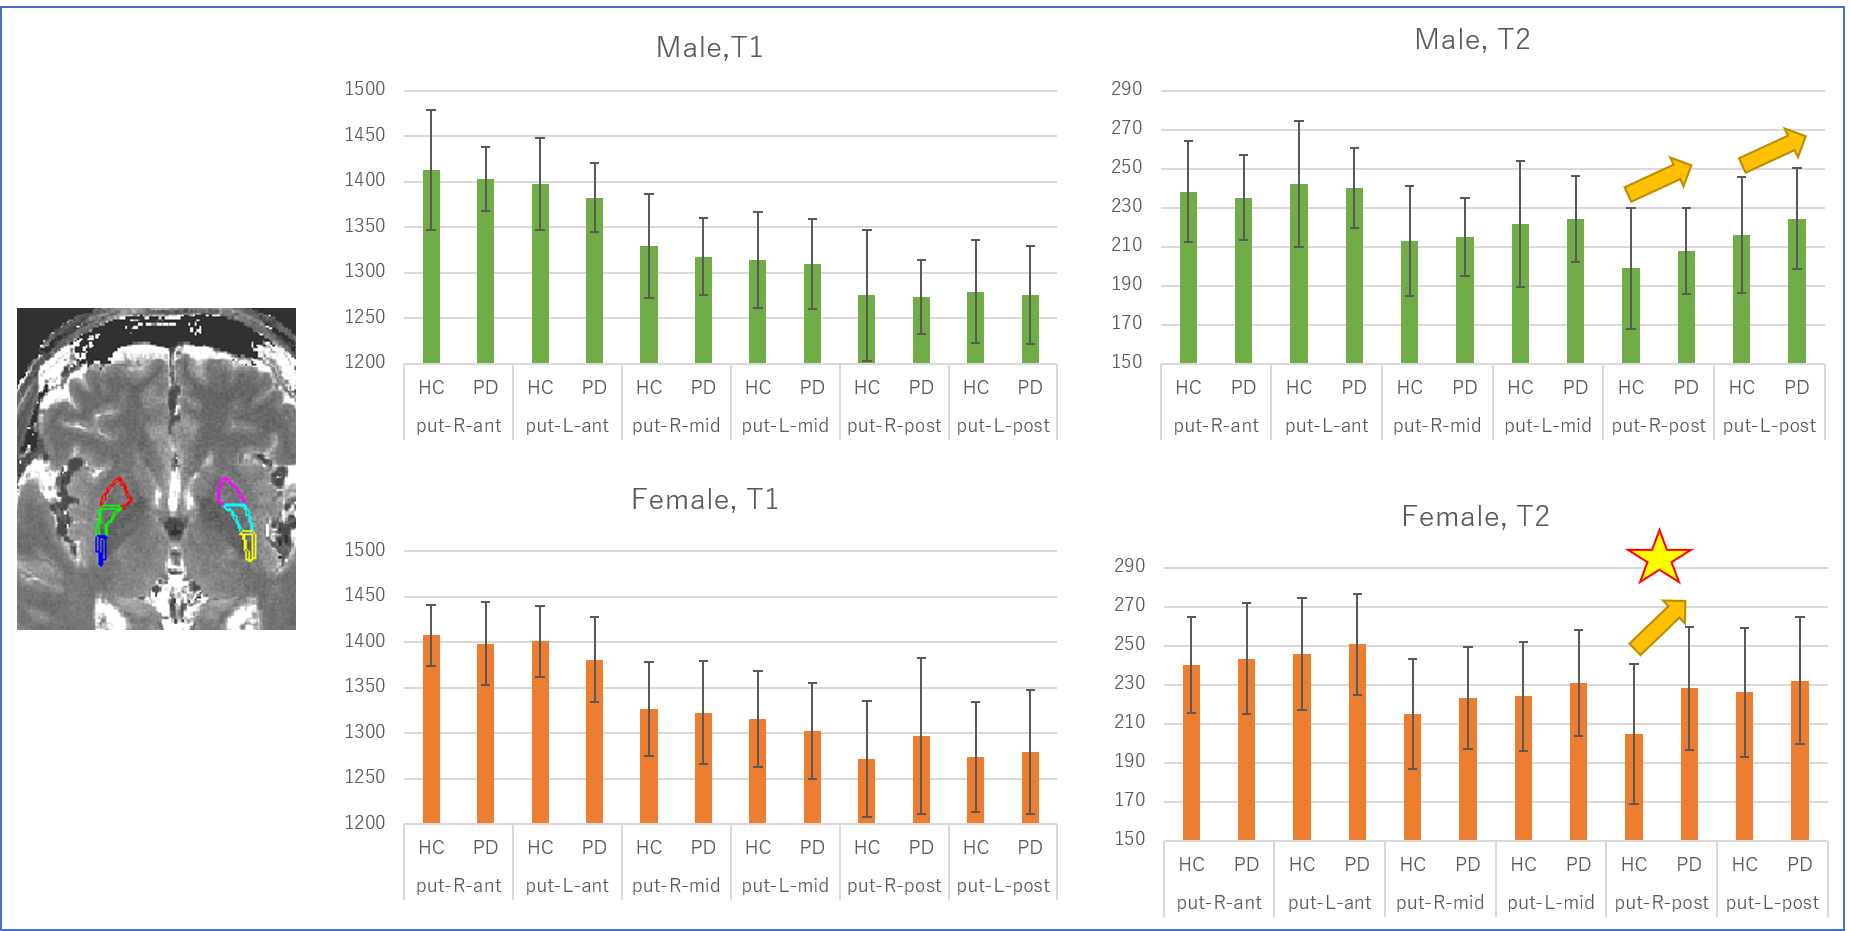
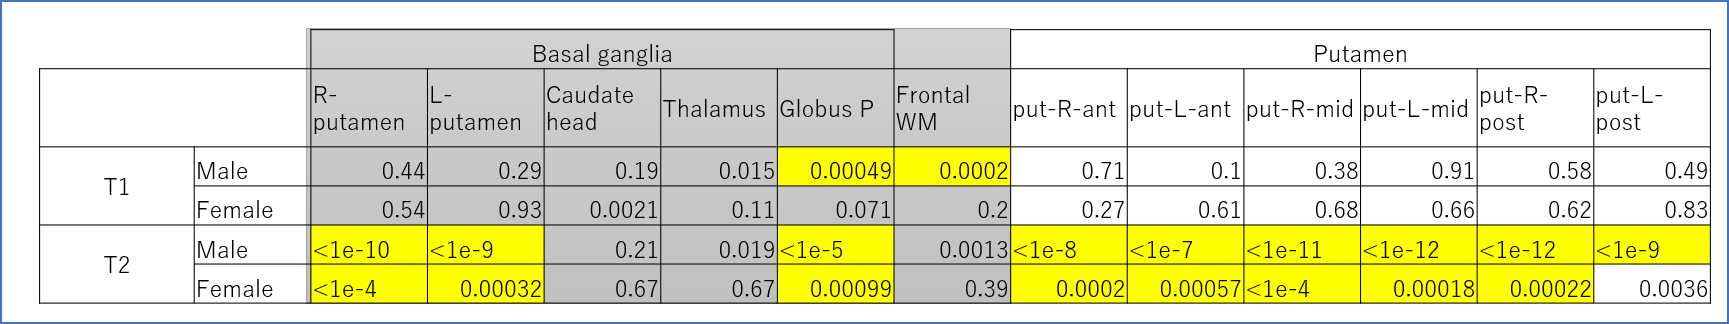
Images were reconstructed with in-house Matlab (MathWorks, Natick, MA, USA) scripts. Prior to the dictionary matching, data compression with SVD was used to reduce computational time without reducing matching accuracy (10). ROIs were manually drawn on the frontal white matter and the deep gray matters of the brain. ROI in the left and right putamen was divided into three areas (i.e. anterior/middle/posterior). As a first step, the mean value in each ROI in HC was regressed with age (Figure 2,3). As a second step, the mean value in each ROI in PD was compared with the age-matched sub-population in HC (34 in total; 14 male, age-range 48-73; 20 female, age range 51-76). A Student’s t-test was performed to check the presence of a significant difference.Results
The T2 value of the putamen showed significant decrease with age (Figures 2-3). Other results for age-related change are summarized in table 1. Middle and posterior part of the putamen in PD showed higher T2 values in both men and women compared with HC (Figures 4-5). The smallest p-value was seen in the female population (p=0.025, posterior part in the right putamen), but the p-value did not reach a significant level after the Bonferroni correction.rroni correction.Discussion
There was a trend for higher T2 value in PD in the putamen than the HC. This was concordant with the report in (8). On the other hand, a recent study using QSM suggests increased R2* in the putamen (11) in PD or no significant difference (12) between PD and HC. One of the possible explanations might be an increased interstitial space due to degeneration in the putamen. Limitation includes (1) no whole-brain coverage, (2) manual ROI (3) age distribution was not even (smaller number of middle-aged male data).Conclusion
Based on the data using PnP-MRF, T2 value of the putamen in HC decreased significantly over the age. T2 values of the middle or caudal putamen were higher in PD than HC on average, but the differences were not significant.Acknowledgements
A research grant of Siemens Healthcare K.K.References
1. Ma, D.; Gulani, V.; Seiberlich, N.; Liu, K.; Sunshine, J. L.; Duerk, J. L.; Griswold, M. A., Magnetic resonance fingerprinting. Nature 2013, 495 (7440), 187-92.
2. Vaughan, J. T.; Garwood, M.; Collins, C. M.; Liu, W.; DelaBarre, L.; Adriany, G.; Andersen, P.; Merkle, H.; Goebel, R.; Smith, M. B.; Ugurbil, K., 7T vs. 4T: RF power, homogeneity, and signal-to-noise comparison in head images. Magn Reson Med 2001, 46 (1), 24-30.
3. Cloos, M. A.; Knoll, F.; Zhao, T.; Block, K. T.; Bruno, M.; Wiggins, G. C.; Sodickson, D. K., Multiparametric imaging with heterogeneous radiofrequency fields. Nat Commun 2016, 7, 12445.
4. Akasaka, T.; Fujimoto, K.; Cloos, M. A.; Okada, T. In In Vivo Evaluation of MR Fingerprinting at 7T, Proc Int Soc Magn Reson Med. 2018, 3293, Paris, Paris, 2018.
5. Fujimoto, K.; Cloos, M. A.; Shima, A.; Thuy, D. H. D.; Sawamoto, N.; Takahashi , R.; Isa, T.; Okada, T. In Age-related changes in tissue T1, T2 values of the human brain quantified by 2D PnP-MRF at 7T MRI, Proc Int Soc Magn Reson Med. 2019, 2810, Montreal, Montreal, 2019.
6. Wallis, L. I.; Paley, M. N.; Graham, J. M.; Grünewald, R. A.; Wignall, E. L.; Joy, H. M.; Griffiths, P. D., MRI assessment of basal ganglia iron deposition in Parkinson's disease. J Magn Reson Imaging 2008, 28 (5), 1061-7.
7. Dexter, D. T.; Wells, F. R.; Agid, F.; Agid, Y.; Lees, A. J.; Jenner, P.; Marsden, C. D., Increased nigral iron content in postmortem parkinsonian brain. Lancet 1987, 2 (8569), 1219-20.
8. Graham, J. M.; Paley, M. N.; Grünewald, R. A.; Hoggard, N.; Griffiths, P. D., Brain iron deposition in Parkinson's disease imaged using the PRIME magnetic resonance sequence. Brain 2000, 123 Pt 12, 2423-31.
9. Winkelmann, S.; Schaeffter, T.; Koehler, T.; Eggers, H.; Doessel, O., An optimal radial profile order based on the Golden Ratio for time-resolved MRI. IEEE Trans Med Imaging 2007, 26 (1), 68-76.
10. McGivney, D. F.; Pierre, E.; Ma, D.; Jiang, Y.; Saybasili, H.; Gulani, V.; Griswold, M. A., SVD compression for magnetic resonance fingerprinting in the time domain. IEEE Trans Med Imaging 2014, 33 (12), 2311-22.
11. Langkammer, C.; Pirpamer, L.; Seiler, S.; Deistung, A.; Schweser, F.; Franthal, S.; Homayoon, N.; Katschnig-Winter, P.; Koegl-Wallner, M.; Pendl, T.; Stoegerer, E. M.; Wenzel, K.; Fazekas, F.; Ropele, S.; Reichenbach, J. R.; Schmidt, R.; Schwingenschuh, P., Quantitative Susceptibility Mapping in Parkinson's Disease. PLoS One 2016, 11 (9), e0162460.
12. Shahmaei, V.; Faeghi, F.; Mohammdbeigi, A.; Hashemi, H.; Ashrafi, F., Evaluation of iron deposition in brain basal ganglia of patients with Parkinson's disease using quantitative susceptibility mapping. Eur J Radiol Open 2019, 6, 169-174.
Figures