1508
Characterisation of white matter integrity and functional connectivity in ApoE4 and ApoE3 mice
Jiayi Zhang1, Ling Yun Yeow1, Joanne Huifen Koh2, Isaac Huen1, Pei Huang1, Tuck Wah Soong2, Boon Seng Wong2,3, Kuan Jin Lee1, and Bhanu Prakash KN1
1SBIC, A*STAR, Singapore, Singapore, 2Department of Physiology, National University of Singapore, Singapore, Singapore, 3Health and Social Sciences Cluster, Singapore Institute of Technology, Singapore, Singapore
1SBIC, A*STAR, Singapore, Singapore, 2Department of Physiology, National University of Singapore, Singapore, Singapore, 3Health and Social Sciences Cluster, Singapore Institute of Technology, Singapore, Singapore
Synopsis
Cholesterol-transporter ApoE4 is involved in lipid metabolism and is associated with neurodegenerative diseases. Studies show, functional connectivity(FC) in ApoE4 mice is significantly deviating from ApoE3 and Wild-Type(WT). Underlining cause of these differences are less explored. Since myelin is mostly comprised of cholesterol, we investigated if a change in white matter integrity(WMI) could have contributed to the FC changes. FC and WMI in ApoE4 are distinctively different from ApoE3 and WT as shown by our results. Our results within the auditory cortex show that an increase in FA in ApoE4 is associated with a decrease of FC in the region.
Introduction
Cholesterol-transporter apolipoprotein isoform ε4(ApoeE4) is involved in the regulation of lipid metabolism[1] and is associated with developing neurodegenerative diseases such as Alzheimer’s[2]. It has been found that functional connectivity(FC) and white matter integrity (WMI) in ApoE4 carriers significantly differ from apolipoprotein isoform ε3(ApoE3) carriers and Wild-Type(WT)[3]. However, the underlining cause of these differences are less explored. In the following abstract, we first characterise the FC and WMI differences between ApoE4 and ApoE3 and WT, and since myelin is mostly comprised of cholesterol, we investigated if a change WMI could have contributed to the FC changes with resting-state fMRI(rs-fMRI), and diffusion tensor imaging(DTI).Methods
MRI measurements were performed on an 11.7 BioSpec with CryoProbe. During MR experiments, animals were medically ventilated at 80 breaths per minute, with low-dose isoflurane (0.5%), and continuous infusion of medetomidine. Before DTI and fMRI acquisition, local field homogeneity was optimised in the area of interest using field maps acquired previously. BOLD fMRI was acquired with single shot gradient-echo echo-planar imaging (SSGE-EPI) sequence: flip angle = 90°, TR=1000ms, TE=11.7ms, FOV 19 x 9 mm2 , matrix size 60 x 30 mm2 , slice thickness=0.45mm number of slice=21,NA =1, total acquisition time 16minutes 40s. Diffusion was acquired with 5 shot Spin echo diffusion EPI (SE-EPI) sequence with 46 directions and 2 b values (600, 1350) : TR=2000ms, TE=20.6ms, FOV 17 x 9 mm2 , matrix size 111 x 50 mm2, slice thickness=0.45mm number of slice=21, NA =1, and total acquisition time 16minutes 10s. FC was estimated[4] based on partial correlations between 18 resting state networks[5] WMI was estimated based on fractional anisotropy(FA) and mean diffusivity(MD) values, calculated by weighted least squares tensor fitting[6].2x3 MANOVA analysis of age, genotype, and their interaction effect was carried out on FC and WMI indices. 2 sample t-tests were carried out as post-hoc analysis on averaged values across significant regions present in the MANOVA for different indices. P-values are thresholded at 0.05, and corrected for networks and voxels but not for the number of hypotheses. For the distribution of animal population see Figure. 1.
Results
Characterisation of FC(See Figure. 2). MANOVA showed overall significant effect of genotype of FC, while the age and interaction effect was non-significant. FC8-5 between Node 8(auditory cortex) and Node 5(limbic cortex) was significantly different across genotypes while FC17-6 between Node 17(Thalamus) and Node 6(Barrel field cortex) was close to significance. FC8-5 and FC17-6 in ApoE4 were significantly lower as compared to ApoE3 and WT as revealed by post-hoc test. FC of ApoE3 and WT were not significantly different between any nodes.Characterisation of WMI(See Figure. 3). Significant clusters across the brain were found for age and genotype effects in FA values while none were found for the interactions effect. Specifically, mean FA values in these regions were lower at 6 as compared to 12 and 18 months and higher within ApoE4 as compared to ApoE3 and WT. Significant clusters across the brain were found for age effects in MD values while none were found for the genotype and interactions effect. Mean MD of these clusters were significantly higher at 6 as compared to 12 and 18 months.
WMI in regions of abnormal FC(See Figure. 4). Mean FA and MD values within the auditory cortex(C8) was significantly higher than the limbic cortex(C5) across all genotypes. Looking at FC8-5 as a whole, mean FA of ApoE4 were higher as compared to ApoE3 and WT, while no significant difference exists between ApoE3 and WT. Average MD values in FC8-5 were higher in ApoE4 as compared to ApoE3, and WT showed no significant difference as compared to ApoE4 and ApoE3. Mean FA and MD values within the thalamus(C17) were significantly higher than the barrel field cortex(C6) across all genotypes. Looking at FC17-6 as a whole, mean MD shows no differences across genotype, while mean FA of ApoE4 were higher as compared to ApoE3 and WT showed no significant difference as compared to ApoE4 and ApoE3.
Discussion
FC and WMI in ApoE4 were distinctively different from ApoE3 and WT across the brain as shown by our results. Similar to our study, prior results have shown higher WMI indices and lower FC in carriers of ApoE4[7] separately, but not at the relationship of WMI changes in regions of abnormal FC with connectivity in ApoE4. Combining our results from DTI and rs-fMRI within the auditory cortex, an increase in FA in ApoE4 is associated with a decrease of FC in the region. We intend to further pursue this by analysing the DTI datasets via probabilistic fibre tracking to further probe the association between WMI changes and FC in ApoE4 carriers.Acknowledgements
This research is a collaboration between Agency for Science, Technology and Research(A*STAR), and National University of Singapore(NUS)References
[1] Weisgraber KH, Mahley RW (1996) Human apolipoprotein E: the Alzheimer’s disease connection. Faseb J 10:1485-1494. [2] Corder EH, Saunders AM, Strittmatter WJ, Schmechel DE, Gaskell PC, Small GW, Roses AD, Haines JL, Perical-Vance MA (1993) Gene dose of apolipoprotein E type 4 allele and the risk of Alzheimer’s disease in late onset families. Science 261:921-923. [3] Trachtenberg AJ, Filippini N, Mackay CE (2012) The effects of APOE-epsilon4 on the BOLD response. Neurobiol Aging 33:323–334, doi:10.1016/j.neurobiolaging.2010.03.009, pmid:20409610. [4] FSLNets v0.3; www.fmrib.ox.ac.uk/fsl [5] V Zerbi, J Grandjean, M Rudin, N Wenderoth (2015) Mapping the mouse brain with rs-fMRI: an optimized pipeline for functional network identification. Neuroimage 123, 11-21 [6] P. J. Basser, et al., J Magn Reson B, vol. 103, pp. 247-54, Mar 1994. [7] Valerio Zerbi, Maximilian Wiesmann, Tim L. Emmerzaal, Diane Jansen, Maarten Van Beek, Martina P.C. Mutsaers, Christian F. Beckmann, Arend Heerschap, Amanda J. Kiliaan (2014) Resting-State Functional Connectivity Changes in Aging apoE4 and apoE-KO Mice. Journal of Neuroscience 34 (42) 13963-13975; DOI: 10.1523/JNEUROSCI.0684-14.2014Figures
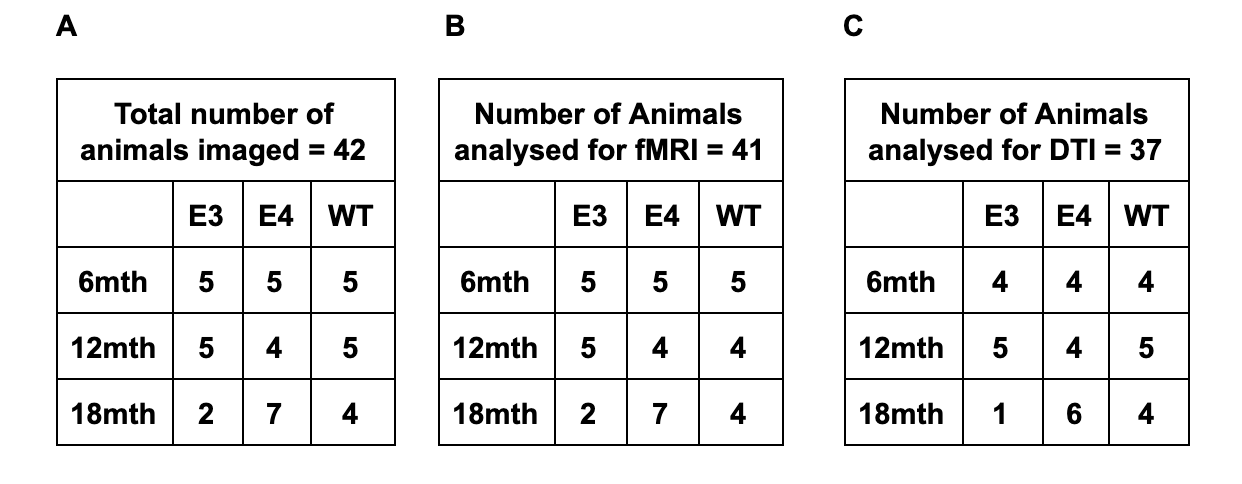
Figure 1. Experimental groups
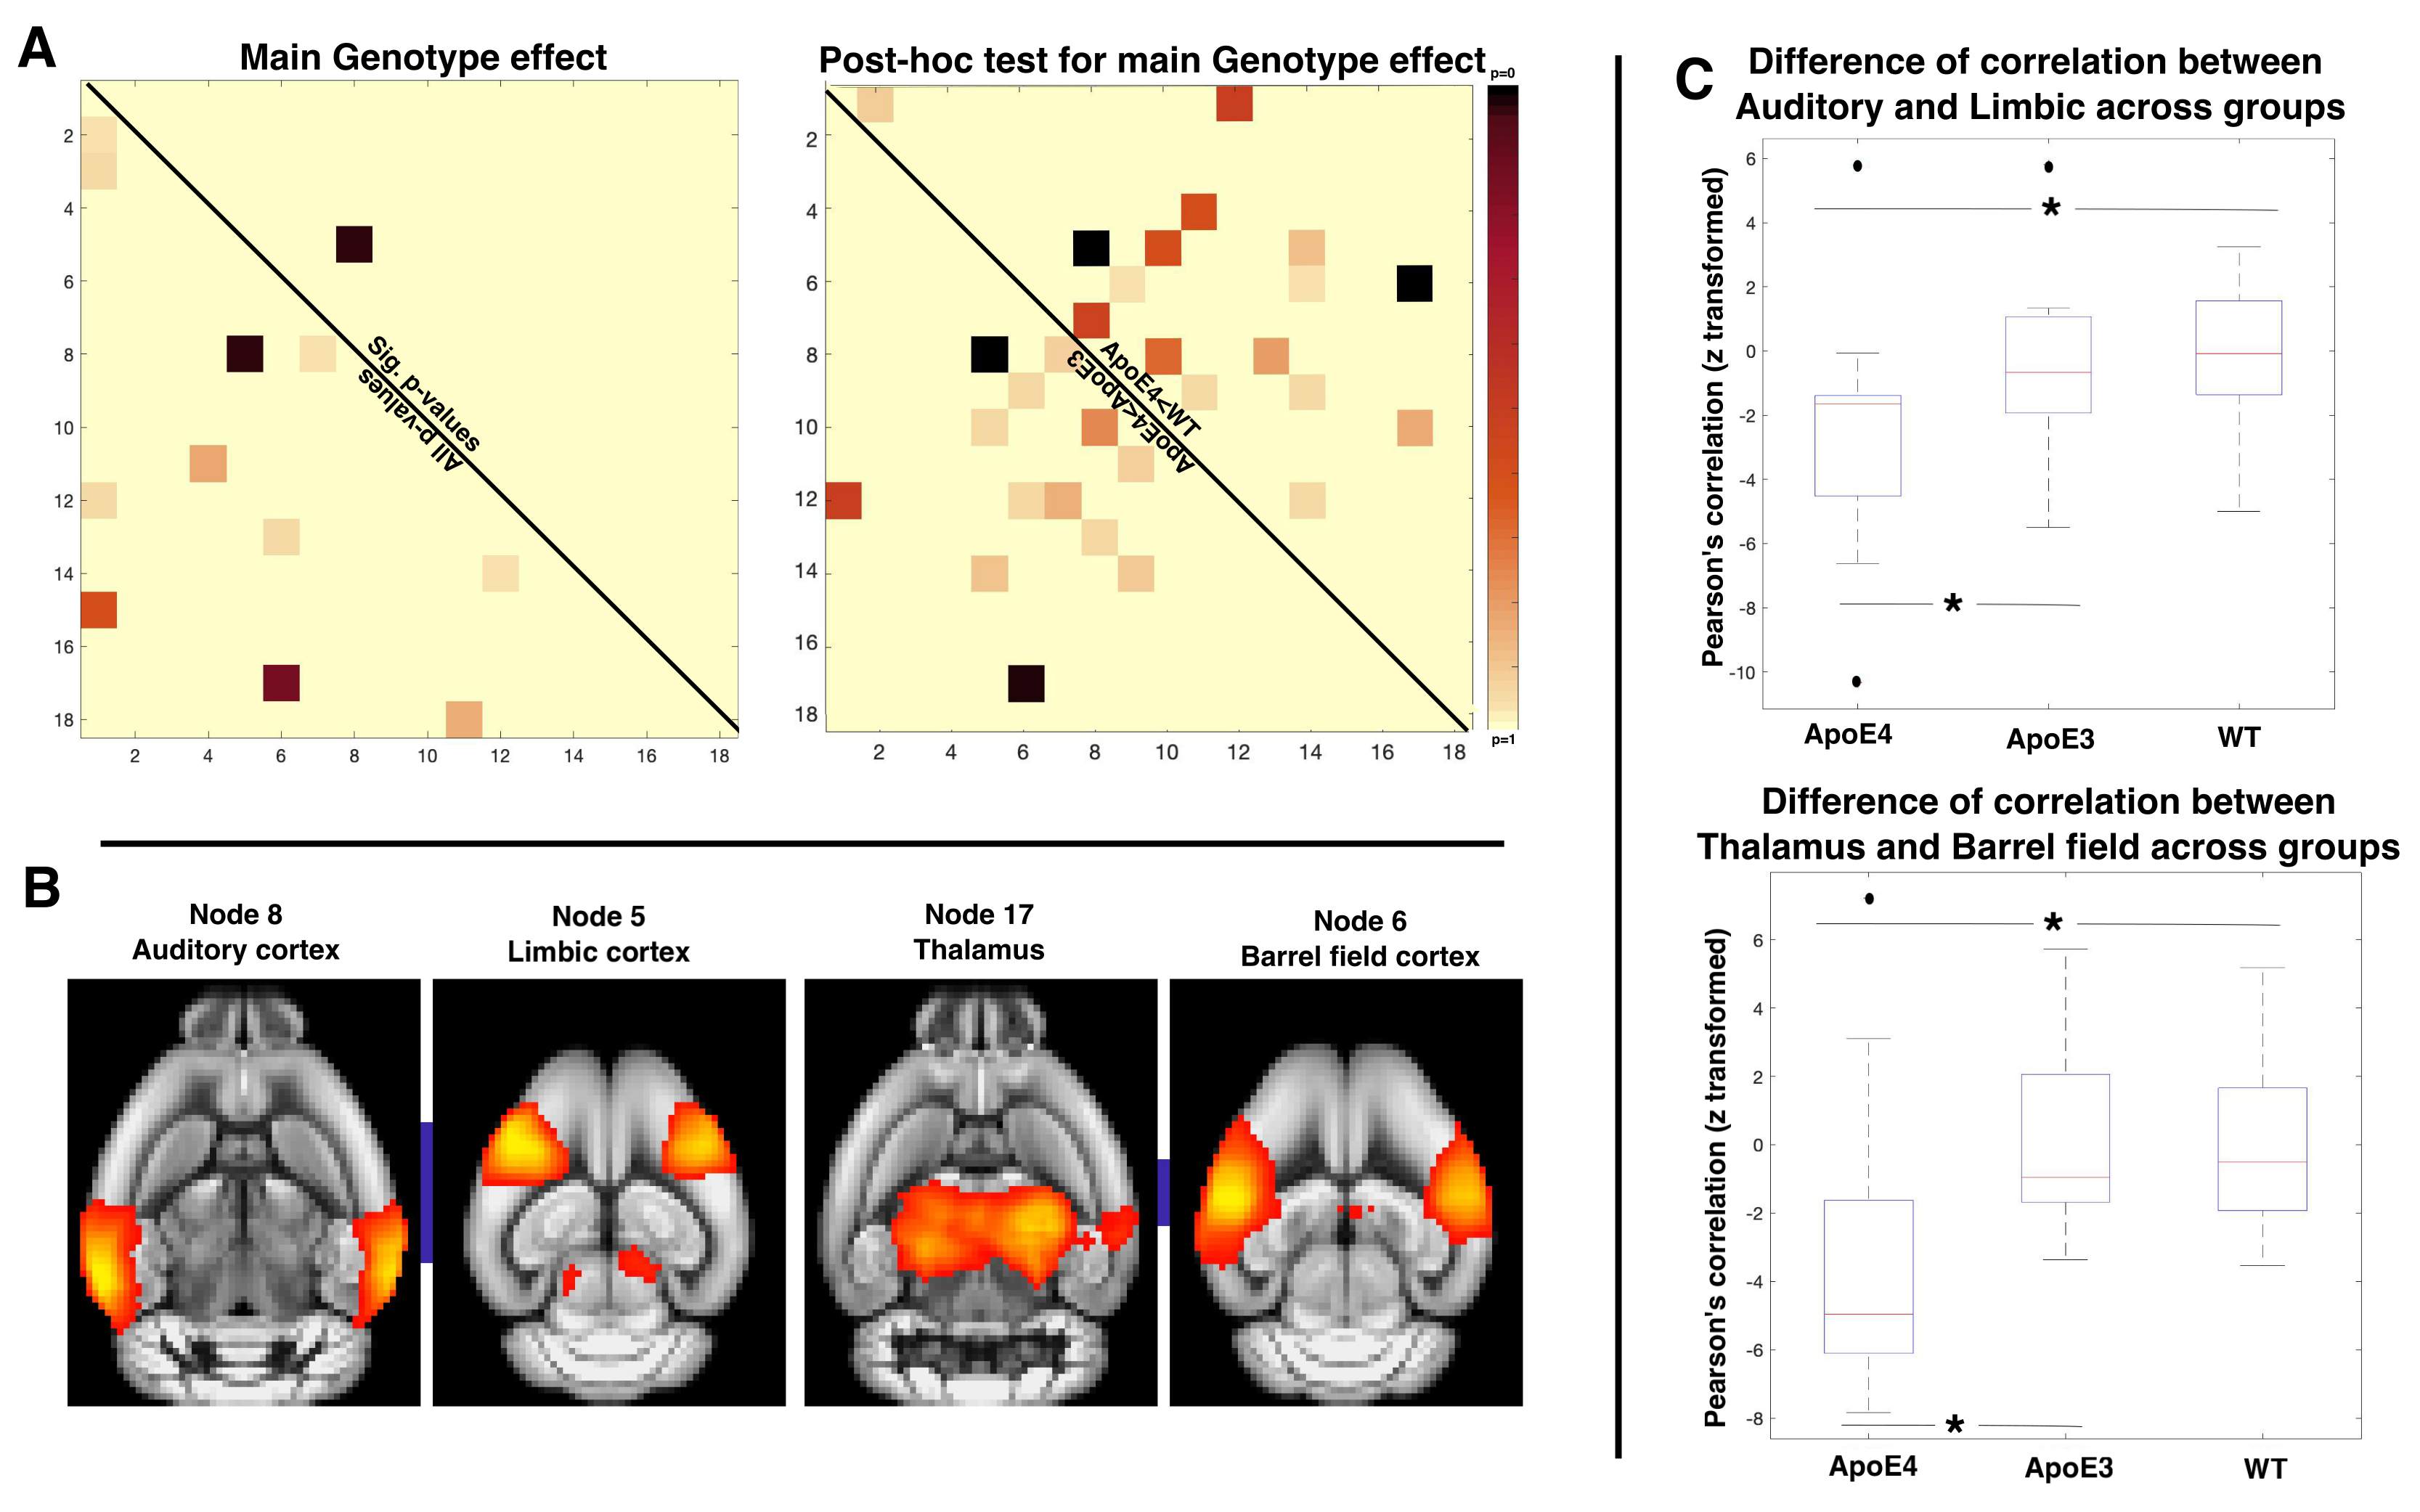
Figure 2. Characterisation of FC. Only effect of genotype was significant. A-left, P-values for all FC(bottom) and those significant across genotype(top). FC8-5 across Node 8 and 5 was significant while FC17-6 across Node 17 and 6 was close to significance. A-right, FC8-5 and FC17-6 in ApoE4 were significantly lower compared to ApoE3(bottom) and WT(top). FC of ApoE3 and WT were not significantly different. B, Locations of FC8-5 and FC17-6. C, Graphical comparison of correlation values of FC8-5(top) and FC17-6(bottom). Both FCs are anti-correlated, FC8-5 is stronger than FC17-6.
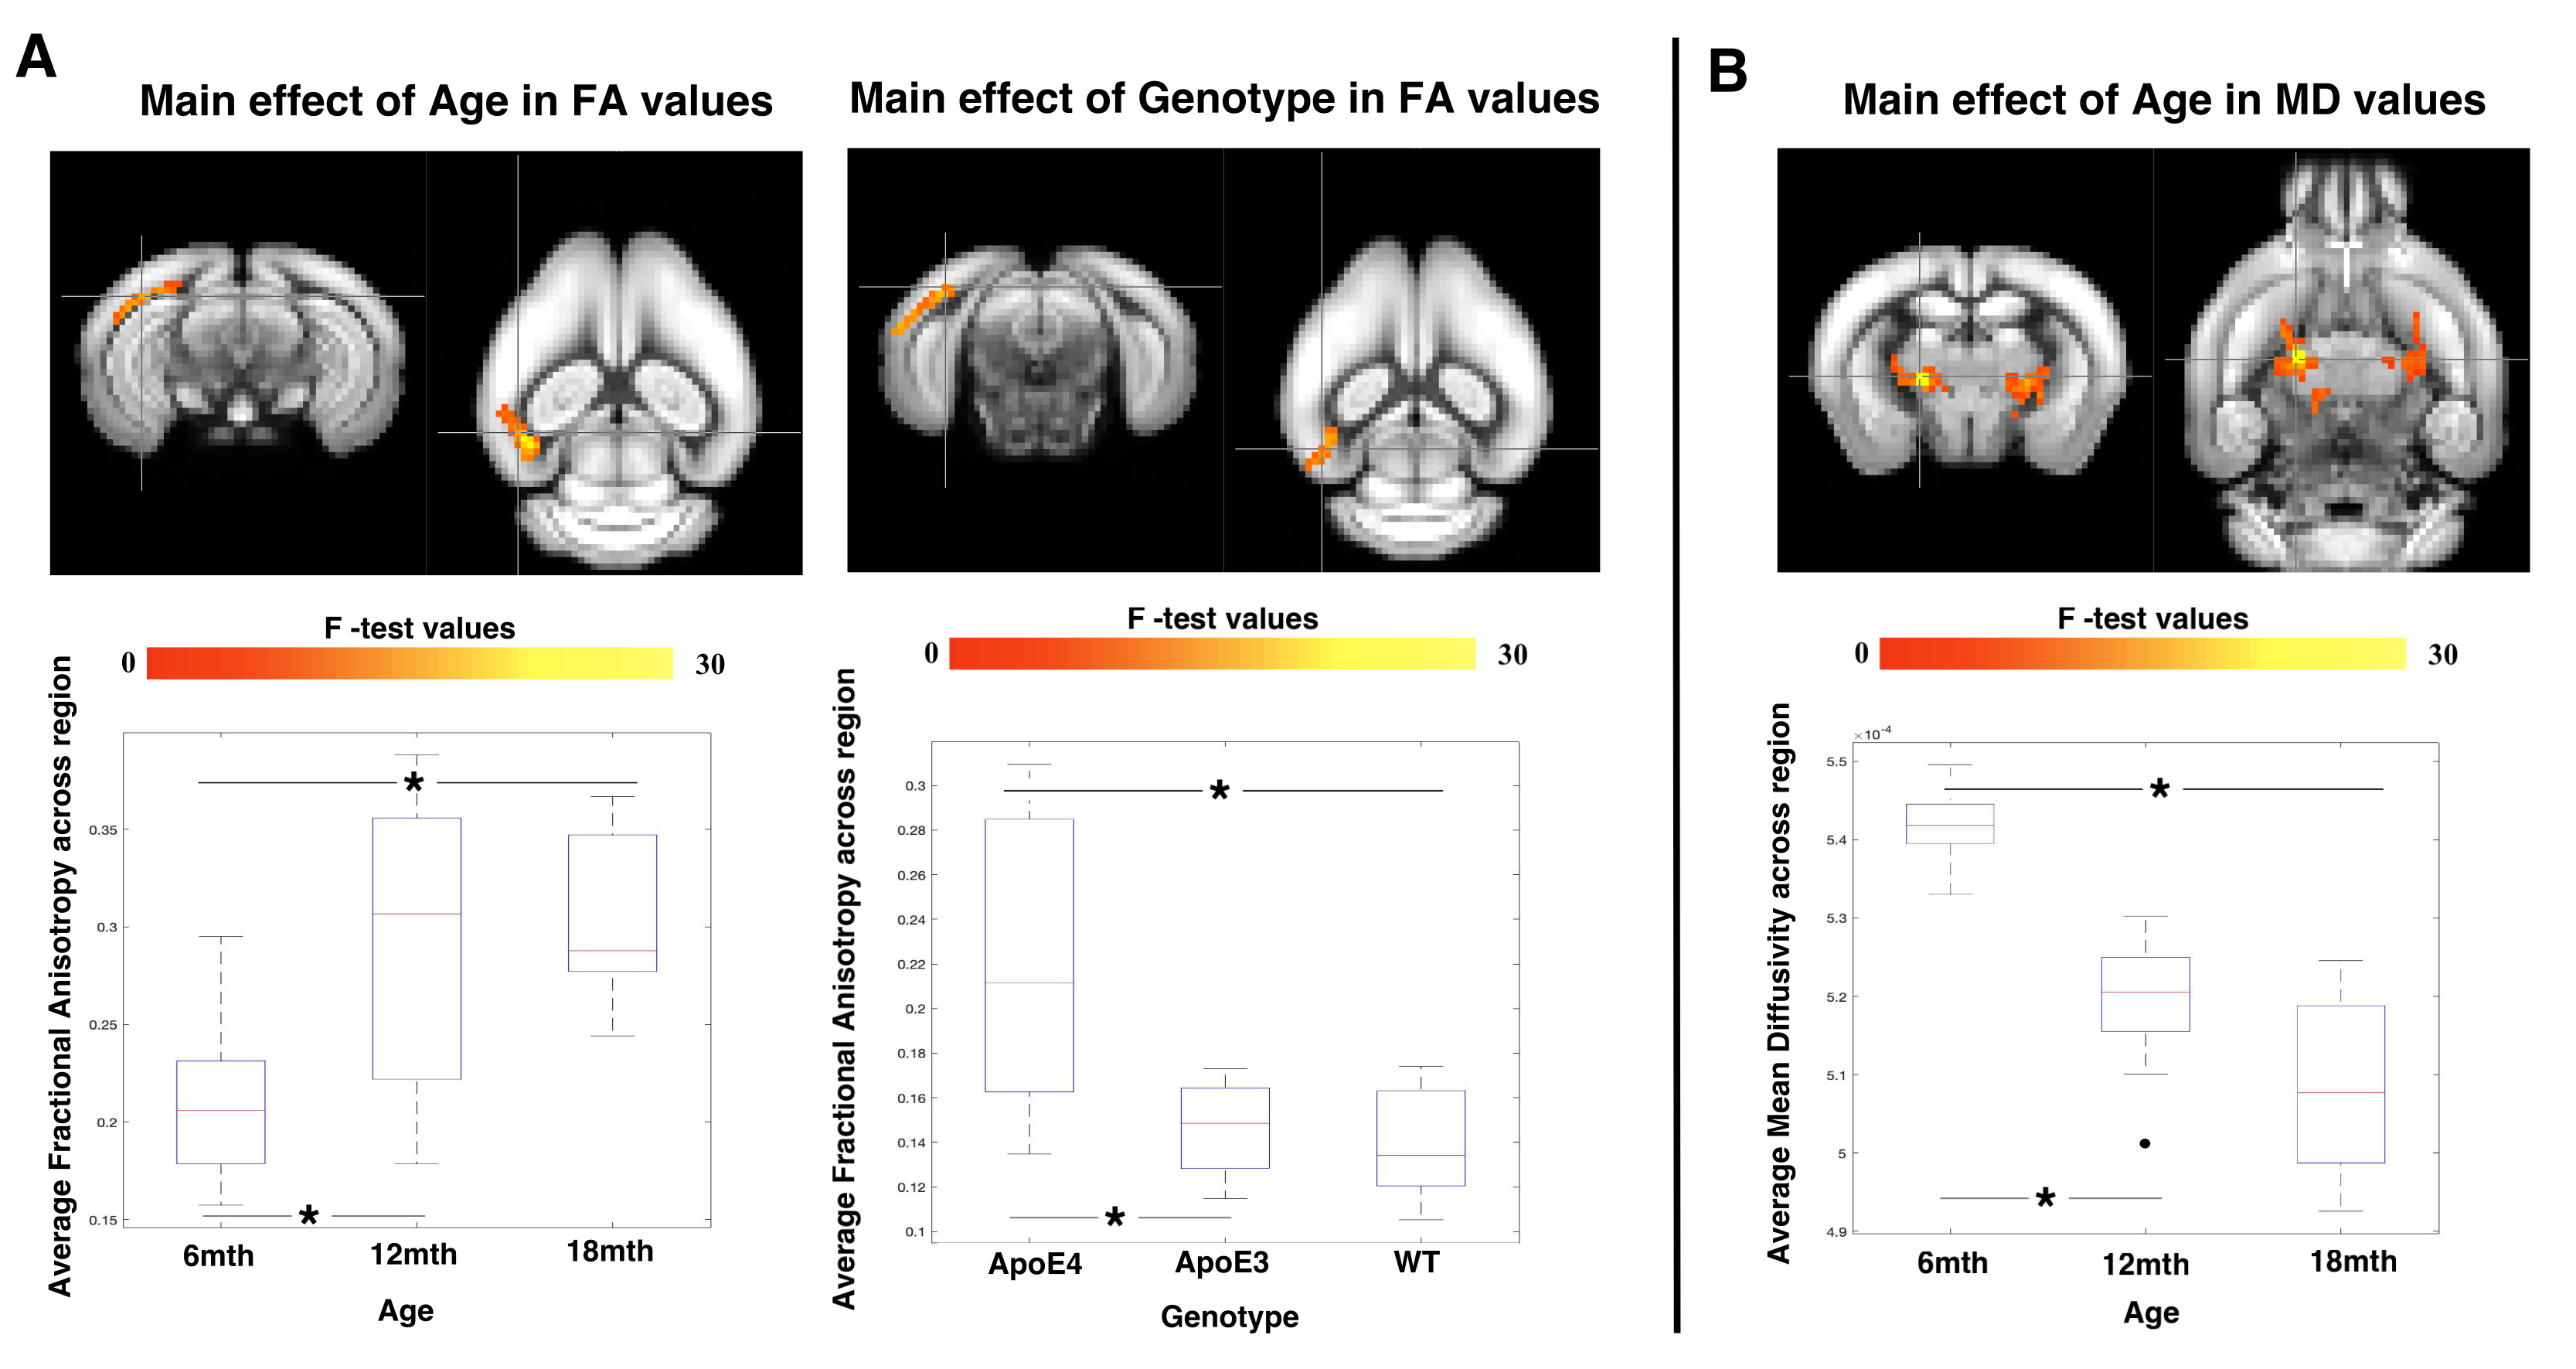
Figure 3. Characterisation of WI. A, Significant clusters across the brain were found for age and genotype effects in FA values while none were found for the interactions effect(top). Specifically, mean FA values in these regions were smaller at 6 as compared to 12 and 18 months and smaller within ApoE4 as compared to ApoE3 and WT(bottom). B, Significant clusters across the brain were found for age effects in MD values while none were found for the genotype and interactions effect(top). Mean MD of these clusters were significantly higher at 6 as compared to 12 and 18 months(bottom).
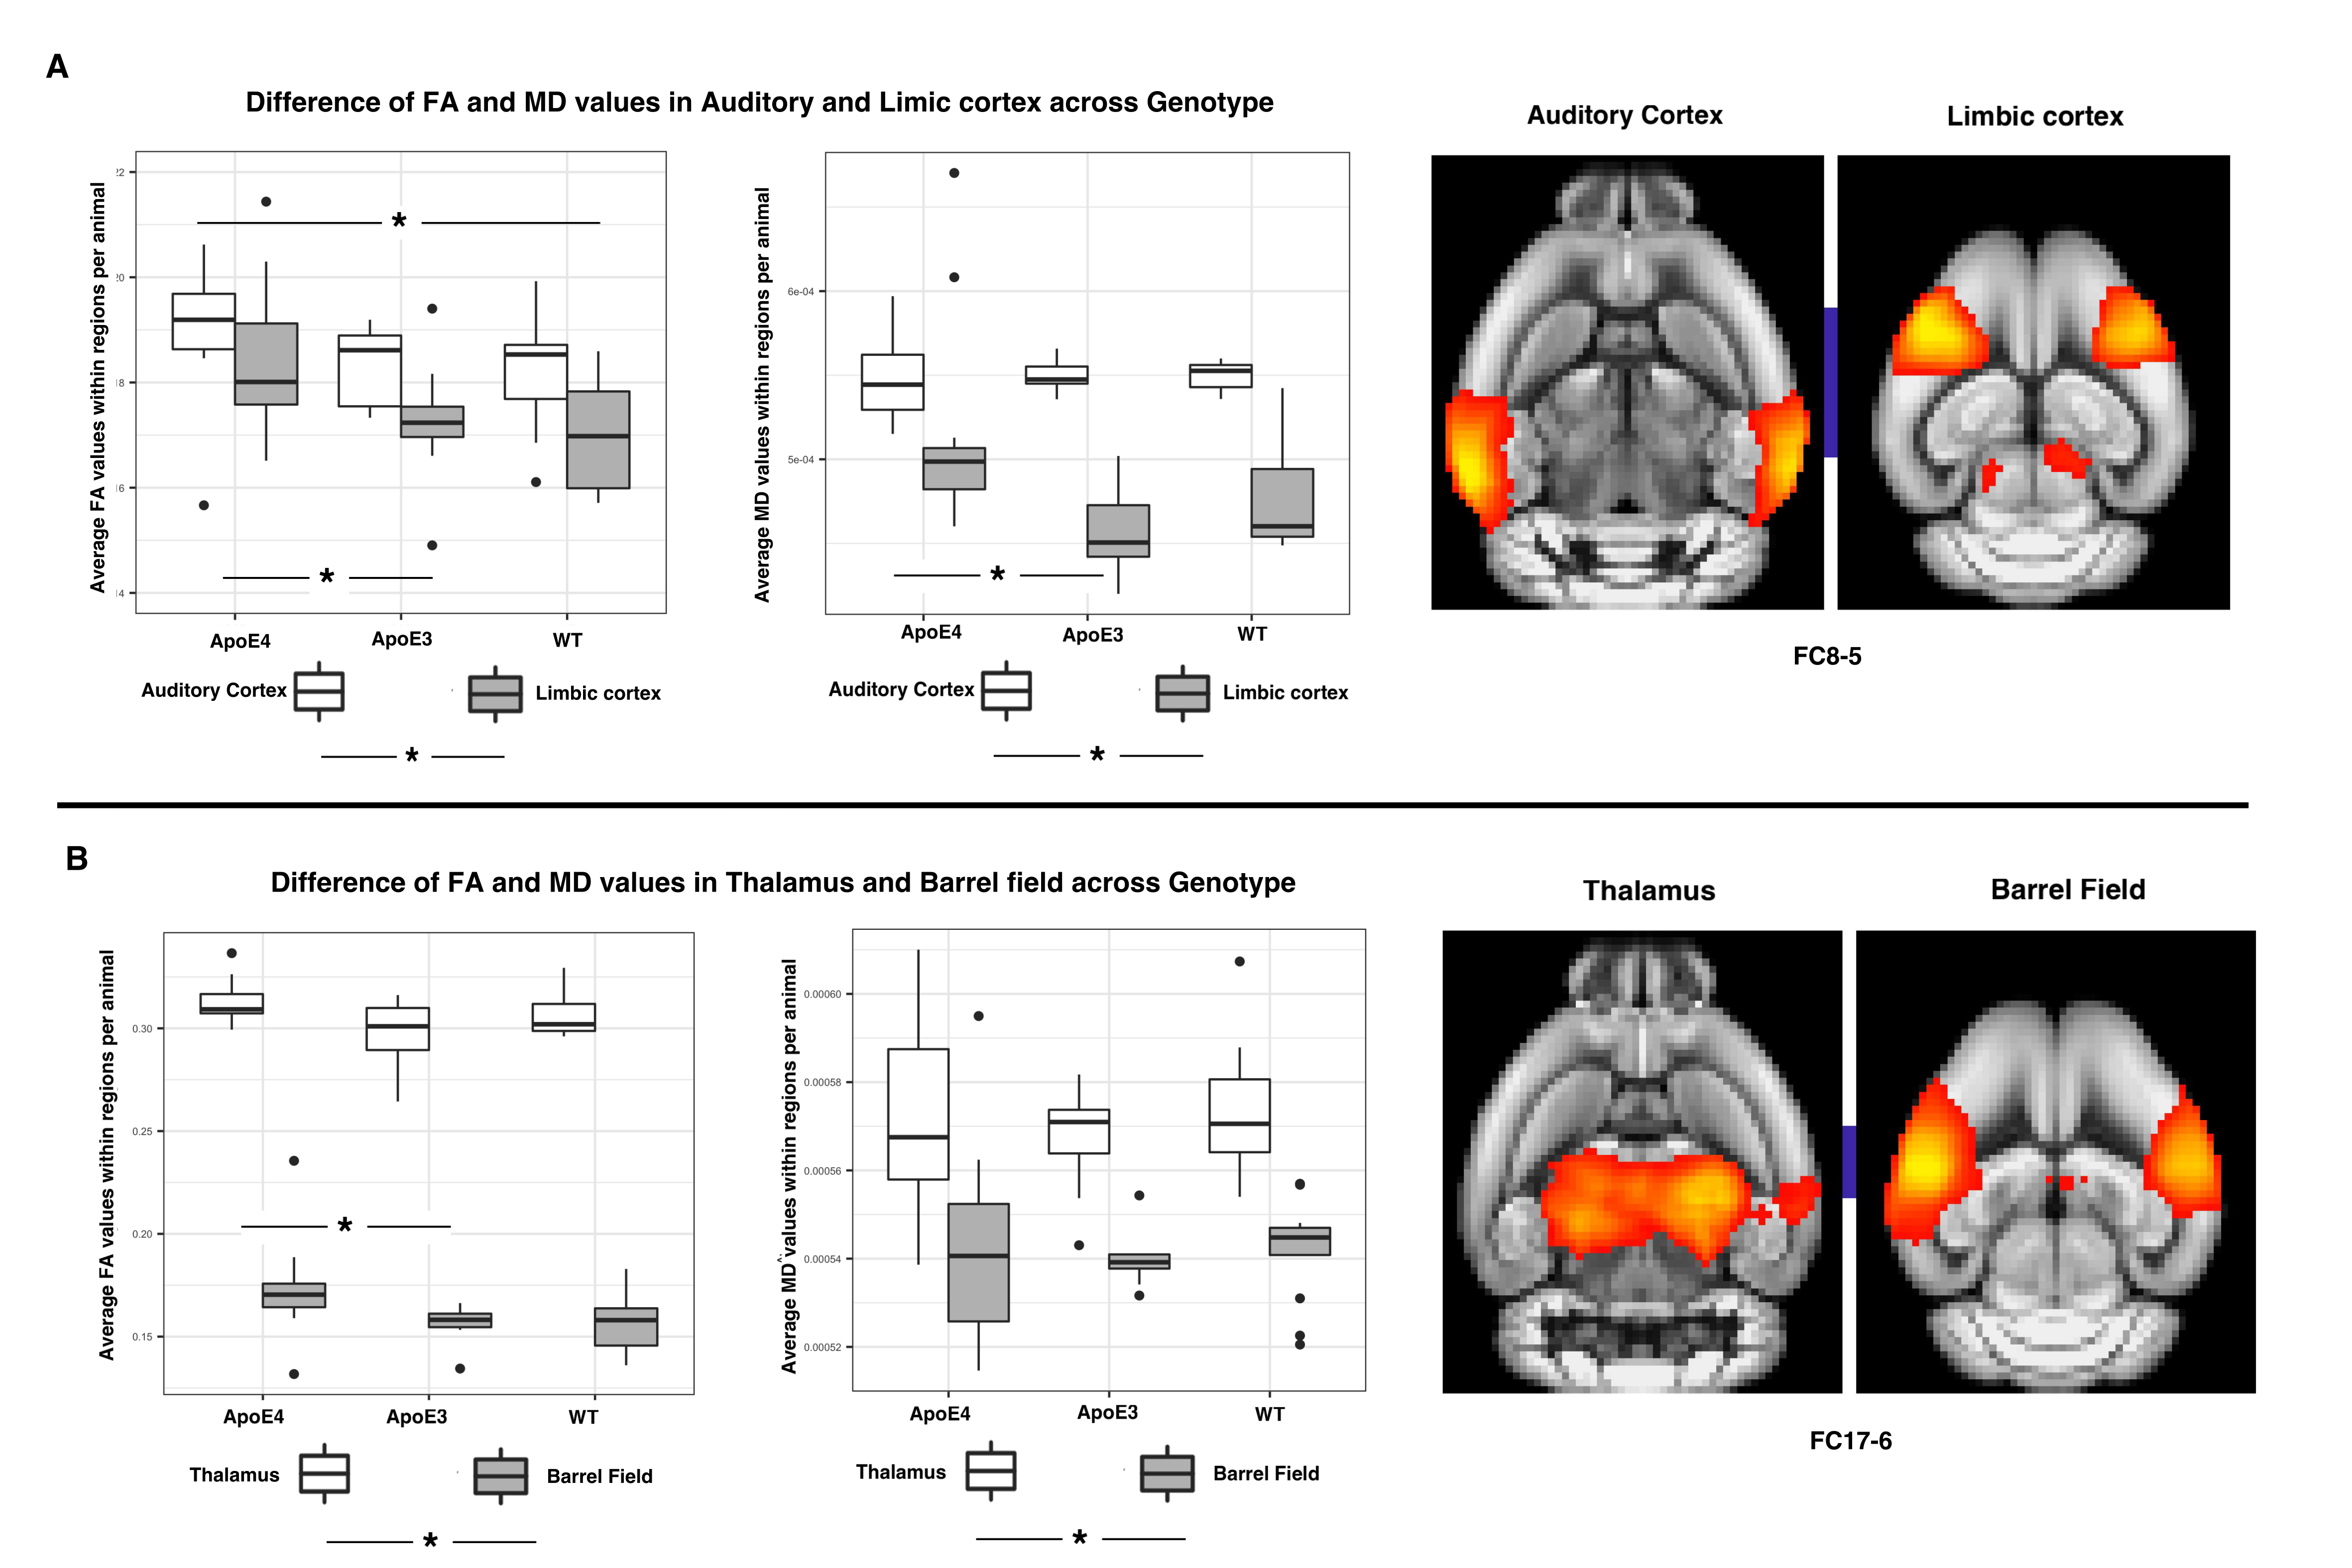
Figure 4. WMI in regions of abnormal FC in ApoE4. A, FA and MD values in auditory cortex(C8) was sig. higher than limbic cortex(C5) across genotypes. In FC8-5, FA of ApoE4 was sig. higher compared across genotype. MD in FC8-5 was sig. higher in ApoE4 as compared to ApoE3, but not sig. different to WT. B, FA and MD values in the thalamus(C17) were sig. higher than the barrel field cortex(C6) across genotypes. In FC17-6 MD shows no sig. difference across genotype. FA of ApoE4 was sig. higher as compared to ApoE3, but not sig. different to WT. No sig. difference between ApoE3 and WT in all comparisons.