1506
Investigation of iron-sensitive MRI biomarkers for non-motor symptoms in early stage Parkinson’s disease1Department of Biomedical Engineering, Sungkyunkwan University, Suwon, Korea, Republic of, 2Center for Neuroscience Imaging Research, Institute for Basic Science, Suwon, Korea, Republic of, 3Department of Neurology, Samsung Medical Center, Seoul, Korea, Republic of, 4Neuroscience Center, Samsung Medical Center, Seoul, Korea, Republic of, 5Department of Biomedical Engineering, Gachon University, Incheon, Korea, Republic of
Synopsis
Deep brain iron accumulation in Parkinson’s disease (PD) has been much studied in MRI but its involvement in clinical non-motor symptoms has been inconclusive. In this work we investigated the correlation between the deep brain iron contents and a wide array of non-motor symptoms in drug naive early PD patients using QSM and R2* mapping at 3T. We found that many non-motor symptoms are significantly correlated with R2* in the extra-striatal system, in particular the thalamus and red nucleus.
Introduction
Iron accumulation and related oxidative stress are believed to be deeply involved in the pathogenesis of Parkinson’s disease (PD).1 In MRI, iron-sensitive methods such as R2* mapping, susceptibility-weighted imaging, and quantitative susceptibility mapping (QSM) have been extensively used to investigate the change of iron in deep brain nuclei in PD.2-4 While many studies investigated the relationship between iron and motor-symptoms of PD, so far the relationship between iron concentration and clinical non-motor manifestations in early stage PD has been reported only in a few studies with conflicting results.5,6 In this study, we attempted to fill in this gap by evaluating iron concentrations in deep brain structures of drug naive early stage PD patients using QSM and R2* mapping, and assessed their correlation with an extensive set of non-motor symptom scales.Methods
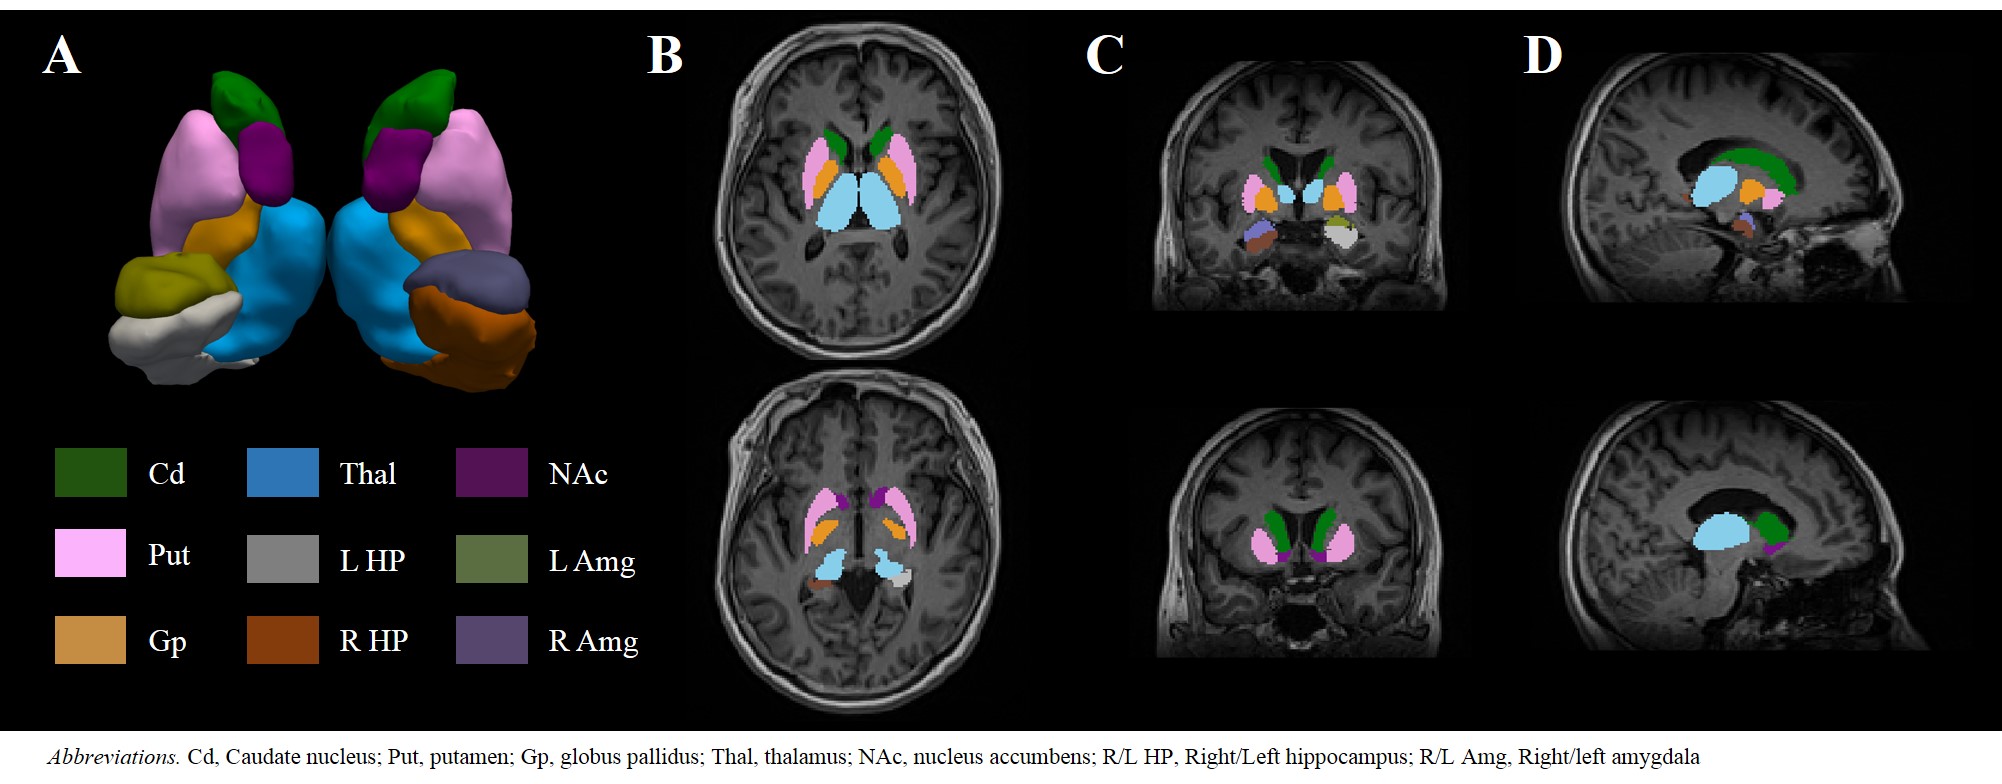
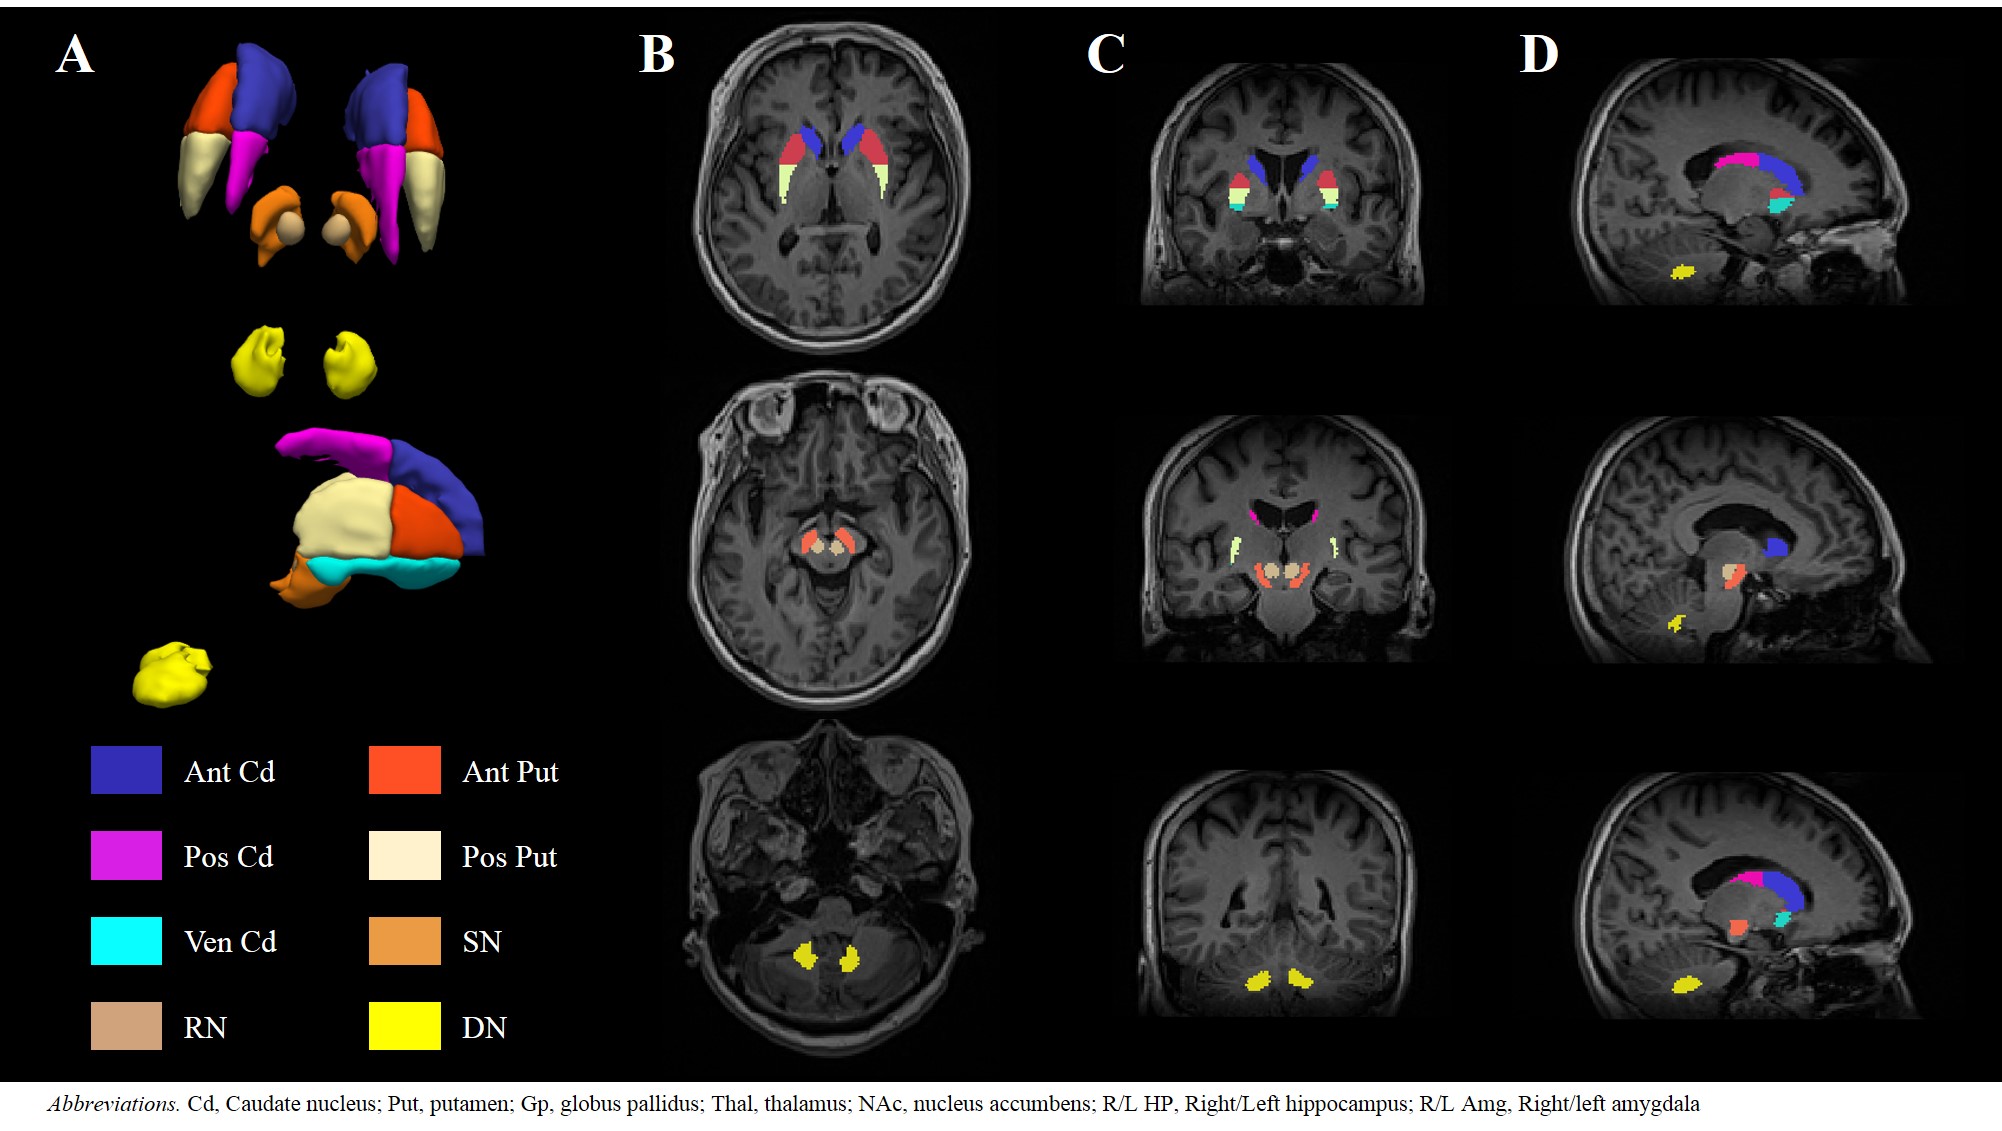
This study was approved by the Institutional Review Board of Samsung Medical Center. Fourteen drug naive PD patients (female = 5, age = 63.4 ± 9.1) and twelve age/sex-matched healthy controls (HCs, female = 7, age = 58.5 ± 9.7) were scanned in a 3T MRI scanner (Magnetom Prisma, Siemens Healthineers, Erlangen, Germany) with a vendor-provided 20-channel head/neck coil with the following protocols: 3D T1-MPRAGE (TR/TE = 2000 ms/2.3 ms, flip angle = 9°, voxel size = 1.2 mm3 ) and 3D multi-echo GRE (TR = 47 ms , TE = 7 to 42 in 5 ms, flip angle = 20°, voxel size = 1.2 mm3). For all patients, the baseline characteristics and the scores from several motor- and non-motor symptom scales were recorded, including the Korean Non-Motor Symptoms Scale (K-NMSS) that consisted of 9 items. The multi-echo GRE data from individual coil channels were combined by an in-house processing code based on zero echo-time phase subtraction. R2* was calculated by linear fitting of the logarithm of the Rician noise-corrected magnitudes of the multi-echo GRE data.7 QSM was reconstructed by a publicly available software package STISuite (https://people.eecs.berkeley.edu/~chunlei.liu/software.html). The T1-weighted images were used to segment the bilateral nucleus accumbens (NAc), caudate nucleus (Cd), putamen (Put), globus pallidus (Gp), hippocampus (HP), amygdala (Amg) and thalamus (Thal) in an automated workflow based on the FIRST function in FSL8 (Fig. 1). The Cd and Put were further divided into a total of five sub-regions (anterior/posterior Cd and Put, ventral Put).9 Bilateral red nucleus (RN), dentate nucleus (DN) and substantia nigra (SN) were manually defined on the QSM by a neurologist (Fig. 2). The susceptibility and R2* were averaged across the bilateral regions except in HP and Amg where laterality has been reported.10,11 The correlation between susceptibility/R2* and the clinical symptoms was assessed using Spearman rank correlation test wherein age and sex were controlled.Results
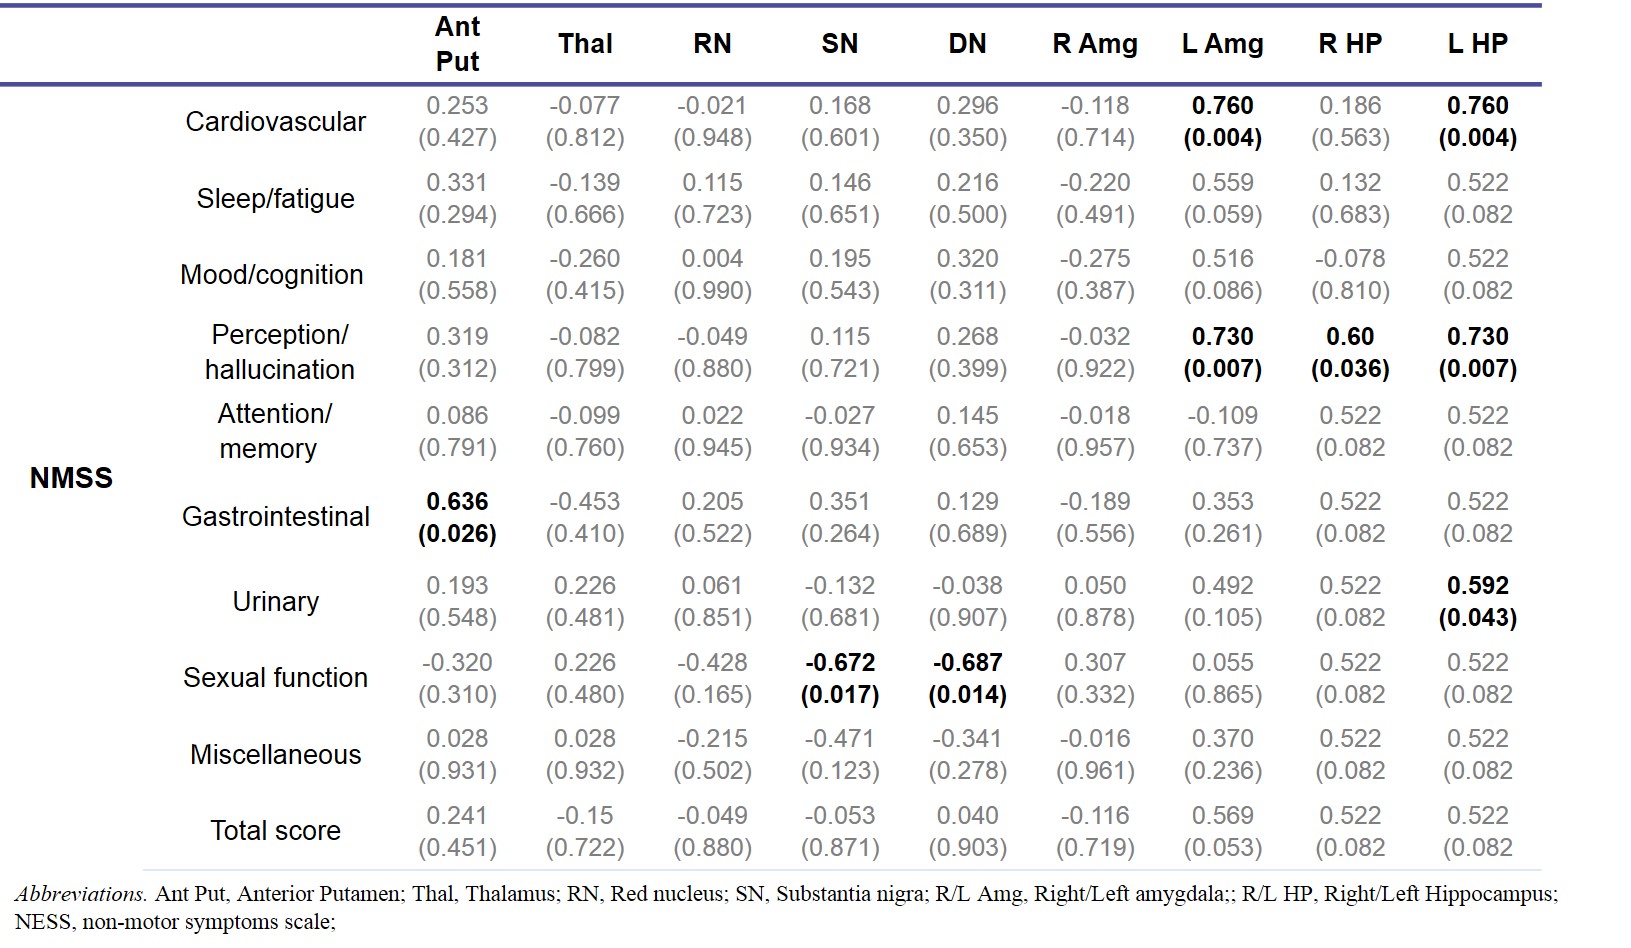
R2* was significantly higher in SN, anterior Cd, overall Put and anterior Put in the PD group than in the HC group. (Table 1). R2* exhibited widespread association with non-motor symptoms such as sleep/fatigue, mood/cognition, perception/hallucination, urinary and overall K-NMSS scores (Table 2). In particular, R2* in Thal was correlated with the most symptoms. This may be understood in terms of the change in the basal ganglia-thalamocortical circuit which is characteristic of PD. Since the thalamus acts as a gateway for signals from the basal ganglia to the cortex, its degenerative change may lead to dysfunction of limbic, associative and cognitive areas. In addition, R2* in RN and the limbic system, especially the right Amg and HP, showed correlation with several non-motor symptoms. Interestingly, R2* in the basal ganglia and the motor symptoms did not exhibit statistically significant correlation. Magnetic susceptibility generally showed less correlation with clinical symptoms than R2*. The most relevant association was found in the HP (Table 3), which is in accordance with a previous study concerning dementia in PD.5Discussion & Conclusion
In this work we evaluated putative iron deposition in deep brain regions using R2* and QSM in early PD patients and HCs, and explored its correlation with clinical symptoms in PD. We found that R2* in extra-striatal system was positively correlated with several non-motor symptoms in drug naive PD patients. Moreover, the magnetic susceptibility in HP was associated with non-motor symptoms such as perception and hallucination. These results suggest that iron-sensitive MRI can provide a potential biomarker for non-motor symptoms in PD, and imply iron’s involvement in PD pathology other than in dopaminergic neurons. Limitations of our study include a small sample size, relatively low spatial resolution, and contributions from non-iron sources to R2* and magnetic susceptibility. An expanded study to address some of these issues are currently in the planning.Acknowledgements
This work was supported by IBS-R015-D1.References
[1] Zecca, L., Youdim, M. B., Riederer, P., Connor, J. R., & Crichton, R. R. (2004). Iron, brain ageing and neurodegenerative disorders. Nature Reviews Neuroscience, 5(11), 863.
[2] Barbosa, J. H. O., Santos, A. C., Tumas, V., Liu, M., Zheng, W., Haacke, E. M., & Salmon, C. E. G. (2015). Quantifying brain iron deposition in patients with Parkinson's disease using quantitative susceptibility mapping, R2 and R2*. Magnetic resonance imaging, 33(5), 559-565.
[3] Guan, X., Xuan, M., Gu, Q., Huang, P., Liu, C., Wang, N., ... & Zhang, M. (2017). Regionally progressive accumulation of iron in Parkinson's disease as measured by quantitative susceptibility mapping. NMR in Biomedicine, 30(4).[4] Li, D. T., Hui, E. S., Chan, Q., Yao, N., Chua, S. E., McAlonan, G. M., ... & Mak, H. K. (2018). Quantitative susceptibility mapping as an indicator of subcortical and limbic iron abnormality in Parkinson's disease with dementia. NeuroImage: Clinical, 20, 365-373.
[5] Li, D. T., Hui, E. S., Chan, Q., Yao, N., Chua, S. E., McAlonan, G. M., ... & Mak, H. K. (2018). Quantitative susceptibility mapping as an indicator of subcortical and limbic iron abnormality in Parkinson's disease with dementia. NeuroImage: Clinical, 20, 365-373.
[6] Shin, C., Lee, S., Lee, J. Y., Rhim, J. H., & Park, S. W. (2018). Non-Motor Symptom Burdens Are Not Associated with Iron Accumulation in Early Parkinson's Disease: A Quantitative Susceptibility Mapping Study. Journal of Korean Medical Science, 33(13).
[7] Miller, A. J., & Joseph, P. M. (1993). The use of power images to perform quantitative analysis on low SNR MR images. Magnetic resonance imaging, 11(7), 1051-1056.
[8] Jenkinson, M., Beckmann, C. F., Behrens, T. E., Woolrich, M. W., & Smith, S. M. (2012). Fsl. Neuroimage, 62(2), 782-790.
[9] Oh, M., Kim, J. S., Kim, J. Y., Shin, K. H., Park, S. H., Kim, H. O., ... & Lee, C. S. (2012). Subregional patterns of preferential striatal dopamine transporter loss differ in Parkinson disease, progressive supranuclear palsy, and multiple-system atrophy. Journal of Nuclear Medicine, 53(3), 399-406.
[10] Burgess, N., Maguire, E. A., & O'Keefe, J. (2002). The human hippocampus and spatial and episodic memory. Neuron, 35(4), 625-641.
[11] Baeken, C., Marinazzo, D., Van Schuerbeek, P., Wu, G. R., De Mey, J., Luypaert, R., & De Raedt, R. (2014). Left and right amygdala-mediofrontal cortical functional connectivity is differentially modulated by harm avoidance. PLoS One, 9(4), e95740.
Figures