1505
Differential clinical associations of Periventricular and Deep White Matter Hyperintensities on FLAIR1Department of Neurology, New York University School of Medicine, New York, NY, United States, 2Department of Neurology and Radiology, New York University School of Medicine, New York, NY, United States, 3Department of Radiology, New York University School of Medicine, New York, NY, United States
Synopsis
In this study, we examined the differences of two subtypes of white matter hyperintensities (WMHs), periventricular WMHs (PVWMH) and deep WMHs (DWMH) on MRI, as they associate with cognitive dysfunction and dementia, and other clinical assessments of the elderly. A robust computational method (Bilateral Distance classification) was implemented to quantify PVWMH and DWMH. Clinical associations revealed by the algorithm are consistent with the literature findings based on subjective classification methods that the two types of WMHs have differential clinical associations and may have different pathological etiologies and roles in cognitive impairment and dementia.
Introduction
White matter hyperintensities (WMHs) are readily visualized as areas of high signal intensity on FLAIR MRI and is a common finding in the elderly.1 Previous studies have indicated that these lesions can be classified into two subtypes, periventricular WMHs (PVWMH) and deep WMHs (DWMH), based on their localization with respect to lateral ventricles either at (PVWMH) or away (DWMH) from the surface of lateral ventricles.2 There is an increasing awareness of the differences between PVWMH and DWMH attributed to solid clinical justification of this division, based on numerous studies which demonstrated that PVWMH and DWMH have different functional, histopathological, and etiological features.3, 4 Pathologically, PVWMH are characterized by gliosis, loosening of the WM fibers, and myelin loss around tortuous venules in perivascular spaces, which may be related to inflammation.5-7 On the other hand, DWMH tend to be associated more closely with demyelination, gliosis, and axonal loss around perivascular spaces, with vacuolation and tissue loss, possibly related to ischemia.6 However, the quantification of PVWMH and DWMH varies across studies, and often depends on discrete subjective rating, due to the lack of universally accepted definition of PVWMH and DWMH.1, 8, 9 We have developed an objective automated method (Bilateral Distance classification) that quantifies PVWMH and DWMH. The purpose of this study is to examine the differential clinical associations of PVWMH and DWMH volumes in well characterized elderly subjects.Methods
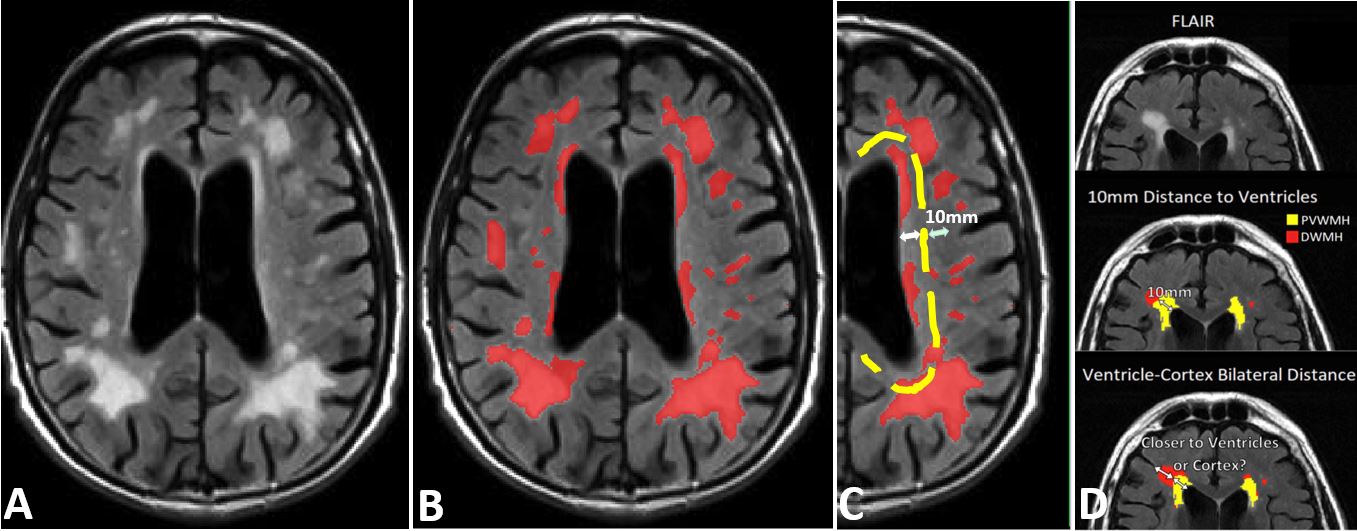
Image Processing: Total WMHs were segmented on FLAIR scans with locally developed software, and quality-controlled. Binary masks of white matter (WM), lateral ventricles and cerebral cortex were segmented on 3D T1 scans with Freesurfer (v6.0 https://surfer.nmr.mgh.harvard.edu), and then co-registered with FLAIR images using FSL (v6.0 https://fsl.fmrib.ox.ac.uk). Distance maps for lateral ventricles and for cerebral cortex were generated on FLAIR space with FSL, as shown in Figure 1. Finally, the FLAIR WMHs were masked with the co-registered T1-WM mask, and classified into PVWMH and DWMH on total WMHs masks using a novel Bilateral Distance classification, with source codes of core algorithms available at https://github.com/jingyunc/wmhs. For correlation tests, we also computed the volumes of gray matter (GM), WM, cerebrospinal fluid (CSF) and lateral ventricles from Freesurfer outputs.Imaging Data: MRI data of 60 subjects were downloaded from the Alzheimer’s Disease Neuroimaging Initiative database (ADNI, http://adni.loni.usc.edu). The three groups of 20 each consisted of normal controls (NC), MCI and AD subjects and were matched on gender and age (NC: 74.3±7.1; MCI: 74.8±7.9; AD: 75.8±7.2). 3T MRI included: (a) 2D axial FLAIR, 256×256 mm FOV, 256×256x40 matrix, voxel size 0.86×0.86×5 mm3, TR=11,000 ms, and TE=147 ms; (b) 3D T1-weighted (MPRAGE or SPGR sequence).10, 11
Clinical Data: The following data sheets were also downloaded from ADNI database: Geriatric Depression Scale (GDS), Clinical Dementia Rating Scale (CDR), Mini-Mental State Examination (MMSE), Montreal Cognitive Assessment (MoCA), Modified Hachinski Ischemia Scale, and UC Berkeley - AV45 Analysis.
Statistical Analyses: We compared the differences in lesion volumes between NC subjects and MCI & AD subjects for both PVWMH and DWMH. We also matched the WMH data and clinical data of the same subjects with closest-date criteria and computed Pearson correlation coefficients and p-values between WMH data (including total WMH volume, PVWMH volume, DWMH volume, and PVWMH and DWMH ratio relative to intracranial volume) and clinical data. Clinical correlations were computed for the entire cohort, regardless of subject groups. The number of subjects (N) varies as the found matching subjects are different among different clinical correlation tests.
Results and Discussion
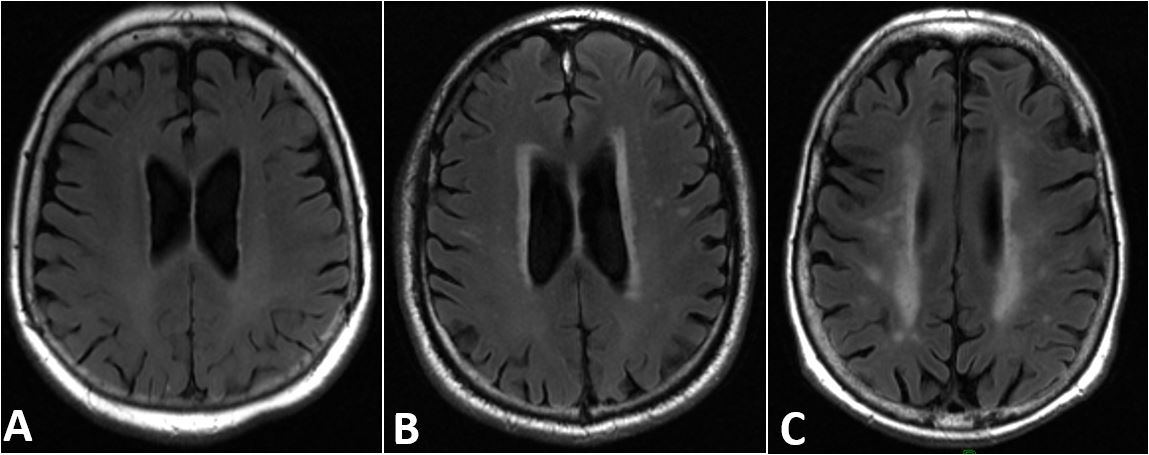
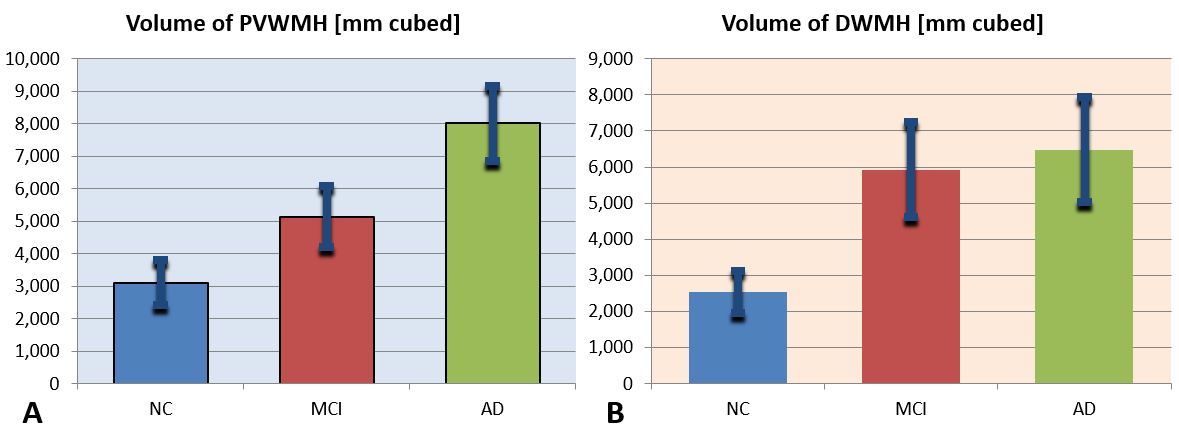
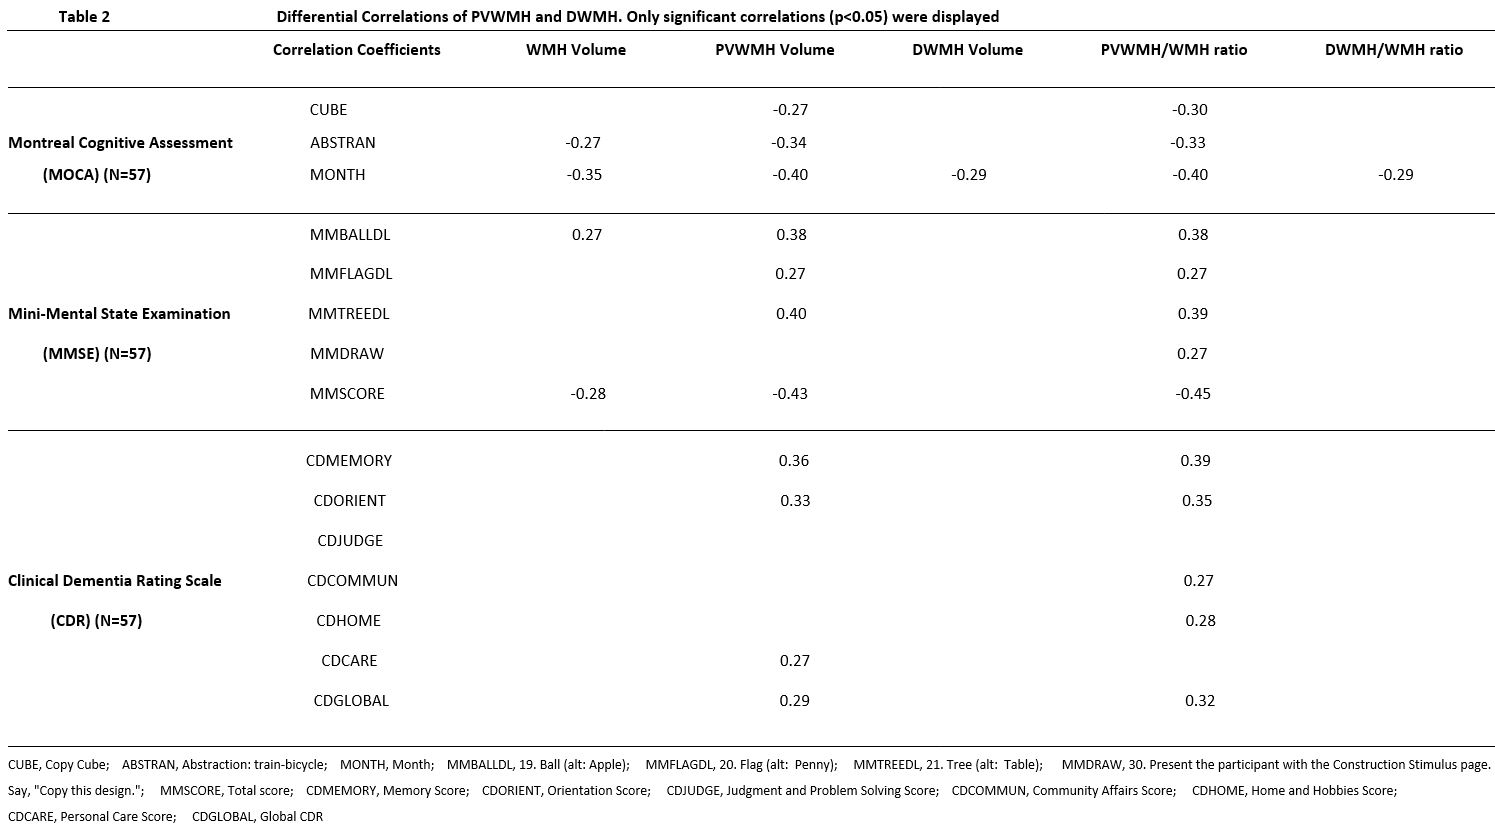
There are significant volume differences of PVWMH and DWMH between MCI & AD patients and controls (Figure 2). For PVWMH volume, the difference between MCI and controls is as prominent as the difference between MCI and AD (Figure 3A). For DWMH volume, the difference between MCI and controls is much more distinct compared to the difference between MCI and AD (Figure 3B). These findings suggest that PVWMH may play a more specific role in differentiating the severity of dementia in MCI and AD patients as compared to DWMH, which don’t show much difference between MCI and AD. Regarding the clinical correlations with WMHs, there is no significant correlation between WMH data and GDS scores or ischemia scales. For volumes, only ventricle volumes correlate with PVWMH/DWMH. GM, WM, CSF volumes are not found to be significantly correlated with clinical measures. For cerebral amyloid, SUVR scores mainly correlate with PVWMH, the results are mostly symmetric between left and right hemispheres (Table 1). Similarly, cognitive impairment and dementia mainly correlate with PVWMH (Table 2). These results are consistent with findings from previous studies which implemented various methods to quantify WMH and subregions.Conclusion
Bilateral distance classification allows robust quantification of PVWMH and DWMH on FLAIR, and reproduced their differential clinical associations reported by previous studies which mainly used subjective visual classification. The association of cognitive dysfunction and dementia with PVWMH (but not DWMH) suggests that PVWMH, when properly measured, has promising potential to be a biomarker for MCI and AD.Acknowledgements
This study was funded by National Institute of Health (NIH) grants: RF1 NS110041, R56 AG060822, R01 EB025133, and R01 EB025133-S2. This study is also partially supported by Alzheimer’s Disease Association research grant AARG-17-533484 and Alzheimer's Disease Center grant P30 AG008051.
ADNI database was funded by the Alzheimer's Disease Neuroimaging Initiative (ADNI) (National Institutes of Health Grant U01 AG024904) and DOD ADNI (Department of Defense award number W81XWH-12-2-0012).
References
1. Wardlaw, J. M., Valdés Hernández, M. C., & Muñoz‐Maniega, S. (2015). What are white matter hyperintensities made of? Relevance to vascular cognitive impairment. Journal of the American Heart Association, 4(6), e001140.
2. Fazekas, F., Chawluk, J. B., Alavi, A., Hurtig, H. I., & Zimmerman, R. A. (1987). MR signal abnormalities at 1.5 T in Alzheimer's dementia and normal aging. American journal of roentgenology, 149(2), 351-356.
3. Debette, S., & Markus, H. S. (2010). The clinical importance of white matter hyperintensities on brain magnetic resonance imaging: systematic review and meta-analysis. Bmj, 341, c3666.
4. Kim, K. W., MacFall, J. R., & Payne, M. E. (2008). Classification of white matter lesions on magnetic resonance imaging in elderly persons. Biological psychiatry, 64(4), 273-280.
5. Black, S., Gao, F., & Bilbao, J. (2009). Understanding white matter disease: imaging-pathological correlations in vascular cognitive impairment. Stroke, 40(3_suppl_1), S48-S52.
6. Gouw, A. A., Seewann, A., Van Der Flier, W. M., Barkhof, F., Rozemuller, A. M., Scheltens, P., & Geurts, J. J. (2011). Heterogeneity of small vessel disease: a systematic review of MRI and histopathology correlations. Journal of Neurology, Neurosurgery & Psychiatry, 82(2), 126-135.
7. Moody, D. M., Brown, W. R., Challa, V. R., & Anderson, R. L. (1995). Periventricular venous collagenosis: association with leukoaraiosis. Radiology, 194(2), 469-476.
8. DeCarli, C., Fletcher, E., Ramey, V., Harvey, D., & Jagust, W. J. (2005). Anatomical mapping of white matter hyperintensities (wmh) exploring the relationships between periventricular WMH, deep WMH, and total WMH burden. Stroke, 36(1), 50-55.
9. Sachdev, P., Wen, W., DeCarli, C., & Harvey, D. (2005). Should we distinguish between periventricular and deep white matter hyperintensities?. Stroke-a Journal of Cerebral Circulation, 36(11), 2342-2343.
10. Nir, T. M., Jahanshad, N., Villalon-Reina, J. E., Toga, A. W., Jack, C. R., Weiner, M. W., ... & Alzheimer's Disease Neuroimaging Initiative (ADNI. (2013). Effectiveness of regional DTI measures in distinguishing Alzheimer's disease, MCI, and normal aging. NeuroImage: clinical, 3, 180-195.
11. Dadar, M., Maranzano, J., Ducharme, S., Carmichael, O. T., Decarli, C., Collins, D. L., & Alzheimer's Disease Neuroimaging Initiative. (2018). Validation of T 1w‐based segmentations of white matter hyperintensity volumes in large‐scale datasets of aging. Human brain mapping, 39(3), 1093-1107.
Figures