1504
Disrupted interhemispheric coordination with unaffected lateralization of global eigenvector centrality characterizes hemiparkinsonism.1Department of Radiology, The Second Affiliated Hospital, Zhejiang University School of Medicine, Hangzhou, China, 2Department of Neurology, The Second Affiliated Hospital, Zhejiang University School of Medicine, Hangzhou, China
Synopsis
The motor dysfunctions always affect hemi-body first in Parkinson's disease (PD). However, the interhemispheric relationships in patients with only unilateral motor impairment were barely known to date. In this study, 43 unilateral-symptomatic PD patients (UPD, Hoehn-Yahr staging scale, H-Y: 1-1.5), and 54 NC were recruited. We aimed to investigate the interhemispheric coordination and hemispheric dominance pattern for further understanding the pathogenesis of PD. We found that the disrupted interhemispheric coordination in bilateral sensorimotor regions may have significant implications for elucidating the mechanisms underlying the hemiparkinsonism and enabling the individual diagnosis and assessment of early PD.
Purpose
The motor dysfunctions always affect hemi-body first in Parkinson's disease (PD) [1, 2], which is a distinct characteristic discriminating PD from other atypical parkinsonism, and serves as a diagnostic criterion for PD [1, 2]. In PD, not only patients with freezing gait, drug-naive patients, also different PD subtypes showed decreased interhemispheric coordination [3-5], Besides, the functional connectivity (FC) is not equally distributed between hemispheres in human brain [6], suggesting that the hemispheric dominance is an intrinsic property. But none of them considered the unilaterality of motor impairment, therefore, the interhemispheric relationships including interhemispheric coordination and hemispheric dominance pattern in patients with only unilateral motor impairment were barely known to date. We aimed to investigate the interhemispheric functions using resting-state functional Magnetic resonance imaging (RS-fMRI) for further understanding the pathogenesis of PD.Methods
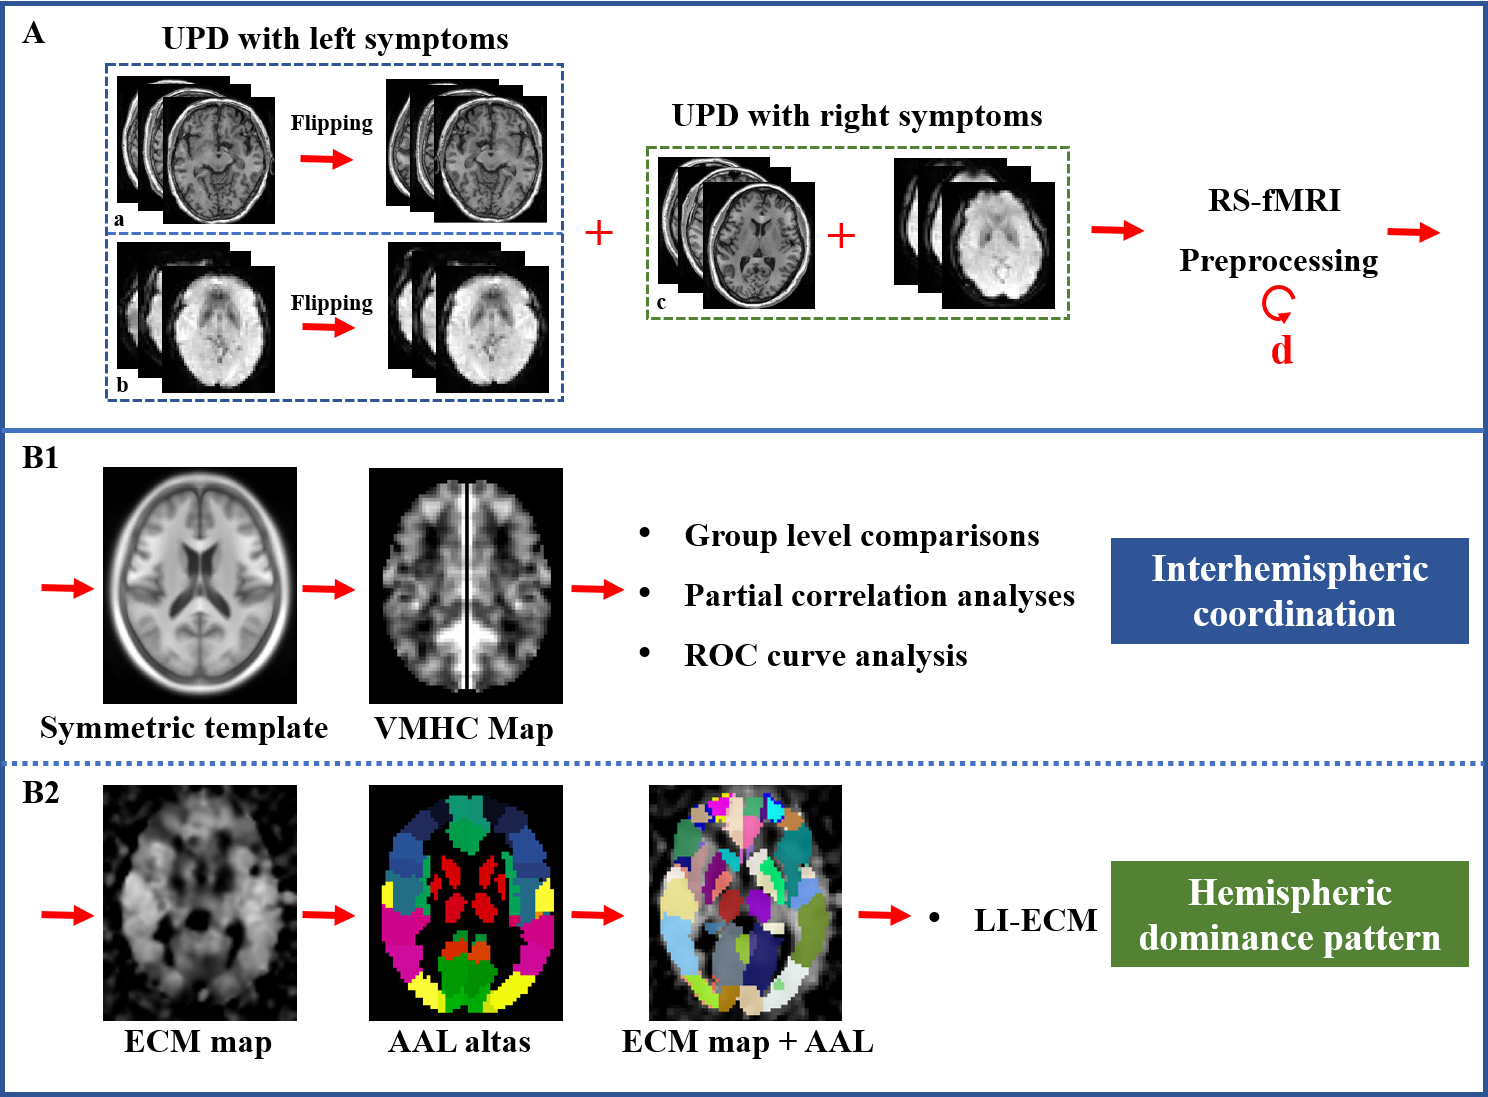
Forty-three unilateral-symptomatic PD patients (UPD, Hoehn-Yahr staging scale, H-Y: 1-1.5), and 54 age-, gender-, education-matched normal controls (NC) were recruited. All subjects underwent MRI scanning and clinical evaluations. At the beginning of the preprocessing, affected side of 19 UPD patients with left-side symptoms were left-to-right flipped, and then the RS-fMRI (TR = 2000 ms; TE = 30 ms; flip angle = 77 degrees; FOV = 240 × 240 mm2; matrix = 64 × 64; slice thickness = 4 mm; slice gap = 0 mm; 38 interleaved axial slices. A total of 205 volumes were acquired from each subject) and T1 images (Fast-Spoiled Gradient Recalled sequence: TR = 7.336 ms; TE = 3.036 ms; inversion time = 450 ms; flip angle = 11 degrees; FOV = 260 × 260 mm 2; matrix = 256 × 256; slice thickness = 1.2 mm; 196 continuous sagittal slices) from 19 UPD patients flipped along the x-axis using “fslswapdim” scripted in FMRIB Software Library (FSL, http://www.fmrib.ox.ac.uk/fsl/) [7], so that the left hemisphere was defined as the contralateral side to affected side, and the right hemisphere was defined as the ipsilateral side to affected side in the patient group. Then, images underwent preprocessing steps, including first 10 volumes discard, interval scanning, realignment, normalization, smoothing, detrending, and filtering. For calculating Voxel-Mirrored Homotopic Connectivity (VMHC) which denotes interhemispheric coordination, we got the T1 images in MNI space first. Then, a group-specific symmetric template constructed on the T1 images was created. Those T1 images in the MNI space were respectively normalized to the symmetric T1 template, and the transformation maps were applied to the functional images [8]. Finally, functional connectivity between each pair of symmetric voxels was computed using Pearson’s correlation after each functional data normalized to the constructed symmetric template. Fisher’s r-to-z transformation was performed to improve the data’s normality. Given that the global signal regression in connectivity calculation was found to be controversial for the generation of numerous negative FC that is hard to explain [9], we further tested the influence of this preprocessed step without global signal regression. ECM of the preprocessed data was performed using the fast ECM tool (https://code.google.com/p/bias/source/browse/matlab/fastECM) [10]. At first, EC values in the region of interests (ROI) were extracted based on the anatomical automatic labeling (AAL) atlas (116 ROIs in total). Then, for acquiring the hemispheric dominance pattern of the regional global FC, the laterality index of eigenvector centrality mapping (LI-ECM) [11] was calculated as (Contra - Ipsi) / (Contra + Ipsi), in which Contra and Ipsi represented the EC at symmetric contralateral and ipsilateral ROIs, respectively. Thus 58 LI-ECMs covering the whole brain were acquired (Figure 1). Afterwards, FC of the clusters showing significant alterations between NC and UPD groups were extracted to test their relationships with clinical motor variables using Partial correlation analyses. Age, gender and education were regarded as covariates. The clinical motor variables included UPDRS motor score, UPDRS total score, motor score of the affected side. Finally, in order to test the ability of the observed functional abnormalities for identifying UPD from normal controls at the individual level, we performed SPSS-receiver operating characteristic (ROC) curve analysis. The area under curve (AUC), specificity and sensitivity were computed.Results
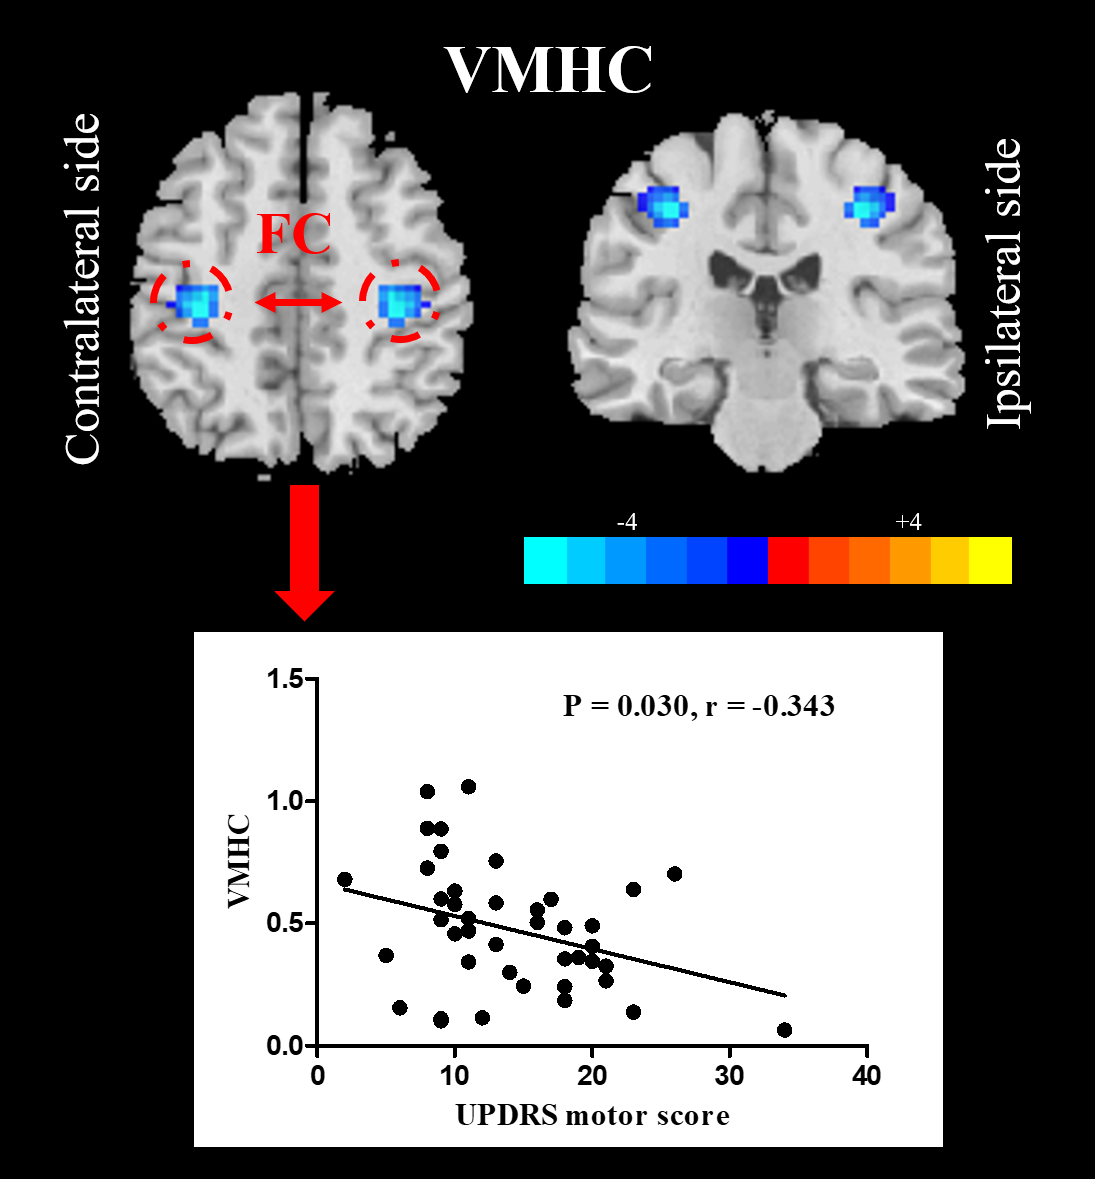
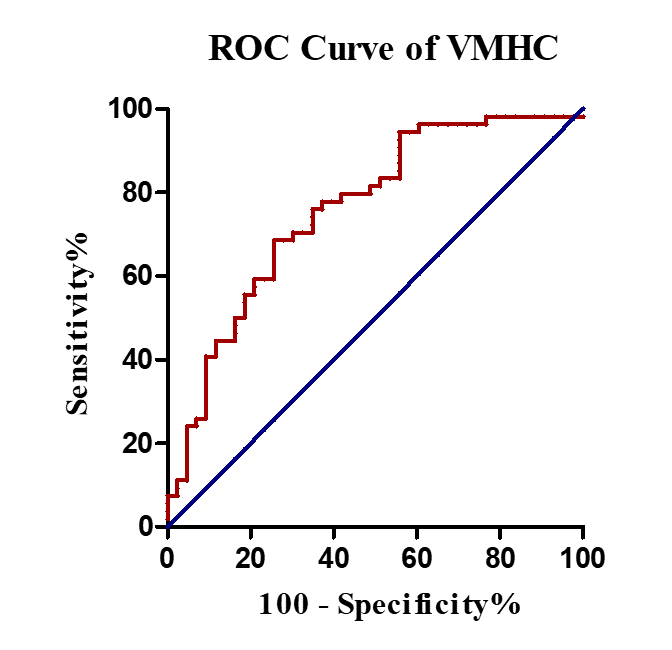
Compared with NC, UPD group showed significantly decreased VMHC in bilateral sensorimotor regions (X = ±36, Y = -24, Z = 48, MNI space; T value = -4.807) which was negatively correlated with the motor score (p = 0.030, r = -0.343) (Figure 2). Furthermore, at the cut-off homotopic connectivity of 0.604, statistically significant ability of VMHC to discriminate UPD from NC with area under ROC curve (AUC) = 0.759, p < 0.001; specificity = 74.4%; sensitivity = 68.5% was observed (Figure 3). What’s more, the results of reprocessing of VMHC without global signa regression showed the similar results (X = ±33, Y = -18, Z = 45, MNI space; T value = -4.191). However, no difference was detected in UPD patients as for ECM and LI-ECM.Conclusions
The disrupted interhemispheric coordination in bilateral sensorimotor regions may have significant implications for elucidating the mechanisms underlying the hemiparkinsonism and enabling the individual diagnosis and assessment of early PD objectively using VMHC. However, the unchanged ECM and LI-ECM in UPD indicating that the functional connectome was fairly reserved in this early stage.Acknowledgements
This work was supported by the 13th Five-year Plan for National Key Research and Development Program of China (Grant No. 2016YFC1306600), the National Natural Science Foundation of China (Grant Nos. 81571654, 81701647 and 81771820), the Zhejiang Provincial Natural Science Foundation (NO. LSZ19H180001), the Fundamental Research Funds for the Central Universities of China (No. 2017XZZX001-01), the Projects of Medical and Health Technology Development Program in Zhejiang Province (2015KYB174), the 12th Five-year Plan for National Science and Technology Supporting Program of China (No. 2012BAI10B04). We thank all patients with Parkinson’s disease and normal controls who participated in this study.References
[1] Djaldetti R, Ziv I, Melamed E. The mystery of motor asymmetry in Parkinson's disease. Lancet Neurol 2006, 5: 796-802.
[2] Baumann CR, Held U, Valko PO, Wienecke M, Waldvogel D. Body side and predominant motor features at the onset of Parkinson's disease are linked to motor and nonmotor progression. Mov Disord 2014, 29: 207-213.
[3] Li J, Yuan Y, Wang M, Zhang J, Zhang L, Jiang S, et al. Decreased interhemispheric homotopic connectivity in Parkinson's disease patients with freezing of gait: A resting state fMRI study. Parkinsonism Relat Disord 2018, 52: 30-36.
[4] Luo C, Guo X, Song W, Zhao B, Cao B, Yang J, et al. Decreased Resting-State Interhemispheric Functional Connectivity in Parkinson's Disease. Biomed Res Int 2015, 2015: 692684.
[5] Hu X, Zhang J, Jiang X, Zhou C, Wei L, Yin X, et al. Decreased interhemispheric functional connectivity in subtypes of Parkinson's disease. J Neurol 2015, 262: 760-767.
[6] Saenger VM, Barrios FA, Martinez-Gudino ML, Alcauter S. Hemispheric asymmetries of functional connectivity and grey matter volume in the default mode network. Neuropsychologia 2012, 50: 1308-1315.
[7] Agosta F, Caso F, Stankovic I, Inuggi A, Petrovic I, Svetel M, et al. Cortico-striatal-thalamic network functional connectivity in hemiparkinsonism. Neurobiol Aging 2014, 35: 2592-2602.
[8] Zuo XN, Kelly C, Di Martino A, Mennes M, Margulies DS, Bangaru S, et al. Growing together and growing apart: regional and sex differences in the lifespan developmental trajectories of functional homotopy. J Neurosci 2010, 30: 15034-15043.
[9] Murphy K, Birn RM, Handwerker DA, Jones TB, Bandettini PA. The impact of global signal regression on resting state correlations: are anti-correlated networks introduced? Neuroimage 2009, 44: 893-905.
[10] Lohmann G, Margulies DS, Horstmann A, Pleger B, Lepsien J, Goldhahn D, et al. Eigenvector centrality mapping for analyzing connectivity patterns in fMRI data of the human brain. PLoS One 2010, 5: e10232.
[11] Seghier ML. Laterality index in functional MRI: methodological issues. Magn Reson Imaging 2008, 26: 594-601.
Figures