1501
Exploration of structural brain volume changes in patients with early- and middle-late-onset Parkinson's disease using the MPRAGE sequence1Department of MRI, The First Affiliated Hospital of Zhengzhou University, Zhengzhou, China, 2MR Collaboration, Siemens Healthcare Ltd., Beijing, China, 3Advanced Clinical Imaging Technology, Siemens Healthcare AG;Department of Radiology, Lausanne University Hospital and University of Lausanne;LTS5, École Polytechnique Fédérale de Lausanne (EPFL), Lausanne, Switzerland, 4Department of Neurology, The First Affiliated Hospital of Zhengzhou University, Zhengzhou, China
Synopsis
In this study, the structural brain volume changes in early-onset (EOPD) and middle-late-onset Parkinson’s disease (M-LOPD) patients were evaluated. We found different patterns of volume changes in these patients. The results showed that some brain regions might represent a potential imaging marker for the early diagnosis of EOPD and could explain different clinical characteristics. MPRAGE-based morphometry may be a suitable method to provide a reference for EOPD diagnoses in clinical practice.
Introduction/Purpose
Considering the diagnostic challenge of early-onset Parkinson’s disease (EOPD) and its rarity, we evaluated structural brain volume changes in EOPD and middle-late-onset PD (M-LOPD) patients. We aimed to aid in early EOPD diagnosis and to explain different clinical manifestations.Methods
We recruited 21 EOPD (Group 1, age: 48.4 ± 5.2 years, 11 (52.4%) male) and 85 M-LOPD (Group 2, age: 62.9 ± 7.1 years, 39 (45.9%) male) patients, and 21 young (YC, Group 3, age: 48.04 ± 5.24 years, 11 (52.4%) male) and 85 old (OC, Group 4, age: 63.3 ± 7.2 years, 41 (48.2% ) male) controls. All the subjects were scanned on a 3T MRI scanner (MAGNETOM Prisma, Siemens Healthcare, Erlangen, Germany) with a 64-channel head/neck coil. The MRI examinations consisted of a high-resolution, magnetization-prepared, rapid gradient echo (MPRAGE) prototype sequence. This prototype sequence included a brain morphometry analysis [1]. Tissue classification and morphometric reports are generated in-line directly after data acquisition. The acquisition parameters included: TR/TE = 2300 ms/2.9 ms, TI = 900 ms, flip angle = 9°, FOV = 256 × 256 mm2, voxel size = 1.0 × 1.0 × 1.2 mm3, iPAT factor = 2, and acquisition time = 5:12 mins. Structural brain volumes were automatically calculated. The relative volume, defined as the volume ratio of one brain region to that of the total intracranium, was used for the statistical analysis. The independent sample t-test was used to analyze the difference in brain volume between the YC and EOPD group and the OC and M-LOPD group using SPSS 22.0 (IBM Corp., Armonk/NY, USA). A P-value < 0.05 was considered statistically significant.Results
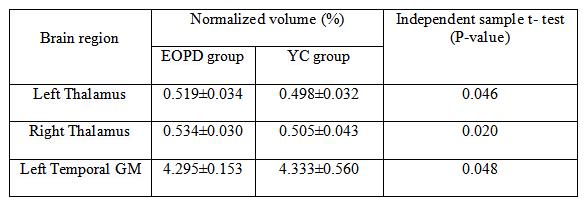
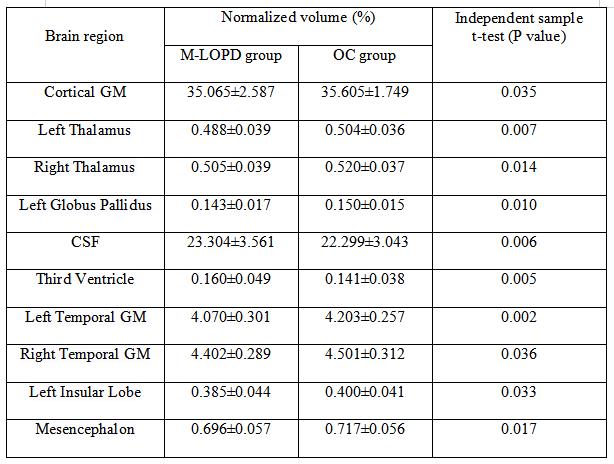
The bilateral thalamus volumes in the EOPD group were significantly greater than those in the YC group. The left temporal grey matter (GM) volumes in the EOPD group were significantly smaller than those in the YC group (Table 1). The volumes of the bilateral thalamus, bilateral temporal grey matter, cortical GM, left globus pallidus, left insular lobe, and mesencephalon in the M-LOPD group were significantly smaller than those in the OC group. In contrast, the cerebrospinal fluid (CSF) and third-ventricle volumes in the M-LOPD group were significantly greater than those in the OC group (Table 2).Discussion
The onset of abnormal age-related brain changes in PD are associated with several distinct symptoms [2]. However, little is known about the different structural brain changes in EOPD and M-LOPD patients. In previous research, methods of measuring the volume of morphological changes were complex and time-consuming [3]. In this study, the brain volume report was integrated into the MPRAGE prototype sequence, which makes it simple, quick, and convenient for use in clinical practice.This study showed that some brain structural changes appear in EOPD patients. Those changes may represent a potential imaging marker for the early diagnosis of EOPD. Remarkably, the volume of some brain structures increased in EOPD patients, likely highlighting continuous compensatory efforts for slowing disease progression in EOPD patients. This study also showed that several different brain structural changes appear in EOPD and M-LOPD patients, possibly because EOPD is associated with less cognitive decline, earlier motor complications, more manageable anxiety disorders, and other distinct symptoms compared with M-LOPD. There were more atrophic brain structures in the limbic system of the M-LOPD patients. Atrophy of the limbic system is associated with a decline in memory and cognitive function in PD patients [4]. The same brain structural changes in M-LOPD patients may explain the greater cognitive decline in M-LOPD patients.
Conclusion
We found different structural brain changes in EOPD and M-LOPD patients. The MPRAGE prototype sequence is more suitable for the evaluation of brain volume changes in clinical practice. This could serve as a reference for EOPD diagnoses and could also explain the different clinical manifestations of EOPD and M-LOPD.Acknowledgements
None.References
[1] Schmitter D, Roche A, Maréchal B, et al. An evaluation of volume-based morphometry for prediction of mild cognitive impairment and Alzheimer's disease. Neuroimage Clinical, 2015, 7(C):7-17.
[2] Xuan Min, Guan Xiaojun, Huang Peiyu et al. Different patterns of gray matter density in early- and middle-late-onset Parkinson's disease: a voxel-based morphometry study. Brain Imaging Behav, 2019, 13: 172-179.
[3] Fioravanti V, Benuzzi F, Codeluppi L, et al. MRI correlates of Parkinson's disease progression: a voxel based morphometry study. Parkinson’s Disease, 2015, 2015:378032.
[4] Gao Yuyuan, Nie Kun, Huang Biao et al. Changes of brain structure in Parkinson's disease patients with mild cognitive impairment analyzed via VBM technology. Neurosci. Lett., 2017, 658: 121-132.
Figures