1499
The Cerebral Blood Flow Changes in Parkinson’s Disease with Mild Cognitive Impairment Using Arterial Spin Labeling MRI1Biomedical Engineering Institution, Bogazici University, Istanbul, Turkey, 2Behavioral Neurology and Movement Disorders Unit, Department of Neurology, Istanbul Faculty of Medicine, Istanbul University, Istanbul, Turkey, 3Neuroimaging Unit, Hulusi Behcet Life Sciences Research Center, Istanbul University, Istanbul, Turkey, 4Department of Physiology, Faculty of Medicine, Demiroglu Bilim University, Istanbul, Turkey, 5Department of Neuroscience, Aziz Sancar Institute of Experimental Medicine, Istanbul University, Istanbul, Turkey, 6Department of Psychology, Faculty of Arts and Sciences, Isik University, Istanbul, Turkey, 7CorTechs Labs, San Diego, CA, United States, 8Department of Physiology, Istanbul Faculty of Medicine, Istanbul University, Istanbul, Turkey
Synopsis
The main aim of this study is to define possible brain perfusion-based signatures based on voxelwise comparison of cerebral blood flow (CBF) maps of Parkinson’s disease (PD) with mild cognitive impairment, cognitively normal PD and healthy controls. CBF maps were calculated by fitting a general kinetic curve model with Look-Locker readout for each pixel of arterial spin
INTRODUCTION
The current clinical practice employs arbitrarily predefined standard deviations of neuropsychological test scores to identify the cognitive impairment in Parkinson’s disease (PD).1 Therefore, there is a need for objective biomarkers to identify the cognitive impairment in PD. 2 Arterial spin labeling MRI (ASL-MRI) noninvasively measures cerebral blood flow (CBF).3 The main aim of this study was to assess voxel-based perfusion differences of PD with mild cognitive impairment (PD-MCI), cognitively normal PD (PD-CN) and healthy controls (HC).METHODS
27 PD-MCI patients, 26 PD-CN patients, and 15 HC, who were previously diagnosed based on an extensive neuropsychological test battery, were included in this study. All subjects provided written informed consent. ASL-MR images of the subjects were acquired using signal targeting with alternating radio-frequency labeling with Look-Locker sequence at six slices with eight different inversion times. ASL-MRI acquisition was repeated three times to cover the whole brain. A program was written in MATLAB R2018a (MathWorks Inc., Natick, MA) to calculate CBF maps using the general kinetic model combined with arterial blood volume correction and the flip angle effect.4, 5 After CBF maps were registered into MNI152 brain atlas using FMRIB Software Library (FSL) (http://fsl.fmrib.ox.ac.uk/fsl/fslwiki/), statistical analyses of CBF maps were performed with SPM12 software package (http://www.fil.ion.ucl.ac.uk/spm/). The CBF maps of HC, PD-CN, and PD-MCI were compared using a one-way ANOVA followed by pair-wise post hoc comparisons. Regions were considered statistically significant at a cluster forming uncorrected threshold of P < 0.005 and cluster level family–wise error corrected (FWE) P < 0.05 with a minimum cluster size of 50 voxels for main ANOVA findings and pair-wise post hoc comparisons. The MNI coordinates produced by the whole brain voxelwise statistical analyses were visually matched to 100 parcellations of the cerebral cortex defined by Schaefer et al. 6 corresponding to Yeo et al.’s 7 seven resting state functional MRI (rs-fMRI) networks. For the cerebellar components, the MNI coordinates were matched to functional connectivity maps proposed by Buckner et al. 8RESULTS
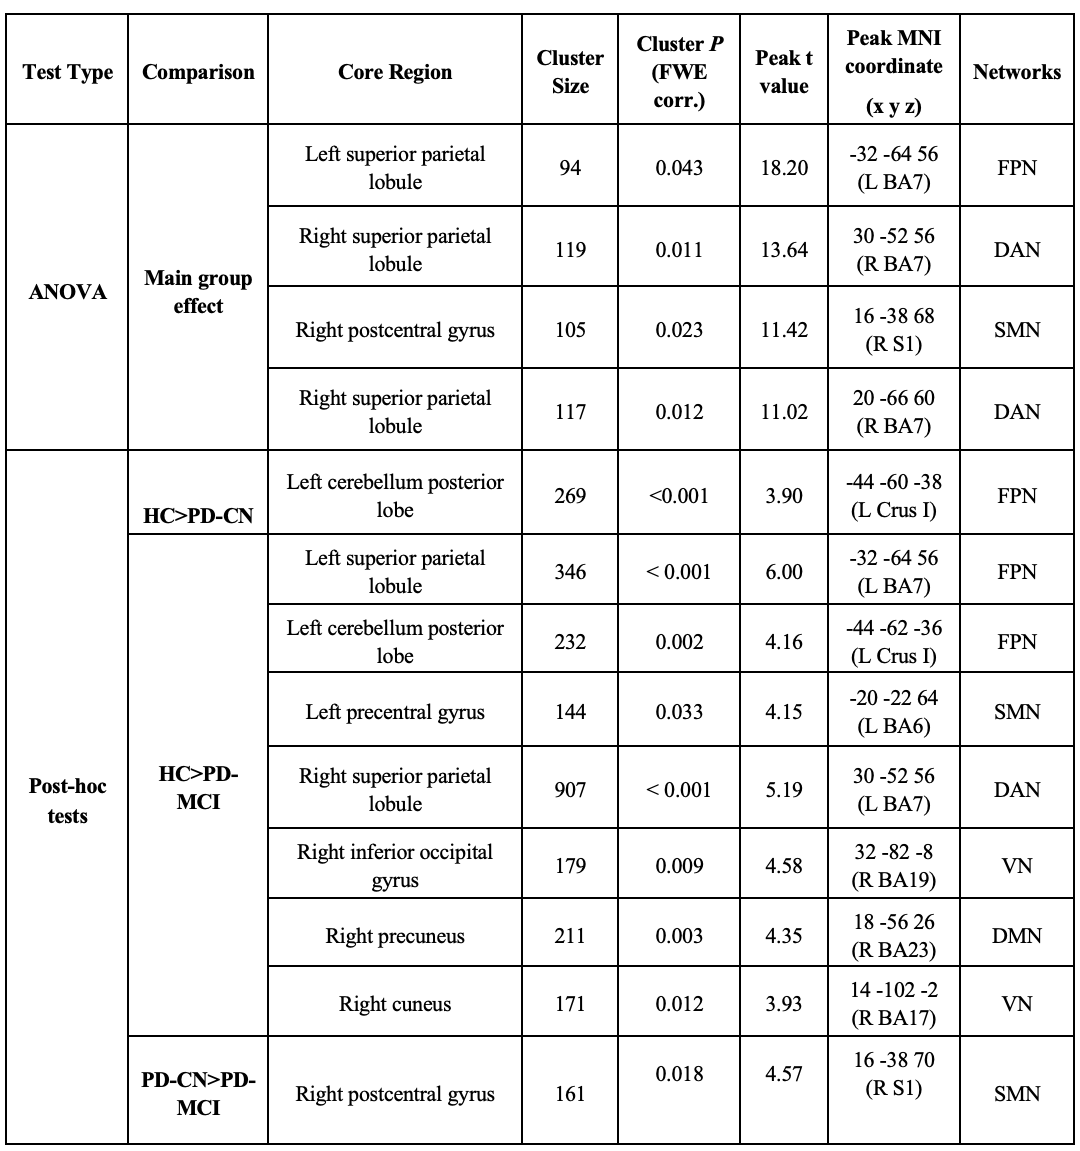
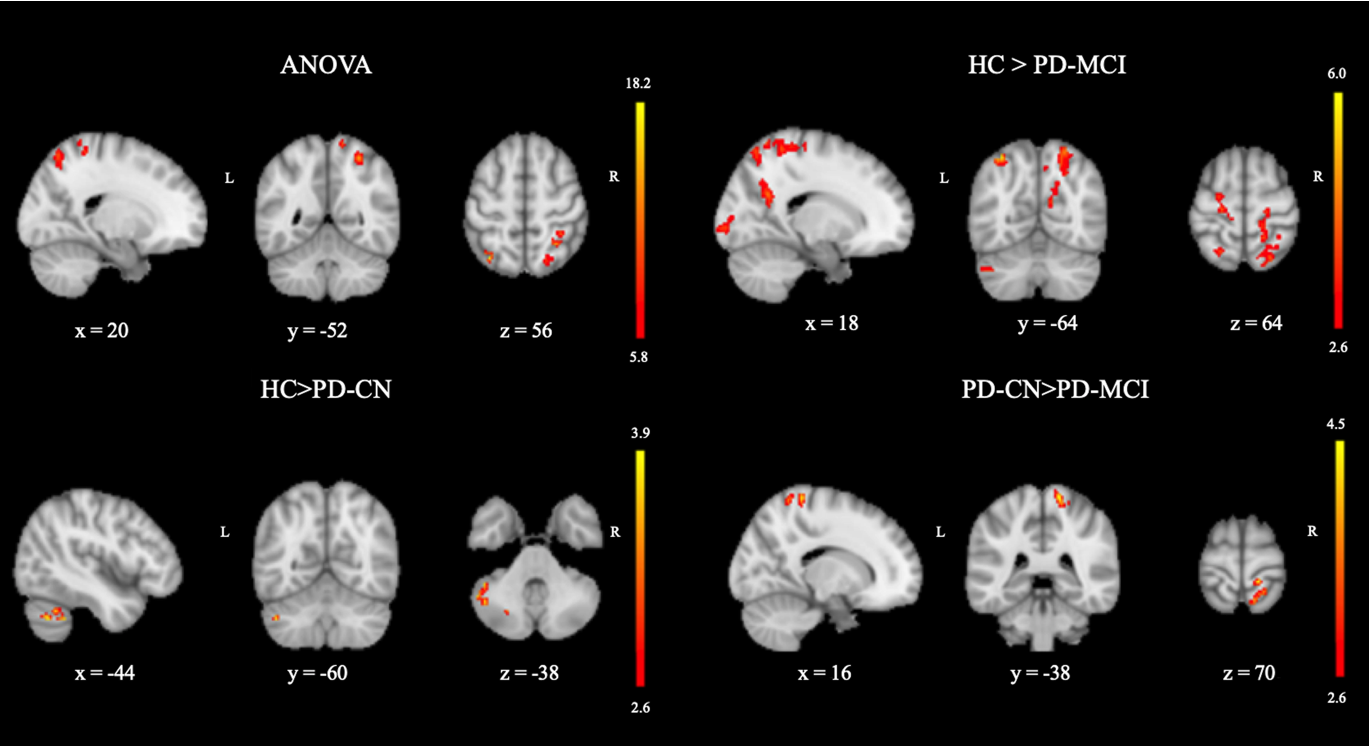
Voxelwise CBF differences were found between HC, PD-CN, and PD-MCI groups at the left superior parietal lobule (SPL) of the fronto-parietal network (FPN), right SPL of the dorsal attention network (DAN) and right postcentral gyrus (postCG) of FPN (Table 1). PD-CN patients had decreased CBF values than HC in left cerebellum posterior lobe part of (P<0.001). CBF values of PD-MCI were lower in some areas, such as left cerebellum posterior lobe part of FPN (P < 0.002), right SPL part of dorsal attention network (DAN) (P < 0.001), left SPL part of FPN (P < 0.001), left precentral gyrus of sensorimotor network (SMN ) (P = 0.033), right inferior occipital gyrus part of visual network (VN) (P = 0.009), the right precuneus part of default mode network (DMN) (P = 0.003), and the right cuneus of VN (P = 0.012) than HC. Finally, PD-MCI had lower perfusion in postCG part of SMN (P = 0.018) than PD-CN. These statistically significantly different brain regions are depicted in Figure 1.DISCUSSION AND CONCLUSION
The results of this study indicated that posterior hypoperfusion (PH) was seen in the lateral and medial parietooccipital cortices, corresponding to posterior components of DAN, FPN, DMN, and VN. Cerebellar hypoperfusion of FPN was the only discriminating area in the PD-CN and HC comparison while decreased perfusion in right post central gyrus of SMN was the only discriminating area in the PD-MCI and PD-CN comparison. In the literature, some studies reported a relationship between PH and cognitive impairment in PD using ASL-MRI technique. 9-12 Also some other studies, such as resting state functional MRI and proton MR spectroscopy, reported PH pattern in PD. 13-14 In conclusion, PH pattern detected by ASL-MRI might be as objective imaging biomarker to track cognitive decline in PD.Acknowledgements
This study was supported by TUBITAK project #115S219 and Istanbul University Scientific Research Projects Unit project #1567/42362.References
1. Hughes AJ, Daniel SE, Kilford L, Lees AJ. Accuracy of clinical diagnosis of idiopathic Parkinson's disease: a clinico-pathological study of 100 cases. J Neurol Neurosurg Psychiatry 1992;55(3):181-184.
2. Janvin CC, Larsen JP, Aarsland D, Hugdahl K. Subtypes of mild cognitive impairment in Parkinson's disease: progression to dementia. Mov Disord 2006;21(9):1343-1349.
3. Petcharunpaisan S, Ramalho J and Castillo M. Arterial spin labeling in neuroimaging. World J Radiol. 2010; 2: 384-98.
4. Gunther M, Bock M and Schad LR. Arterial spin labeling in combination with a look-locker sampling strategy: inflow turbo-sampling EPI-FAIR (ITS- FAIR). Magn Reson Med. 2001; 46: 974-84.
5. Chappell MA, MacIntosh BJ, Donahue MJ, Gunther M, Jezzard P and Woolrich MW. Separation of macrovascular signal in multi-inversion time arterial spin labelling MRI. Magn Reson Med. 2010; 63: 1357-65.
6. Schaefer A, Kong R, Gordon EM, et al. Local-Global Parcellation of the Human Cerebral Cortex from Intrinsic Functional Connectivity MRI. Cereb Cortex. 2018; 28: 3095-114.
7. Yeo BT, Krienen FM, Sepulcre J, et al. The organization of the human cerebral cortex estimated by intrinsic functional connectivity. J Neurophysiol 2011;106(3):1125-1165.
8. Buckner RL, Krienen FM, Castellanos A, Diaz JC, Yeo BT. The organization of the human cerebellum estimated by intrinsic functional connectivity. J Neurophysiol 2011;106(5):2322-2345.
9. Melzer TR, Watts R, MacAskill MR, et al. Arterial spin labelling reveals an abnormal cerebral perfusion pattern in Parkinson's disease. Brain 2011;134(Pt 3):845-855.
10. Syrimi ZJ, Vojtisek L, Eliasova I, et al. Arterial spin labelling detects posterior cortical hypoperfusion in non-demented patients with Parkinson's disease. J Neural Transm (Vienna) 2017;124(5):551-557.
11. Kamagata K, Motoi Y, Hori M, et al. Posterior hypoperfusion in Parkinson's disease with and without dementia measured with arterial spin labeling MRI. J Magn Reson Imaging 2011;33(4):803-807.
12. Jia X, Li Y, Li K, Liang P, Fu X. Precuneus Dysfunction in Parkinson's Disease With Mild Cognitive Impairment. Front Aging Neurosci 2018;10:427.
13. Nie K, Zhang Y, Huang B, et al. Marked N-acetylaspartate and choline metabolite changes in Parkinson's disease patients with mild cognitive impairment. Parkinsonism Relat Disord 2013;19(3):329-334.
14. Pievani M, de Haan W, Wu T, Seeley WW, Frisoni GB. Functional network disruption in the degenerative dementias. Lancet Neurol 2011;10(9):829-843.
Figures