1495
Magnetic Resonance Fingerprinting May Differentiate Parkinson’s Disease From Healthy Controls1Department of Medical Imaging, Henan Provincial People's Hospital, Zhengzhou, China, 2MR Pre-development, Siemens Healthcare, Erlangen, Germany, 3MR Collaboration, Siemens Healthcare Ltd, Beijing, China
Synopsis
Magnetic resonance parametric mapping techniques such as T1 and T2 relaxation time mapping have been used to capture the potential Parkinson’s disease (PD)-related changes in the substantia nigra (SN). However, the findings in different studies were inconsistent. This study utilized a novel technique magnetic resonance fingerprinting (MRF) to obtain T1 and T2 values on thirty patients with PD and thirty matched healthy controls. Comparison results found that T1 values of the left and right SN in the PD patients were significantly higher than in healthy controls. T1 values in the SN acquired by MRF may differentiate PD from healthy controls.
Introduction
The substantia nigra (SN) plays an important role in the progression of Parkinson’s disease (PD). Magnetic resonance parametric mapping techniques such as T1 and T2 relaxation time mapping have been used to capture the potential PD-related changes in the SN. However, the findings in different studies were inconsistent. MR fingerprinting (MRF) is a new MRI technique that allows simultaneous quantification of T1 and T2 relaxometry with high repeatability and reproducibility [1]. The purpose of this study was to use MRF to investigate the potential T1 and T2 alteration in SN by comparing the results in the patients with PD and healthy controls.Methods
This study enrolled 30 patients with Parkinson’s disease and 30 age and gender matched healthy controls (16 males, 14 females; age range, 51-67 years). All patients and healthy controls were scanned on a 3T MAGNETOM Skyra scanner (Siemens Healthcare, Erlangen, Germany) equipped with a 20-channel head/neck coil. A prototype spiral FISP MRF (FOV= 256 x 256 mm2; matrix= 256 x 256; slice thickness = 5 mm; flip angle variable = 0°– 74°; a random TR between 12.1 ms and 15.0 ms; 3000 measurements; 41s/slice; 5 slices) was performed on all patients and healthy controls. The quantitative T1 and T2 maps were simultaneously generated by matching the acquired signal to the dictionary. For each participant, regions of interest (ROI) were manually drawn on the T2 map to extract the left and right SN. Then, the ROI were copied to the T1 map. Mann-Whitney U test was used to evaluate the difference of T1 and T2 values in the left and right SN between the two groups. P < 0.05 was considered statistically significant.Results
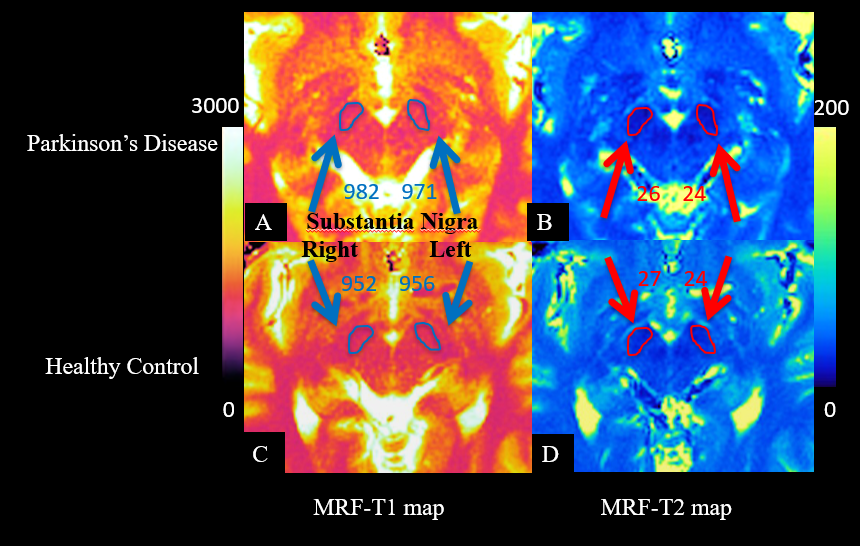
The T1 value of the left and right SN in the PD patients (mean ± standard deviation, left SN: 973 ± 33 ms; right SN: 976 ± 38 ms) was significantly higher than that of the healthy controls (left SN: 938 ± 31 ms; right SN: 950 ± 34 ms; both p < 0.05) (Figure 1). The T2 value of the left and right SN had no significant differences between the two groups (both p > 0.05).Discussion and Conclusion
PD is a common neurodegenerative disorder characterized by severe loss of dopaminergic neurons and neuromelanin in the SN. Aimed at finding potential in-vivo biomarkers for detecting this pathological alteration, previous studies have used different methods to quantify the T1 and T2 value of SN in PD. However, the results were controversial. For example, Menke et al found that the T1 values in SN were slightly higher in PD patients than in healthy controls but not significant [2]. Baudrexel et al found significantly reduced T1 values in the SN of PD patients [3]. This study found that the T1 relaxation time in the bilateral SN of PD patients was significantly higher than that of healthy controls, which may be caused by the neuromelanin loss and increased free water in the SN. Neuromelanin can induce paramagnetic T1-shortening effects when combined with metals such as iron and copper, however, diminished neuromelanin levels were found in the substantia nigra pars compacta in PD using 3T MR neuromelanin-contrast imaging [4]. Furthermore, a 4-year multi-site imaging study found that free water in the posterior SN was elevated in Parkinson’s disease compared to controls [5]. Whereas there was no significant difference in the T2 relaxation time between the two groups, suggesting that the quantitative T2 relaxation time has limitations in detecting the pathological alteration in the SN of PD patients, because the iron deposition and free water content has opposite effect on T2 [6].In conclusion, results of this study indicate that the T1 value in the SN yielded by MRF have great potential to differentiate PD from healthy controls.
Acknowledgements
This research was supported by the National Natural Science Foundation of China (81601466, 81720108021), National Key R&D Program of China (2017YFE0103600), Scientific and Technological Research Project of Henan Province (182102310496), Medical Science and Technology Research Project of Henan Province (2018020403), and Zhongyuan Thousand Talents Plan Project-- Basic Research Leader Talent (ZYQR201810117).References
[1] Ma D, Gulani V, Seiberlich N, et al. Magnetic resonance fingerprinting. Nature. 2013;495(7440):187-92.
[2] Menke R A, Scholz J, Miller K L, et al. MRI characteristics of the substantia nigra in Parkinson's disease: a combined quantitative T1 and DTI study. Neuroimage, 2009; 47(2): 435-41.
[3] Baudrexel S, Nürnberger L, Rüb U, et al. Quantitative mapping of T1 and T2* discloses nigral and brainstem pathology in early Parkinson's disease. Neuroimage, 2010;51(2): 512-20.
[4] Kitao S, Matsusue E, Fujii S, et al. Correlation between pathology and neuromelanin MR imaging in Parkinson’s disease and dementia with Lewy bodies. Neuroradiology, 2013;55(8): 947-53.
[5] Burciu RG, Ofori E, Archer DB, et al. Progression marker of Parkinson's disease: a 4-year multi-site imaging study. Brain. 2017;140(8):2183-92.
[6] Haacke EM, Cheng NYC, House MJ, et al. Imaging iron stores in the brain using magnetic resonance imaging. Magn Reson Imaging 2005; 23(1):1-25.
Figures