1493
Establishing and evaluating reference atrophy ranges from consecutive image pairs in brain MR volumetry1Department of Radiology, Lausanne University Hospital and University of Lausanne, Lausanne, Switzerland, 2Advanced Clinical Imaging Technology, Siemens Healthcare, Lausanne, Switzerland, 3LTS5, Ecole Polytechnique Fédérale de Lausanne (EPFL), Lausanne, Switzerland
Synopsis
Estimating clinical significance of changes in regional brain volumetry using only two consecutive images is difficult because algorithmic measurement error dominates actual biological changes in short-term (less than a year) follow-up imaging. Here, we evaluate an approach to compute reference ranges from image pairs, using empirical Bayesian regularization. With over 6400 image pairs, we evaluate the impact of regularization strength and time between images. Regularization is essential; optimal regularization amount depends on brain region. Increased time between pairs of images improves clinical discrimination in dementia. We recommend a minimum of eight months to one year to obtain discriminative atrophy estimates.
Introduction
It was previously shown that short-term atrophy rate estimates from two images taken one year apart are improved by empirical Bayesian regularization using a random effects model trained on a large longitudinal dataset1. This is an advantageous solution that does not require multiplying acquisitions within a short period or waiting several years for the disease to become manifest. Here, we evaluate this technique further, including data from different field strengths, and propose a simple approach to building a reference range out of the regularized estimates. Using dementia as an example, we show that discrimination between healthy controls and Alzheimer patients using regularized atrophy rates critically depends on the time interval between the two images.Materials and Methods
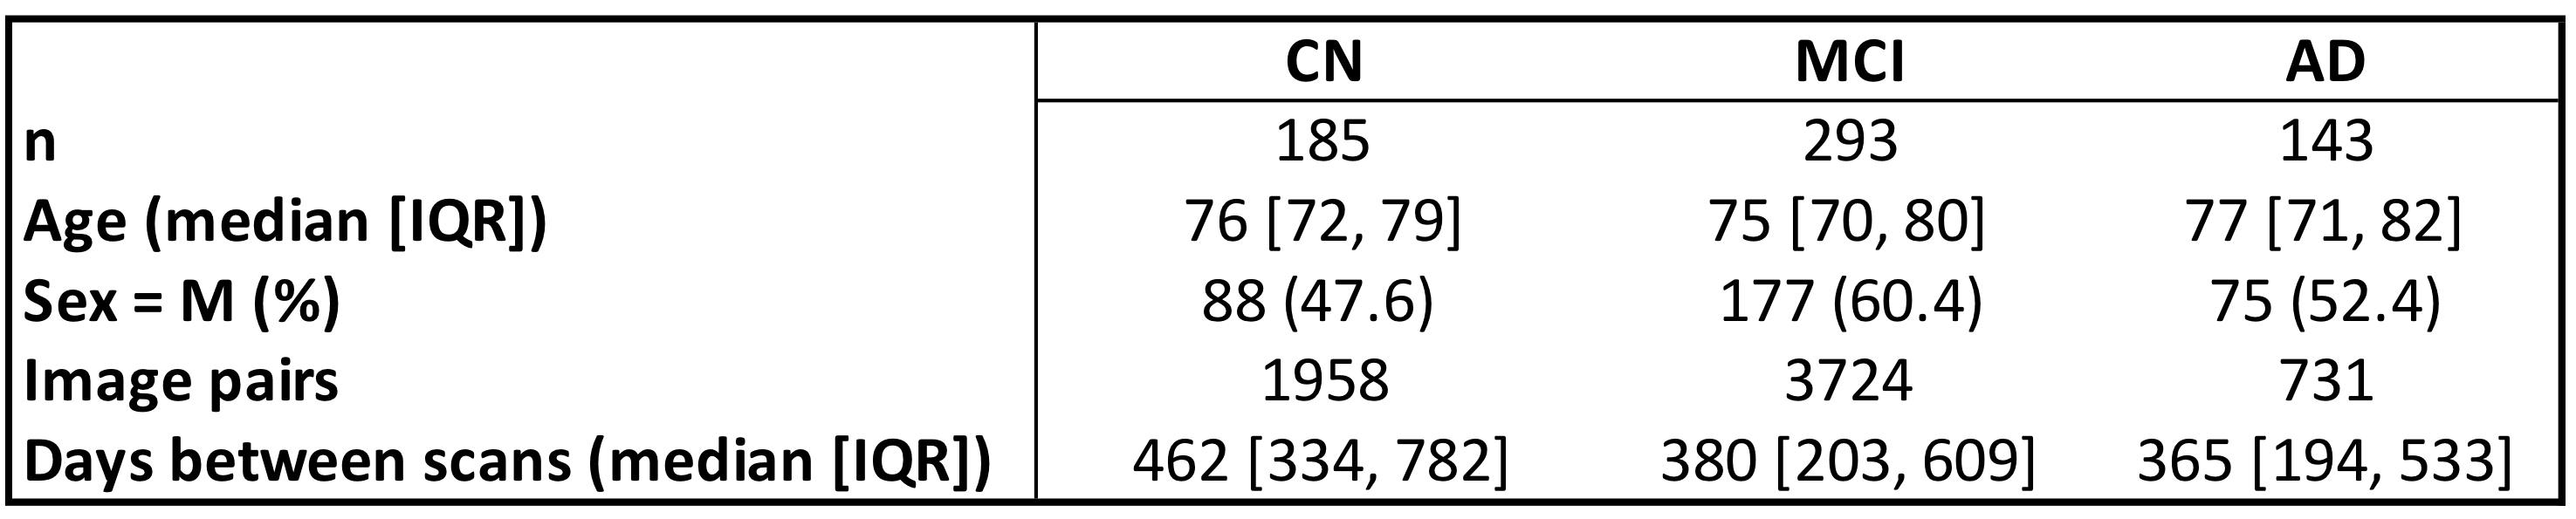
DatasetWe used 1.5T and 3T T1-weighted MPRAGE images acquired on scanners from different vendors from ADNI with uniform preprocessing1 (gradwarp correction, B1 nonuniformity correction, and N3 bias field correction) from 185 cognitively normal subjects (CN), 293 patients with mild cognitive impairment (MCI), and 143 AD patients, distributed between 47 ADNI sites (Figure 2), for a total of 6413 intra-subject longitudinal image pairs.
Image processing and volumetry
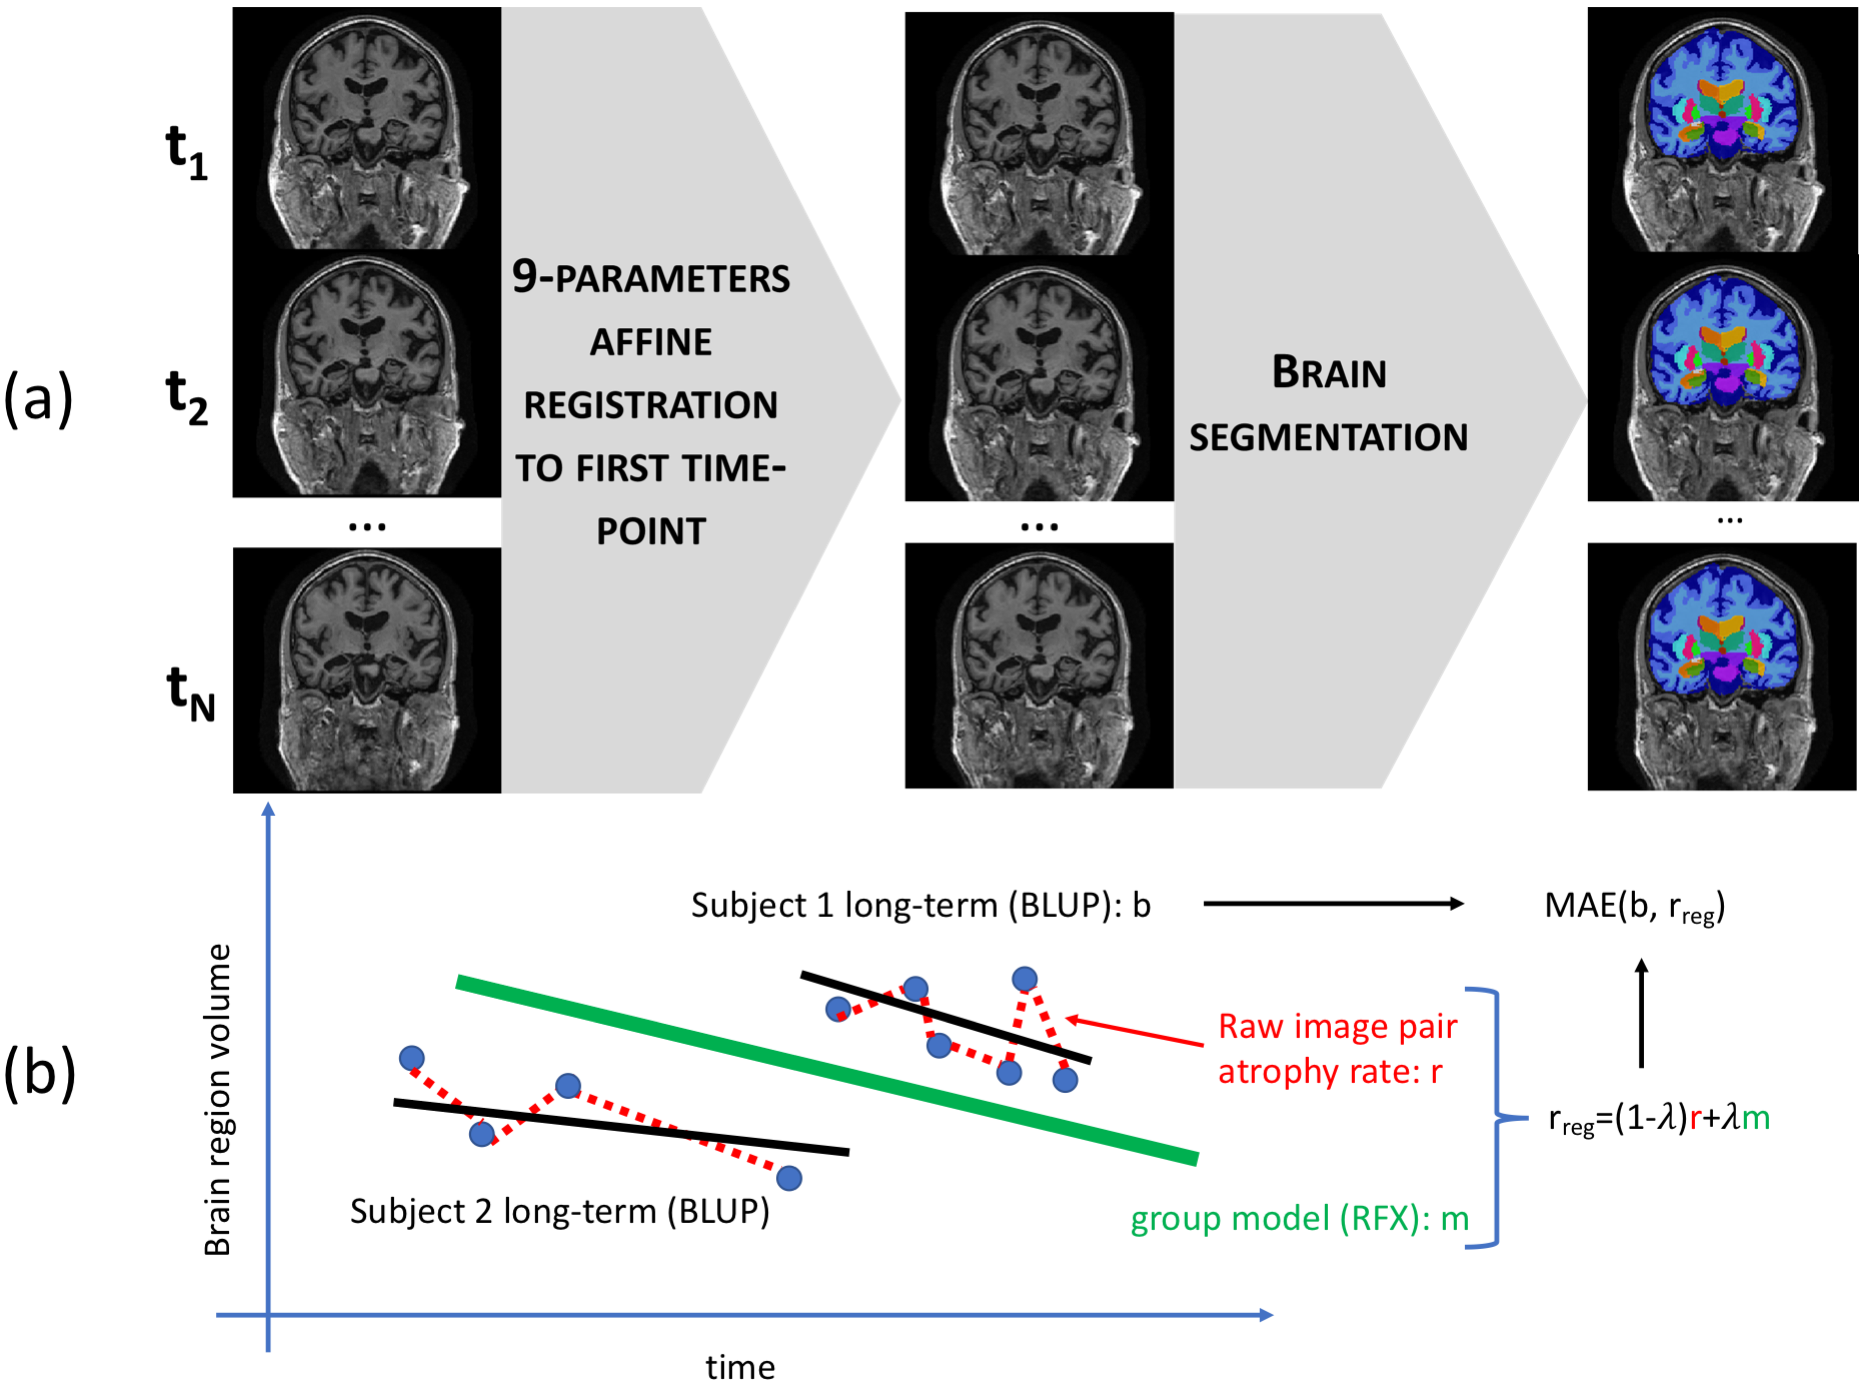
Each subject’s images were registered to their first time point using affine registration. We computed volumes for brain parenchyma, ventricles, right hippocampus, and right temporal lobe gray matter with the MorphoBox prototype2. Figure 1a illustrates the procedure.
Atrophy rate computation
As in previous work3, the raw percentage change $$$p$$$ of each region between two images was computed as $$p = (V_{new}-V_{old})/V_{old},$$ where $$$V_{new}$$$ is regional volume in the newest image, and $$$V_{old}$$$ is for the oldest image. Raw annual atrophy rates $$$r$$$ were computed as $$r = p/d*365,$$ with $$$d$$$ the time in days between the two acquisitions. Note that small values for $$$d$$$ can lead to artificially inflating the percentage change. The regularized estimate was obtained as $$r_{reg}=(1-\lambda)r + \lambda m,$$ where $$$m$$$ is the fixed-effect coefficient for Age (in years) from a log-linear random effects model trained on all available longitudinal data points from CN subjects, and $$$\lambda$$$ was set to 0.7 (Figure 1b).
Reference range
To obtain a region-specific reference range, we computed the 10th percentile (90th for ventricles) regularized estimates for each region. This is similar to the approach of Ledig et al4 but uses regularized instead of raw estimates. This choice of percentile should be tuned for application-specific sensitivity and specificity needs.
Evaluation
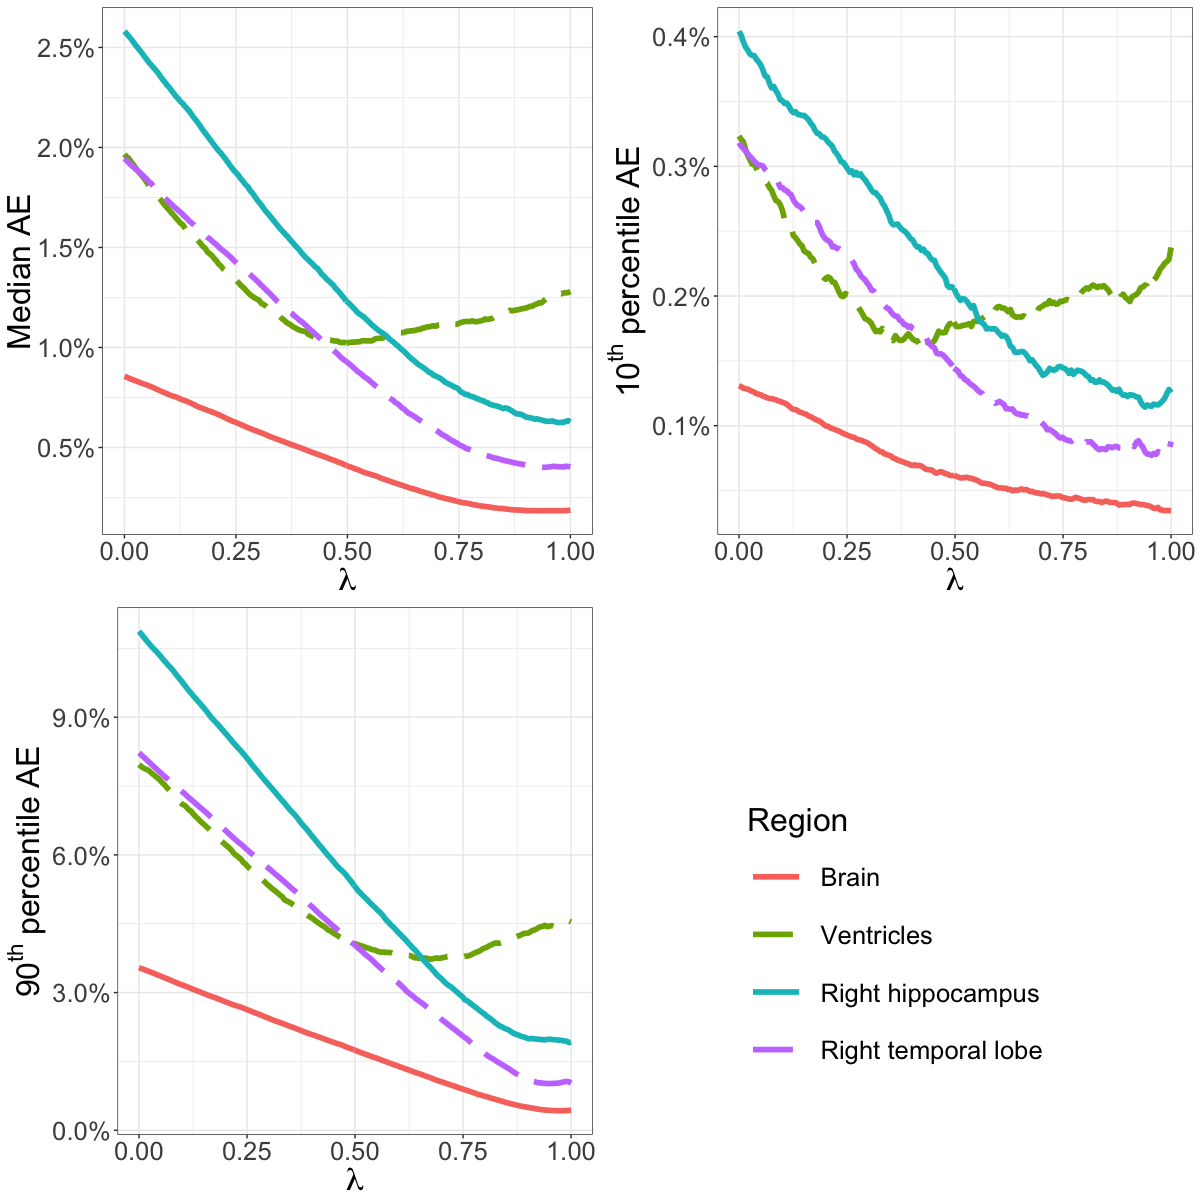
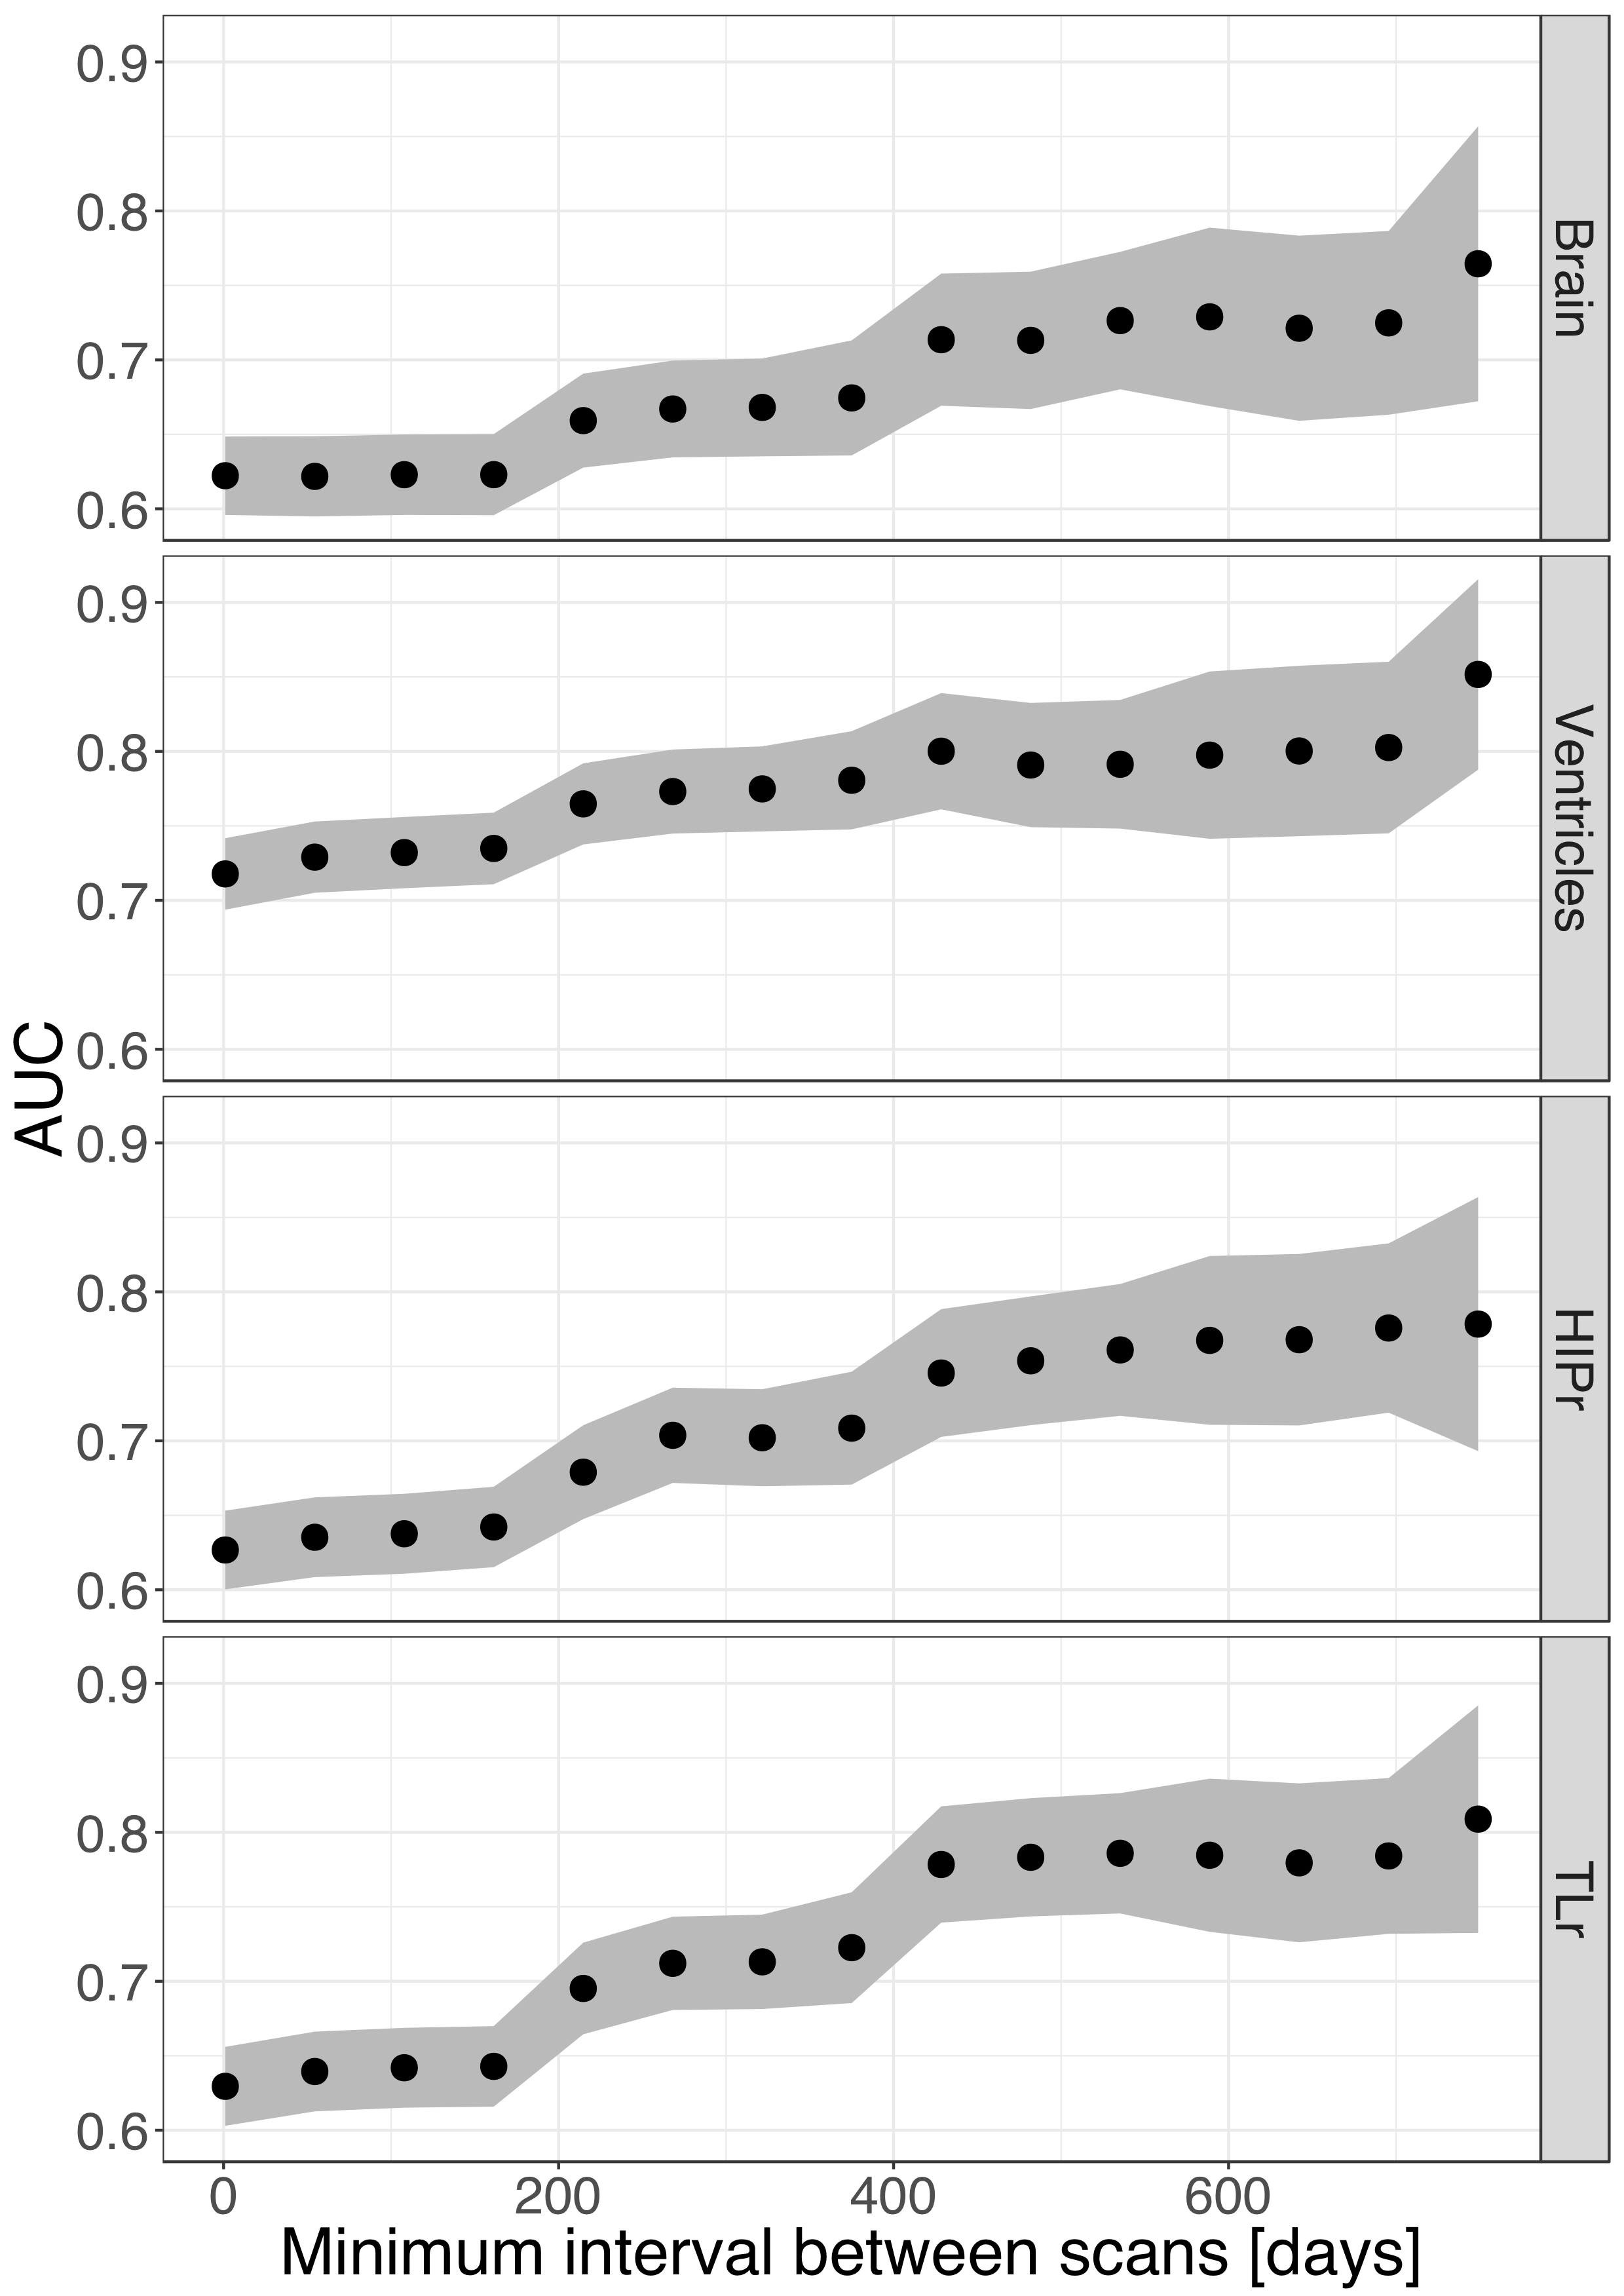
To evaluate the effect of regularization strength, we compared each regularized estimate $$$r_{reg}$$$ to the best linear unbiased predictor (BLUP) for each subject, obtained from the random effects model (Figure 1b). This includes all available time points and represents a silver standard for individual regional atrophy. The regularization constant was swept from 0 to 1 by 5x10-3 increments; we computed the median absolute error (AE) to focus on typical errors, as well as 90th and 10th percentiles of the AE distribution to focus on the worse and best estimation errors. To evaluate the impact of the time interval between consecutive image pairs on clinical discrimination, we computed the area under the ROC curve (AUC) when using regularized atrophy rate as an imaging marker to discriminate CN from AD subjects. We looked at 15 time intervals (from 1 day to a maximum of 749 days). We also computed parametric 95% confidence intervals around the AUC point estimates.
Results
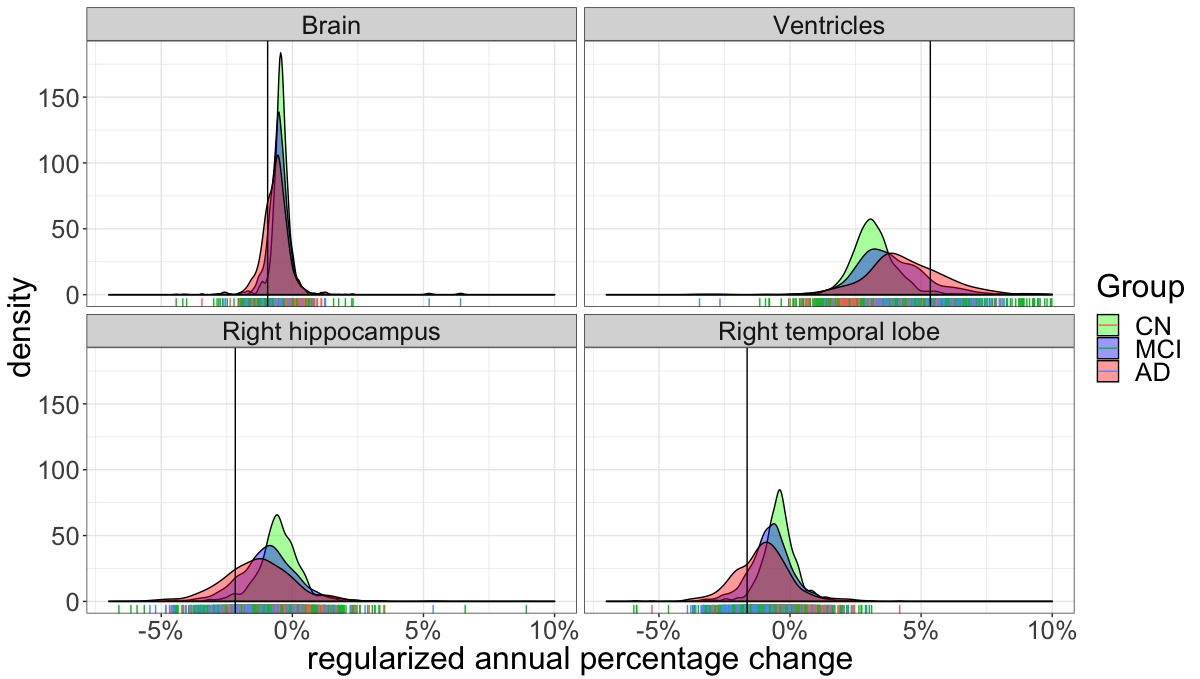
Even though controls had on average lower atrophy and hypertrophy than patients, there was significant overlap between CN distributions and patient distributions for all brain structures (Figure 3 shows a subset). For all structures tested, the regularized atrophy estimate outperformed the raw atrophy estimate (Figure 4). This was true not only for typical cases (median AE) but also for the worst (90th AE percentile) and the best (10th AE percentile) estimations. The optimal $$$\lambda$$$ varied depending on the structure, but structures other than the ventricles seem to need high regularization (0.5 or above). In terms of inter-image time interval, atrophy estimates from image pairs less than 8 months apart seem to yield notably worse CN vs. AD discrimination performance (Figure 5).Discussion and Conclusions
Our results further underscore the need for regularization in the clinically relevant case where few images are available. Most structures show raw atrophy estimates that are not plausible given known biological processes, and mostly reflect measurement variability, comprised of hardware noise and algorithmic components. The use of regularization offers promising improvements that bring atrophy estimates more in line with what can be expected biologically.Beyond post-hoc statistical regularization, one avenue forward is to improve longitudinal image processing, mostly by ensuring repeatability of automated segmentation and volumetry computations.
Overall, the conclusion of this work is twofold: first, that regularization is necessary to improve atrophy estimates obtained in clinical scenarios, where typically only two images are available. Second, that in the case of a neurodegenerative diseases like Alzheimer’s, the time between consecutive images should be at least 8 months in order to reliably distinguish diagnosis groups. This guideline is of course dependent on specific acquisition hardware and image processing algorithms and should be evaluated on a case-by-case basis – the proposed framework is agnostic to the volumetry algorithm.
Acknowledgements
Data collection and sharing for this project was funded by the Alzheimer's Disease Neuroimaging Initiative (ADNI) (National Institutes of Health Grant U01 AG024904) and DOD ADNI (Department of Defense award number W81XWH-12-2-0012). ADNI is funded by the National Institute on Aging, the National Institute of Biomedical Imaging and Bioengineering, and through generous contributions from the following: AbbVie, Alzheimer’s Association; Alzheimer’s Drug Discovery Foundation; Araclon Biotech; BioClinica, Inc.; Biogen; Bristol-Myers Squibb Company; CereSpir, Inc.; Cogstate; Eisai Inc.; Elan Pharmaceuticals, Inc.; Eli Lilly and Company; EuroImmun; F. Hoffmann-La Roche Ltd and its affiliated company Genentech, Inc.; Fujirebio; GE Healthcare; IXICO Ltd.; Janssen Alzheimer Immunotherapy Research & Development, LLC.; Johnson & Johnson Pharmaceutical Research & Development LLC.; Lumosity; Lundbeck; Merck & Co., Inc.; Meso Scale Diagnostics, LLC.; NeuroRx Research; Neurotrack Technologies; Novartis Pharmaceuticals Corporation; Pfizer Inc.; Piramal Imaging; Servier; Takeda Pharmaceutical Company; and Transition Therapeutics. The Canadian Institutes of Health Research is providing funds to support ADNI clinical sites in Canada. Private sector contributions are facilitated by the Foundation for the National Institutes of Health (www.fnih.org). The grantee organization is the Northern California Institute for Research and Education, and the study is coordinated by the Alzheimer’s Therapeutic Research Institute at the University of Southern California. ADNI data are disseminated by the Laboratory for Neuro Imaging at the University of Southern California.References
1. Jack C R et al. Update on the magnetic resonance imaging core of the Alzheimer’s disease neuroimaging initiative. Alzheimers Dement. 6, 212–220 (2010).
2. Schmitter D et al. An evaluation of volume-based morphometry for prediction of mild cognitive impairment and Alzheimer’s disease. NeuroImage Clin. 7, 7–17 (2015).
3. Richiardi J et al. Towards clinically useful individual regional brain atrophy rates: bridging long- and short-term longitudinal volume change estimates, Proc. ISMSM 2019
4. Ledig C et al. Structural brain imaging in Alzheimers disease and mild cognitive impairment: biomarker analysis and shared morphometry database. Sci. Rep. 8, (2018).
Figures