1492
Aberrant cerebral blood flow in patients with subjective cognitive decline: a whole-brain atlas based analysis1Radiology department, The First Affiliated Hospital of Nanjing Medical University, Nanjing, China, 2Rehabilitation Department, The First Affiliated Hospital of Nanjing Medical University, Nanjing, China, 3Rehabilitation Department, Nanjing Drum Tower Hospital, The Affiliated Hospital of the Medical School at Nanjing University, Nanjing, China, 4Nanjing Medical University, Nanjing, China, 5MR Research China, GE Healthcare, Beijing, China
Synopsis
In this study, the whole brain cerebral blood perfusion (CBF) values have been respectively investigated for patients with subjective cognitive decline (SCD) and mild cognitive impairment (MCI) and healthy controls (HCs). Significantly lower CBF values for the left superior frontal gyrus, left middle frontal gyrus, and left caudate nucleus regions have been shown in SCD patients than HCs. Additionally, the CBFs at these regions also showed strong correlations with multiple clinical scales. Therefore, CBF can be considered an effective tool in the early detection of SCD patients.
Introduction
Subjective cognitive decline (SCD) and mild cognitive impairment (MCI) are considered as two continuous stages from normal cognition progressing to Alzheimer's Disease (AD)1,2. So far, many MRI studies have found reduced regional cerebral blood flow (CBF) in patients with AD3,4. Meanwhile, some others have reported the elevated index of regional cerebrovascular resistance in brain sub-regions of subcortical, medial temporal, posterior cingulate, precuneus, inferior parietal and superior temporal in AD patients, and of subcortical and posterior cingulate in MCI patients5.However, changes in resting-state CBF and the correlations between CBF and cognitive evaluations in SCD remain unknown. To investigate this, region-specific CBF values were correspondingly calculated in patients with SCD and MCI as well as health controls (HCs), and then compared among three groups. In addition, the correlations between the region-specific CBF values of all subjects and multiple clinical scales were estimated, respectively.
Materials and Methods
SubjectsThirty-two patients, of which eighteen patients (mean: 70.01±6.9years) were clinically confirmed with SCD and the rest fourteen (mean: 69.6±6.3years) were diagnosed with MCI, have been recruited in this study. For comparison, twenty-one HCs (mean: 73.5±5.9years) were also included.
Each subject involved was assessed with multiple clinical scales, including Mini-Mental-State-Examination (MMSE), Montreal-Cognitive-Assessment, Wechsler-Memory-Scale-Revised-logical-memory-Test, Trail-Making-Test (TMT) A&B, Auditory-Verbal-Learning-Test (AVLT), Boston-Naming-Test, Functional-Activities-Questionnaire, Short-Form-Health-Survey and Geriatric-Depression-Scale.
High resolution T1-weighted (T1w) MR anatomical brain images and 3D arterial-spin-labeling (3D-ASL) images have been acquired for each subject.
MRI experiment
All MR experiments were performed at a 3T-MR scanner (Discovery 750W, GE Healthcare, USA) equipped with a 24-channel head coil.
A fast-spoiled-gradient-echo based 3D-BRAVO sequence was employed to acquire 1mm3-isotropic T1w MR images. The scan parameters were of field-of-view (FOV)= 256x256mm2, repetition time (TR)=8.5ms, echo time (TE)=3.2ms, inversion time (TI)=450ms, flip angle (FA)=12degree, number of slices=192, slice thickness=1mm, matrix size=256x256 and bandwidth=31.25kHz.
For cerebral perfusion measurement, a fast-spin-echo based 3D pseudo-continuous ASL technique was used. The scan parameters included TR=4640ms, TE=10.7ms, FOV= 240x240mm2, slice thickness=4mm, number of slices=36, 512 sampling points on eight spiral arms and post-label delay=1525ms.
Total scan time was less than 18 minutes.
Data analysis
The CBF images were obtained using a vendor-provided ASL software in the ADW4.6 workstation (GE Healthcare). To extract the atlas based CBF values, T1w anatomical images of each subjects were first co-registered to CBF images. Then, the co-registered T1w images were normalized to MNI space using SPM12. Thereafter, all the CBF images could be transformed to MNI space. Lastly, the Automated Anatomical Labeling (AAL) atlas was applied to all the normalized CBF images to extract the values of the former 90 regions.
All statistical analyses were performed in SPSS software 20.0. One way analysis-of-variance (ANOVA) with the factor of group and subsequent post-hoc-t tests were applied to detect the difference of region-specific CBF values among SCD, MCl patients and HCs. The effects of age, gender and years of education were adjusted for all of these analyses. In addition, Pearson correlation analysis was separately employed to evaluate the relationship between the region-specific CBF values for all subjects and each of clinical scale scores. Significance threshold was set as p<0.05.
Results
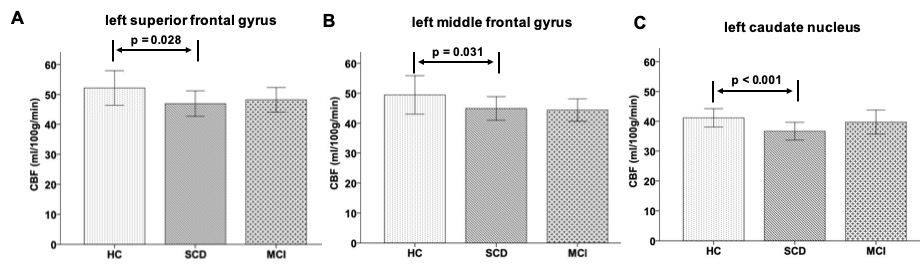
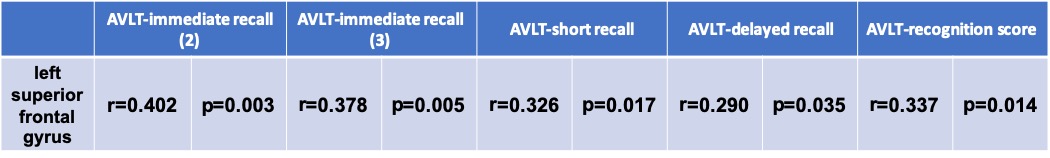
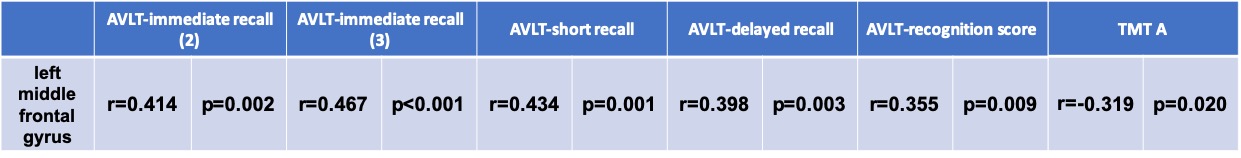
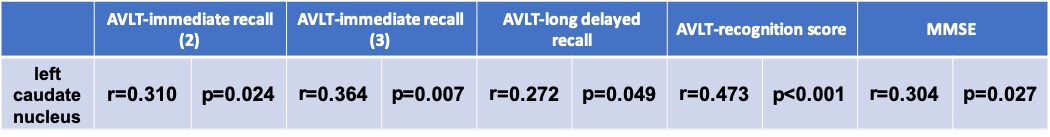
With one way ANOVA analysis, a main effect of group in the investigation of between-group variation of CBF values was revealed, respectively, at the left superior frontal gyrus (F(2,52)=3.66, p=0.033), left middle frontal gyrus (F(2,52)=4.03, p=0.024) and left caudate nucleus regions (F(2,52)=4.87, p=0.012). The corresponding post-hoc-t test further indicated that the CBF values in SCD group were significantly lower than those in HC group (Fig.1) for left superior frontal gyrus (mean: 46.9±9.1 vs 52.2±13.2 ml/100g/min; p=0.028), left middle frontal gyrus (mean: 44.9±8.3 vs 49.5±14.7 ml/100g/min; p=0.031) and left caudate nucleus regions (mean: 36.7±6.4 vs 41.2±7.0 ml/100g/min; p<0.001).Using Pearson correlation analysis, the CBFs of left superior frontal gyrus (Table.1) and left middle frontal gyrus (Table.2) regions showed significant positive correlations with each of AVLT-immediate recall (2&3), AVLT-short recall, AVLT-delayed recall and AVLT-recognition score, respectively (all p<0.05). Meanwhile, a significant negative correlation was revealed between the CBF values at left middle frontal gyrus and TMT-A (p<0.05; Table.2). Additionally, the CBF values of the left caudate nucleus (Table.3) showed a significant positive correlation with AVLT including AVLT-immediate recall (2&3), AVLT-long delayed recall, AVLT-recognition score and MMSE.
Discussion and conclusion
In this study, we systematically investigated the CBF values among patients with SCD, MCI and HCs. Significantly lower CBF values for the left superior frontal gyrus, left middle frontal gyrus, and left caudate nucleus regions have been shown in SCD patients than HCs, indicating that early changes of CBF could be an important biomarker in SCD individuals. Additionally, strong correlations were respectively revealed between the CBF values of the left superior frontal gyrus, left middle frontal gyrus and left caudate nucleus with multiple clinical scales. We can thus infer that in the early stage of cognitive decline, reduced CBF in left prefrontal cortex and left caudate nucleus might be the cause of the drop of AVLT scores and TMT-A. Because prefrontal cortex is involved in memory storage, retrieval and executive function (especially working memory and response selection), while the caudate nucleus is involved in reinforcement learning6.In conclusion, the CBF might be considered an effective biomarker in the early detection of SCD patients.
Acknowledgements
No acknowledgement found.References
1.Cheng YW, Chen TF, Chiu MJ. From mild cognitive impairment to subjective cognitive decline: conceptual and methodological evolution. Neuropsychiatr Dis Treat 2017;13:491-8.
2.Rabin LA, Smart CM, Amariglio RE. Subjective Cognitive Decline in Preclinical Alzheimer's Disease. Annu Rev Clin Psychol 2017;13:369-96.
3. de Eulate R, Goñi I, Galiano A et al. Reduced Cerebral Blood Flow in Mild Cognitive Impairment Assessed Using Phase-Contrast MRI. J. Alzheimers Dis. 2017;58:585-95.
4. Leijenaar JF, van Maurik IS, Kuijer JPA et al. Lower cerebral blood flow in subjects with Alzheimer's dementia, mild cognitive impairment, and subjective cognitive decline using two-dimensional phase-contrast magnetic resonance imaging. Alzheimers Dement (Amst) 2017;9:76-83.
5.Nation DA, Wierenga CE, Clark LR et al. Cortical and subcortical cerebrovascular resistance index in mild cognitive impairment and Alzheimer's disease. J. Alzheimers Dis. 2013;36:689-98.
6. Gazzaniga MS, Ivry RB, and Mangun GR. Cognitive Neuroscience: The Biology of the Mind (Forth edition). W.W.Norton & Company, Inc. 2014. New York.
Figures