1490
MRI subfield hippocampal volumetric analysis combined with amyloid PET result: Comparison between mild cognitive impairment, major depressive disorder and healthy elderly subjects.1Department of Radiology, Faculty of Medicine Siriraj Hospital, Mahidol University, Bangkok, Thailand, Bangkok, Thailand, 2Department of Geriatric Medicine, Faculty of Medicine Siriraj Hospital, Mahidol University, Bangkok, Thailand, Bangkok, Thailand, 3Department of Psychiatry, Faculty of Medicine Siriraj Hospital, Mahidol University, Bangkok, Thailand, Bangkok, Thailand
Synopsis
Hippocampus is a part of limbic system involving both neurodegenerative disease and emotional regulation circuit. This study aimed to use MRI automated subfield hippocampal volumetric analysis to differentiate mild cognitive impairment (MCI) from major depressive disorder (MDD) and age-matched healthy elderly (HE) subjects. We found a trend of relative smaller size in several subfield hippocampal regions in MCI than MDD patients. Even though, there were no statistical significance. These may raise possibility of MRI volumetry to be the tool for discriminating early neurodegenerative disease from major depressive disorder.
Abstract
Introduction: One of the most mentioned structures in limbic system is hippocampus, which basically been known to involve in both neurodegenerative disease especially Alzheimer’s disease (AD) and emotional regulation circuit2. Subfield hippocampal atrophy evidenced by MRI might be helpful for early detection AD converted mild cognitive impairment patients (MCI-c)1. Some prior psychiatric studies also found hippocampal atrophy in major depressive disorder (MDD) patients3. This study aimed to use MRI automated subfield hippocampal volumetric analysis to discriminate MCI from MDD patients which generally diagnosed only by clinical information or neuropsychological test.Materials and methods: A total of 41 age-matched subjects including 11 non-depressed MCI patients (mean age 68.8±3.9 years), 12 MDD patients (mean age 70.8 ± 6.0 years), and 18 HE subjects (mean age 69.5 ± 4.8 years) were enrolled in this study with analysis of neurological and neuropsychological test and underwent 3-Tesla MRI with high-resolution 3D-T1W-TFE covering the whole brain (FOV 230 × 230 × 172 mm3., matrix size 352x352, voxel size 0.72 × 0.72 × 0.65 mm3., TE/TR 4.8/9.8 ms; FA 8°, scan time 6 mins). All 12-subfield measurements including bilateral whole hippocampal volumes were normalized by the subject’s total intracranial volume derived from Freesurfer (v. 6.0)4 for comparing between MCI, MDD and HE subjects.
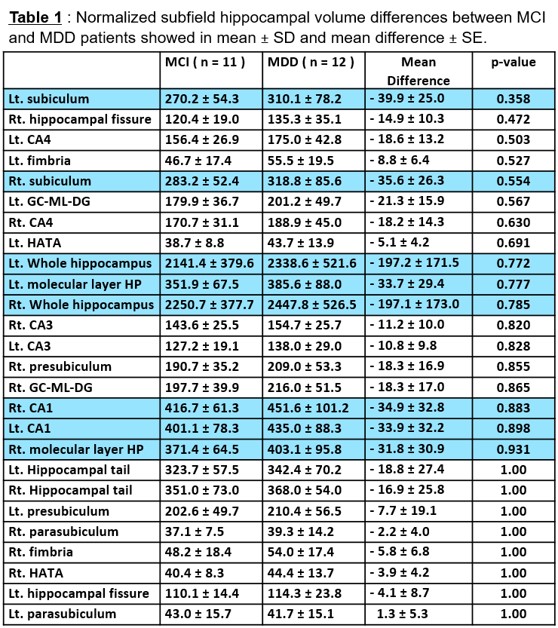
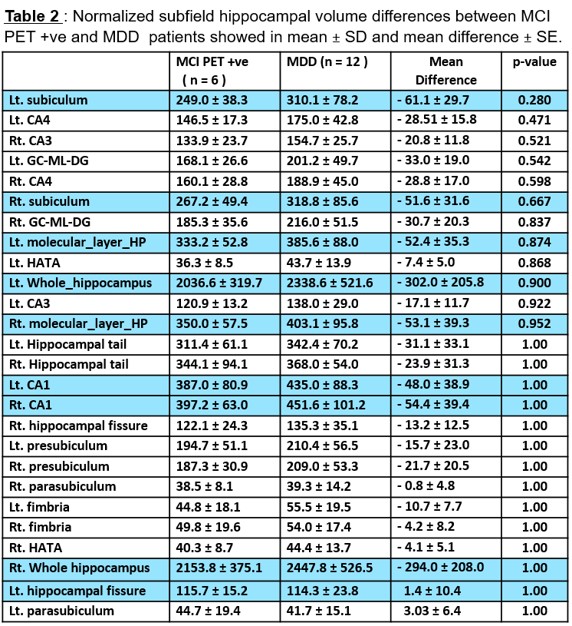
Results: There were no statistical significant difference in normalized subfield hippocampal volume among MCI, MDD and age-matched HE subjects even in subgroup analysis combining with amyloid PET result. However, there was a trend of relatively smaller size in almost all 12 subfield hippocampal regions including the whole hippocampi between MCI group compared with MDD and HE subjects. Focusing on the mean difference among MCI and MDD groups, the most remarkable values were the whole hippocampi followed by subiculum, molecular layer HP and CA1, bilaterally.(Table 1) Furthermore, there were much bigger in mean difference of the aforementioned regions within subgroup analysis results between MCI PET +ve and MDD groups. (Table 2) Interestingly, we also found larger size of the left hippocampal fissure volume in MCI PET +ve than in MDD patients.
Discussion and Conclusion: The relatively smaller size and distinctive mean difference in volume of bilateral whole hippocampi, subiculum, molecular layer HP and CA1 in MCI than MDD patients which more pronounce in MCI PET +ve group. It implied that only some subfield hippocampal regions might be firstly affected in early stage neurodegenerative disease. From previous studies, the entorhinal cortex especially superficial layer was believed to be particularly vulnerable neuron and affected in early stage of Alzheimer’s disease (AD)5 . It has been found giving rise to axons that interconnect the hippocampal formation. According to neuroanatomy, the subiculum is the gray structure situated atop of the parahippocampal gyrus (part of entorhinal cortex) and superolateral connecting to CA1 region. We thought that, the primarily change of entorhinal cortex in early AD might also propagade effect to the subiculum and CA1. In part of the molecular layer HP adjoining to both subiculum and CA1 may be affected either. Interestingly, we found larger size of the left hippocampal fissure volume in MCI PET +ve than in MDD patients which we didn’t see this phenomenon in the whole MCI patients. (including both MCI PET +ve and MCI PET -ve patients) All these findings, there might be concluded that MCI PET +ve group being AD converted mild cognitive impairment (MCI-c) while the MCI PET -ve group being AD non-converted mild cognitive impairment (MCI-nc) or normal aging process. Though not reach statistical significant, we expect that in the future with more sample sizes may enhance the statistical significant difference in subfield hippocampal volume among these three groups. In conclusion, the structural brain imaging using automated subfield hippocampal volumetric analysis might be the tool for discriminating early stage neurodegenerative disease (mild cognitive impairment; MCI) from major depressive disorder (MDD) and healthy elderly. In which, we can put the disease specific treatment as well as to disrupt or slow down disease progression from MCI to AD.
Acknowledgements
The authors would like to express sincere thanks to Dr. Orawan Supapueng for her assistance in statistical analysis.References
1. Khan W, Westman E, Jones N, Wahlund LO, Mecocci P, et al. (2015) Automated hippocampal subfield measures as predictors of conversion from mild cognitive impairment to Alzheimer’s disease in two independent cohorts. Brain Topogr 28: 746-759.
2. Eleni Palazidou( 2012 ) The neurobiology of depression. British Medical Bulletin 101: 127–145.
3. Stratmann M, Konrad C, Kugel H, Krug A, Scho ̈ning S, et al. (2014) Insular and Hippocampal Gray Matter Volume Reductions in Patients with Major Depressive Disorder. PLoS ONE 9(7): e102692.doi:10.1371/journal.pone.0102692.
4. Iglesias JE, Augustinack JC, Nguyen K, Player CM, Player A, et al. (2015) A computational atlas of the hippocampal formation using ex vivo, ultra-high resolution MRI: Application to adaptive segmentation of in vivo MRI. euroimage 115: 117-137.
5. Helen E. Scharfman and Moses V. Chao. (2014) The Entorhinal Cortex and Neurotrophin Signaling in Alzheimer's Disease and Other Disorders. Cogn Neurosci. 2013 ; 4(0): doi:10.1080/17588928.2013.826184.
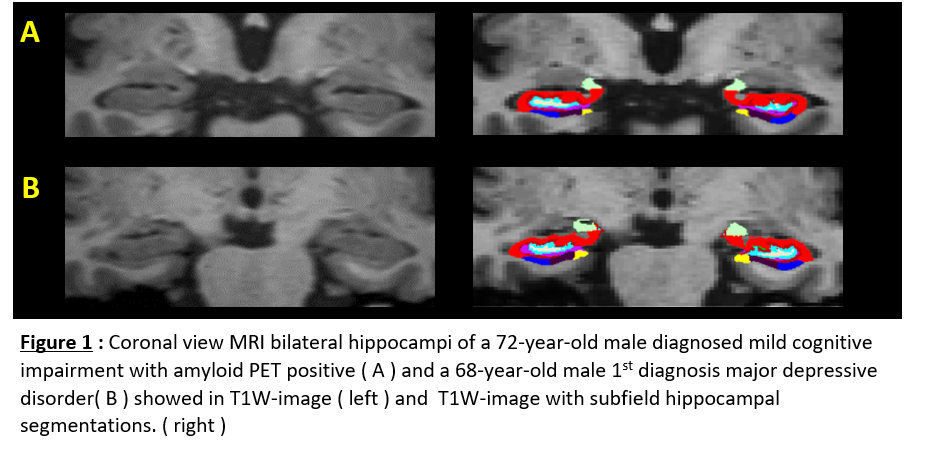
Figures