1489
Sensitivity of ASL MRI for Detecting Perfusion Abnormalities in Frontotemporal Dementia: Preliminary Comparison with 15O-water PET1Lawson Health Research Institute, London, ON, Canada, 2Department of Medical Biophysics, Western University, London, ON, Canada, 3Fraunhofer Institute for Medical Image Computing MEVIS, Bremen, Germany, 4Department of Clinical Neurological Sciences, Western University, London, ON, Canada
Synopsis
The ability of arterial spin labeling (ASL) to detect perfusion abnormalities in clinical populations, such as frontotemporal dementia, can be limited by poor signal to noise and transit-time artefacts. Recent advances in ASL imaging protocols should enable detection of more subtle perfusion abnormalities. This study presents a head-to-head comparison of regional hypoperfusion detected by ASL and PET with radiolabeled water (15O-water) - the gold standard for measuring CBF in humans. While 15O-water PET data showed greater sensitivity, as identified by larger and focal clusters on the t-maps, similar areas of hypoperfusion were identified by ASL, particularly with relative CBF.
Introduction
While ASL is a simple, non-invasive approach for measuring CBF, its poor signal-to-noise ratio and sensitivity to arterial transit times can limit its ability to detect perfusion abnormalities. This is particularly evident in studies involving frontotemporal dementia (FTD) patients, where reports on the diagnostic value of ASL have been inconsistent1–3. Recent advances in ASL protocols, including optimized labeling parameters should enable detection of more subtle perfusion abnormalities4. To evaluate this, this study presents a comparison of regional hypoperfusion maps generated using ASL and PET with radiolabeled water (15O-water), the gold standard for measuring CBF in humans. Data were acquired using a hybrid PET/MR scanner to avoid variability in perfusion between imaging sessions and to minimize registration errors.Methods
Data were acquired from 5 controls (age: 62.4 ± 9.8, gender: 2 female / 3 male) and 3 FTD patients (age: 62.0 ± 7.2, gender: 2 female / 1 male) on the Siemens biograph mMR. The patient group included 1 and 2 individual(s) with behavioral and semantic variant of FTD respectively. Five minutes of list mode data were acquired after a bolus injection of approximately 800Mbq of 15O-water. To avoid arterial blood sampling, a non-invasive hybrid PET/MR approach was used to map CBF5. With this variation of the double integration approach6, global CBF measured by phase contrast (PC)-MRI was used to convert regional PET-activity into perfusion units. PC-MRI data (venc: 70cm/s, voxel size: 0.7x0.7x5mm3) were acquired simultaneous with PET. 15O-water PET data were reconstructed using a UTE-based attenuation correction map7 and smoothed by a 4mm gaussian filter. ASL data (PCASL-GRASE, TR/TE: 4500/22.14ms, post-labeling delay: 2s, labeling duration: 1.8s, voxel size: 4x4x4mm3) were collected immediately following PET acquisition. A calibration (M0) image was acquired with TR = 7s. ASL data were motion corrected and smoothed by a 4mm Gaussian filter. Perfusion was calculated using a one compartment model using the oxasl pipeline in FSL8. All perfusion data were normalized to the MNI template using FSL. Regional hypoperfusion was determined by comparing individual CBF maps to the control group using the Crawford and Howell modified t-test9. T-maps were produced using absolute (CBFabs) and relative CBF (CBFrel). Relative perfusion maps were generated by intensity normalizing by the brain stem.Results
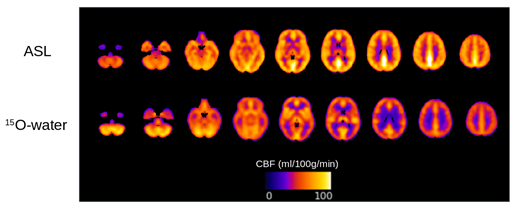
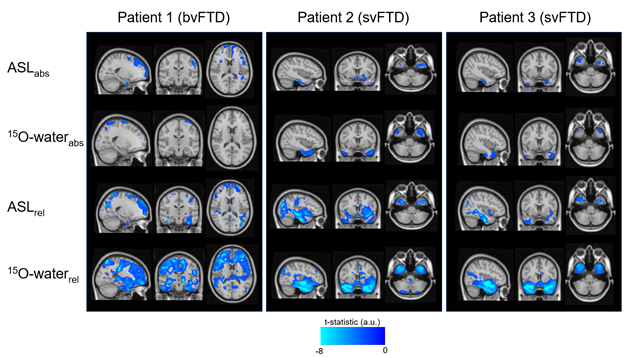
Global absolute CBF measured by ASL was 63.3 ± 12.6 and 63.1 ± 10.9 ml/100g/min (ns) and by PC was 48.1 ± 10.7 and 47.9 ± 10 ml/100g/min (ns) in controls and patients, respectively. Mean control perfusion maps generated by ASL and 15O-water are shown in Figure 1. Statistical maps generated using ASL and 15O-water perfusion maps are shown in Figure 2. In patients with semantic variant of FTD, both ASL and 15O-water identified significantly lower perfusion in the temporal region. Correspondingly, the patient with behavioural variant of FTD showed significant hypoperfusion in the bilateral frontal region in both ASL and 15O-water statistical maps.Discussion/Conclusion
This work highlights the potential of ASL for identifying regional hypoperfusion in patients with FTD. Despite the small sample size, the preliminary results showed that ASL is capable of detecting subtle perfusion abnormalities similar to those detected by PET. While 15O-water PET showed greater sensitivity, as identified by larger and focal clusters on the t-maps, similar areas of hypoperfusion were identified by ASL (Fig. 2). This is particularly evident in the CBFrel maps where the variability relating to inter-subject perfusion was reduced. These results are in agreement with previous PET studies which showed decreased metabolism in these regions in similar patient groups1,10. Future work will be to account for sources of variability such as partial voluming errors.Acknowledgements
This work is supported by: Frederick Banting and Charles Best Canada Graduate Doctoral Award, Canadian Institutes of Health Research Grant and Alzheimer’s Drug Discovery Foundation Grant.References
1. Anazodo, U. C. et al. Using simultaneous PET/MRI to compare the accuracy of diagnosing frontotemporal dementia by arterial spin labelling MRI and FDG-PET. NeuroImage Clin. 17, 405–414 (2018).
2. Mutsaerts, H. J. M. M. et al. Cerebral perfusion changes in presymptomatic genetic frontotemporal dementia: a GENFI study. Brain 142, 1108–1120 (2019).
3. Bron, E. E. et al. Diagnostic classification of arterial spin labeling and structural MRI in presenile early stage dementia. Hum. Brain Mapp. 35, 4916–31 (2014).
4. Alsop, D. C. et al. Recommended implementation of arterial spin-labeled perfusion MRI for clinical applications: A consensus of the ISMRM perfusion study group and the European consortium for ASL in dementia. Magn. Reson. Med. 73, 102–116 (2015).
5. Ssali, T., Anazodo, U. C., Thiessen, J. D., Prato, F. S. & St. Lawrence, K. A Non-invasive Method for Quantifying Cerebral Blood Flow by Hybrid PET/MR. J. Nucl. Med. 59, 1329–1334 (2018).
6. Mejia, M., Itoh, M., Watabe, H., Fujiwara, T. & Nakamura, T. Simplified nonlinearity correction of oxygen-15-water regional cerebral blood flow images without blood sampling. J. Nucl. Med. 35, 1870–7 (1994).
7. Catana, C. et al. Toward implementing an MRI-based PET attenuation-correction method for neurologic studies on the MR-PET brain prototype. J. Nucl. Med. 51, 1431–1438 (2010).
8. Chappell, M. A., Groves, A. R., Whitcher, B. & Woolrich, M. W. Variational Bayesian Inference for a Nonlinear Forward Model. IEEE Trans. Signal Process. 57, 223–236 (2009).
9. Crawford, J. R. & Garthwaite, P. H. Single-case research in neuropsychology: A comparison of five forms of t-test for comparing a case to controls. Cortex 48, 1009–1016 (2012).
10. Lee, H. et al. [F-18]-THK5351 PET Imaging in Patients With Semantic Variant Primary Progressive Aphasia. Alzheimer Dis Assoc Disord 32, 62–69 (2018).
Figures