1487
Role of Diffusion MRI-Derived Free Water Fraction in Predicting Progression to Alzheimer’s Disease Dementia from Mild Cognitive Impairment1Cleveland Clinic Lou Ruvo Center for Brain Health, Las Vegas, NV, United States, 2University of Colorado, Boulder, Boulder, CO, United States, 3Department of Brain Health, University of Nevada, Las Vegas, Las Vegas, NV, United States
Synopsis
We hypothesized that diffusion-MRI (dMRI)-derived free-water fraction (fiso) will show a significantly lower and a faster change over time in mild cognitive impaired (MCI) participants who progressed to Alzheimer’s disease (AD) dementia in various cortical, subcortical, and white-matter fiber tracts compared to those who did not progress to AD dementia. Utilizing five β-Amyloid (Aβ) positive (+)/ApoE-4 carriers MCI participants who progressed to AD dementia within one-year, and thirteen Aβ+/ApoE-4 carriers MCI participants who did not progress to AD dementia within one-year, we showed that although the relationship between various cortical/subcortical volume and fiso is complex, it was distinct between groups.
Introduction
Three clinical phases of Alzheimer’s disease (AD) has been proposed following the β-Amyloid (Aβ) hypothesis, namely preclinical AD, prodromal phase/mild cognitive impairment (MCI), and AD dementia1. It has been suggested that approximately 15% of MCI progress to AD dementia annually2. However, no robust biomarkers yet exist that can identify participants progressing to AD dementia from MCI. Utilizing a combination of multimodal neuroimaging and non-imaging measures, Varatharajah et al.3 recently identified 65 best markers that could predict progression from MCI to AD dementia with 93% accuracy. Although this is a significant improvement, this model suffers from applicability in routine clinical settings where a complete dataset may not be available. Furthermore, the efficacy of diffusion MRI (dMRI)-derived free-water fraction (fiso)4 in the hippocampus which has been proposed recently5 as a sensitive marker for AD was not evaluated by Varatharajah et al. to understand if including fiso might improve the predictive ability or reduce the number of modalities while achieving a similar prediction accuracy. Hence, in this study, we estimated fiso changes in various cortical, subcortical, and white matter (WM) fiber tracts of five MCI participants who progressed to AD dementia within one-year of MCI diagnosis and compared these fiso changes to thirteen demographically matched MCI participants who did not progress to AD dementia. We hypothesize that fiso will show a significantly lower and a faster change over time in the MCI participants who progressed to AD dementia not only in hippocampus but also in hippocampal subfields, cingulate cortex, frontal cortex, and WM tracts such as cingulum (CGC) and corpus callosum.Methods
Participants: We utilized data from five MCI participants (3 males (M), 2 females (F); 73±4.64 years; 16.8±2.28 years of education (YOE)) who progressed to AD dementia within one-year of MCI diagnosis (M2A) and thirteen MCI participants (6M, 7F; 75.85±4.81 years; 15.85±2.34 YOE) who remained MCI (M2M) within one-year of MCI diagnosis. All participants were selected to be Aβ-positive (Aβ+) and ApoE-4 carriers. Diagnosis of AD/MCI was made by a practicing neurologist based on clinical presentation and neuropsychological evaluations of each participant at each timepoint. All participants utilized in this study were scanned at baseline and after one-year with the same acquisition parameters on a 3T Siemens Skyra scanner with the following parameters: 3D T1-weighted MRI acquisition: Sagittal acquisition, isotropic spatial resolution=1mm3, inversion time(TI)=900ms, repetition time (TR)=2300ms, echo time (TE)=2.96ms. dMRI acquisition: Number of b-values=3, b-values=500s/mm2, 1000s/mm2, 2500s/mm2 (multi-shell dMRI data was acquired in the same run to keep the shimming factor consistent across various b-values), number of diffusion-encoding directions at each shell=71, number of non-diffusion weighted images (b0)=25 (b0 images were acquired in an interleaved fashion), isotropic spatial resolution=1.5mm3, TR=5218ms, TE=100ms, multiband factor(MB)=3, acceleration factor (GRAPPA)=2, phase encoding direction= P>>A. We also acquired a b0 image with the same parameters but with opposite phase encoding direction (A>>P) for eddy-current distortion correction6. Total acquisition time=28 minutes. Pre-processing: Eddy-current distortion correction was performed using eddy tool in FSL 6.0, and translational head motion during the scan was computed for each participant. Post-processing: In-house estimation of whole-brain fiso was performed for each participant utilizing the lower shell dMRI data (b=500s/mm2, 1000s/mm2). Additionally, FreeSurfer 6.07 was utilized to generate cortical, subcortical, and hippocampal subfield masks. Both average volumes and average fiso within each region-of-interest (ROI) was estimated for each participant. Average fiso within twenty major WM fiber tracts8 was also extracted for each participant at each timepoint. Statistical analysis: Only those ROIs and WM fiber tracts that showed at least 10% change in fiso longitudinally within each group were selected for further analysis. Regression analysis was performed for each group to understand the correlation between fiso and ROI volume at both timepoints.Results
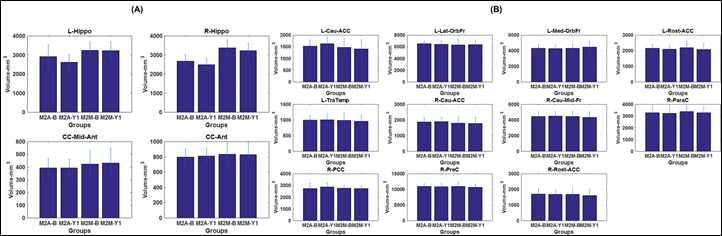
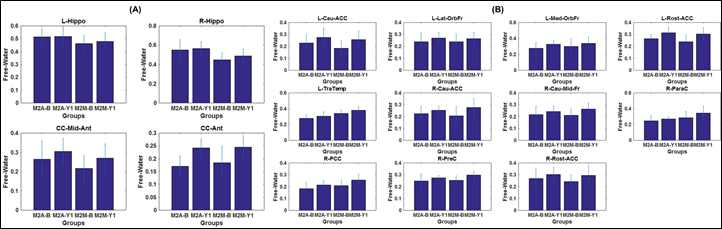
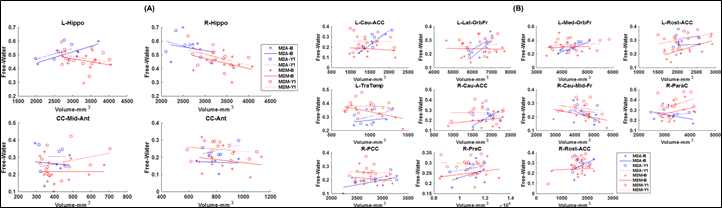
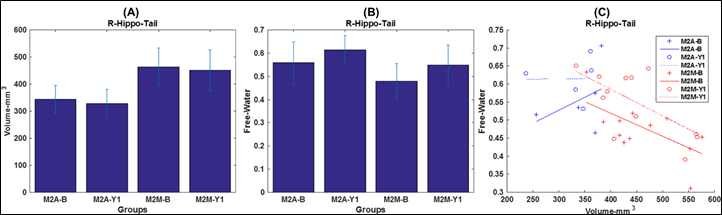
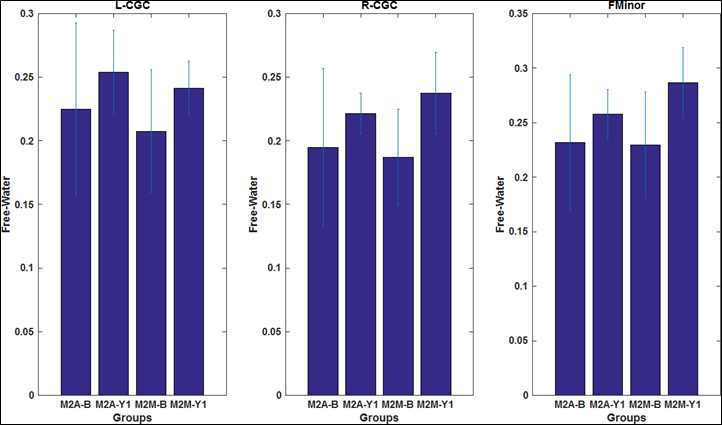
M2A and M2M groups showed non-significant (p>0.05) head motion during dMRI scan at both timepoints. As expected, bilateral hippocampus showed lower hippocampal volume (Fig.1) and elevated fiso (Fig.2) within M2A group. However, this effect was not observed (Fig.1 and 2) consistently for each ROI that showed 10% change in fiso longitudinally within the group (e.g.: Anterior corpus callosum, posterior cingulate cortex, tranverse-temporal cortex etc.). Furthermore, a complex correlation between fiso and ROI volume was observed at each timepoint for both groups (Fig.3). Interestingly, hippocampal tail was found to be driving the effect seen in right hippocampus, with an opposite slope at each timepoint between M2A and M2M group (Fig.4). Contrary to our hypothesis, right cingulate WM tract and FMinor showed a decrease in fiso within M2A group (Fig.5).Discussion
Our pilot analysis, albeit with small sample size and potentially underpowered, revealed that fiso of not only hippocampus but also tail of hippocampus, frontal and temporal cortex, and WM fibers of limbic cortex and FMinor may predict AD from MCI. Furthermore, although the relationship between volume and fiso was found to be complex at each timepoint, it was distinct between M2M and M2A groups.Conclusion
This is the first study to comprehensively evaluate whole-brain fiso changes in a well-characterized cohort of MCI who progressed to AD dementia within a year of MCI diagnosis. Whether beyond-single tensor measures9,10 in-addition to fiso-corrected single-tensor measures can identify imaging measures to predict AD dementia from MCI is currently underway.Acknowledgements
This research project was supported by the NIH COBRE grant 5P20GM109025, Keep Memory Alive-Young Investigator Award, and philanthropic funds from Peter and Angela Dal Pezzo, Lynn and William Weidner, and Stacie and Chuck Matthewson.References
1. De-Paula VJ, Radanovic M, Diniz BS, Forlenza O V. Alzheimer’s disease. Subcell Biochem. United States; 2012;65:329–352.
2. Farias ST, Mungas D, Reed BR, Harvey D, DeCarli C. Progression of Mild Cognitive Impairment to Dementia in Clinic- vs Community-Based Cohorts. JAMA Neurol. 2009;66:1151–1157.
3. Varatharajah Y, Ramanan VK, Iyer R, et al. Predicting Short-term MCI-to-AD Progression Using Imaging, CSF, Genetic Factors, Cognitive Resilience, and Demographics. Sci Rep. 2019;9:2235.
4. Pasternak O, Sochen N, Gur Y, Intrator N, Assaf Y. Free water elimination and mapping from diffusion MRI. Magn Reson Med. United States; 2009;62:717–730.
5. Ofori E, DeKosky ST, Febo M, et al. Free-water imaging of the hippocampus is a sensitive marker of Alzheimer’s disease. NeuroImage Clin. Netherlands; 2019;24:101985.
6. Andersson JLR, Sotiropoulos SN. An integrated approach to correction for off-resonance effects and subject movement in diffusion MR imaging. Neuroimage. United States; 2016;125:1063–1078.
7. Fischl B. FreeSurfer. Neuroimage. 2012;62:774–781.
8. Wakana S, Caprihan A, Panzenboeck MM, et al. Reproducibility of Quantitative Tractography Methods Applied to Cerebral White Matter. Neuroimage. 2007;36:630–644.
9. Jensen JH, Helpern JA, Ramani A, Lu H, Kaczynski K. Diffusional kurtosis imaging: the quantification of non-gaussian water diffusion by means of magnetic resonance imaging. Magn Reson Med. United States; 2005;53:1432–1440.
10. Zhang H, Schneider T, Wheeler-Kingshott CA, Alexander DC. NODDI: practical in vivo neurite orientation dispersion and density imaging of the human brain. Neuroimage. United States; 2012;61:1000–1016.
Figures