1486
Progressive Increased Degree Centrality in Alzheimer’s Disease and Mild Cognitive Impairment: A Resting-state fMRI Study1Department of Radiology, First Central Clinical College, Tianjin Medical University, Tianjin, China, 2Department of Neurology, Tianjin First Central Hospital, Tianjin, China, 3MR Collaboration, Siemens Healthcare Ltd., Beijing, China, 4Department of Radiology, Tianjin Medical University General Hospital, Tianjin, China, 5Department of Radiology, Tianjin First Central Hospital, Tianjin, China
Synopsis
Brain network alterations remain poorly understood in mild cognitive impairment (MCI). This functional magnetic resonance imaging (fMRI) study aimed to investigate the degree centrality alterations in patients with Alzheimer's disease (AD) and MCI using graph theory analyses based on a population-specific template, as well as associations with neuropsychological test scores. The degree centrality of the left middle frontal gyrus and left medial superior frontal gyrus increased as patients’ cognitive function and daily activities declined. These findings suggest that abnormalities in the network topology progress in the prodromal and clinical stages of AD and are associated with clinical manifestations.
Introduction
Recent findings suggest that Alzheimer’s disease (AD) is a syndrome characterized by disruption in large scale networks. However, the alterations that occur in network topology during the progression of AD, particularly in patients with mild cognitive impairment (MCI), remain poorly understood. 1 Studies have suggested that population-specific atlases such as the Chinese2020 template could be used to improve the performance of brain function analyses in a Chinese population; 2 however, few studies have used the Chinese2020 template in the functional analysis of Alzheimer’s disease. This study aimed to investigate the degree centrality alterations in patients with AD and MCI using graph theory analysis based on the Chinese-specific template Chinese2020, and to further examine associations with neuropsychological test scores.Methods
Twenty-four probable AD patients, 27 MCI patients, and 33 healthy control (HC) subjects were enrolled in this study. There were no statistically significant differences in age, gender, and years of education among the three groups. Neuropsychological evaluations used for disease diagnosis included the Mini-Mental State Examination (MMSE), Montreal Cognitive Assessment (MoCA), Activities of Daily Living (ADL), Clinical Dementia Rating (CDR), Hamilton Depression Rating Scale (HAM-D), Hachinski Ischemic Score (HIS), Neuropsychiatric Inventory (NPI) and Alzheimer's Disease Assessment Scale-cognitive subscale (ADAS-cog). Each subject received MR imaging on a 3T MAGNETOM Prisma MR scanner (Siemens Healthcare, Erlangen, Germany) equipped with a 64-channel head-neck coil. The resting-state functional magnetic resonance imaging (rs-fMRI) data were acquired with a simultaneous multi-slice echo planar imaging sequence (repetition time/echo time (TR/TE) = 676/30 ms, flip angle = 40°, field-of-view (FOV) = 192 x 192 mm2 ; simultaneous multi-slice imaging (SMS) = 4, resolution = 3.0x3.0x3.0 mm3, slices = 48, measurements = 1100).All of the preprocessing, brain network construction, and degree centrality calculations were carried out using the DPASF toolbox (http://rfmri.org/DPABI), GRETNA toolbox (https://www.nitrc.org/projects/gretna/), and the SPM8 package (https://www.fil.ion.ucl.ac.uk/spm/software/spm8/). Segmentation, normalization, and definition of brain network nodes were conducted based on a Chinese human brain template (Chinese2020) and a Chinese automated anatomical labeling (AAL) atlas. 3 Degree centrality of all brain nodes were compared among groups using analysis of variance (ANOVA) models followed by post hoc pairwise comparisons. A false discovery rate (FDR) corrected p < 0.05 was considered statistically significant. The correlations between the degree centrality of nodes with significant statistical differences and MMSE, MoCA, ADL, and CDR scales were analyzed by means of Pearson correlation (p < 0.05).
Results
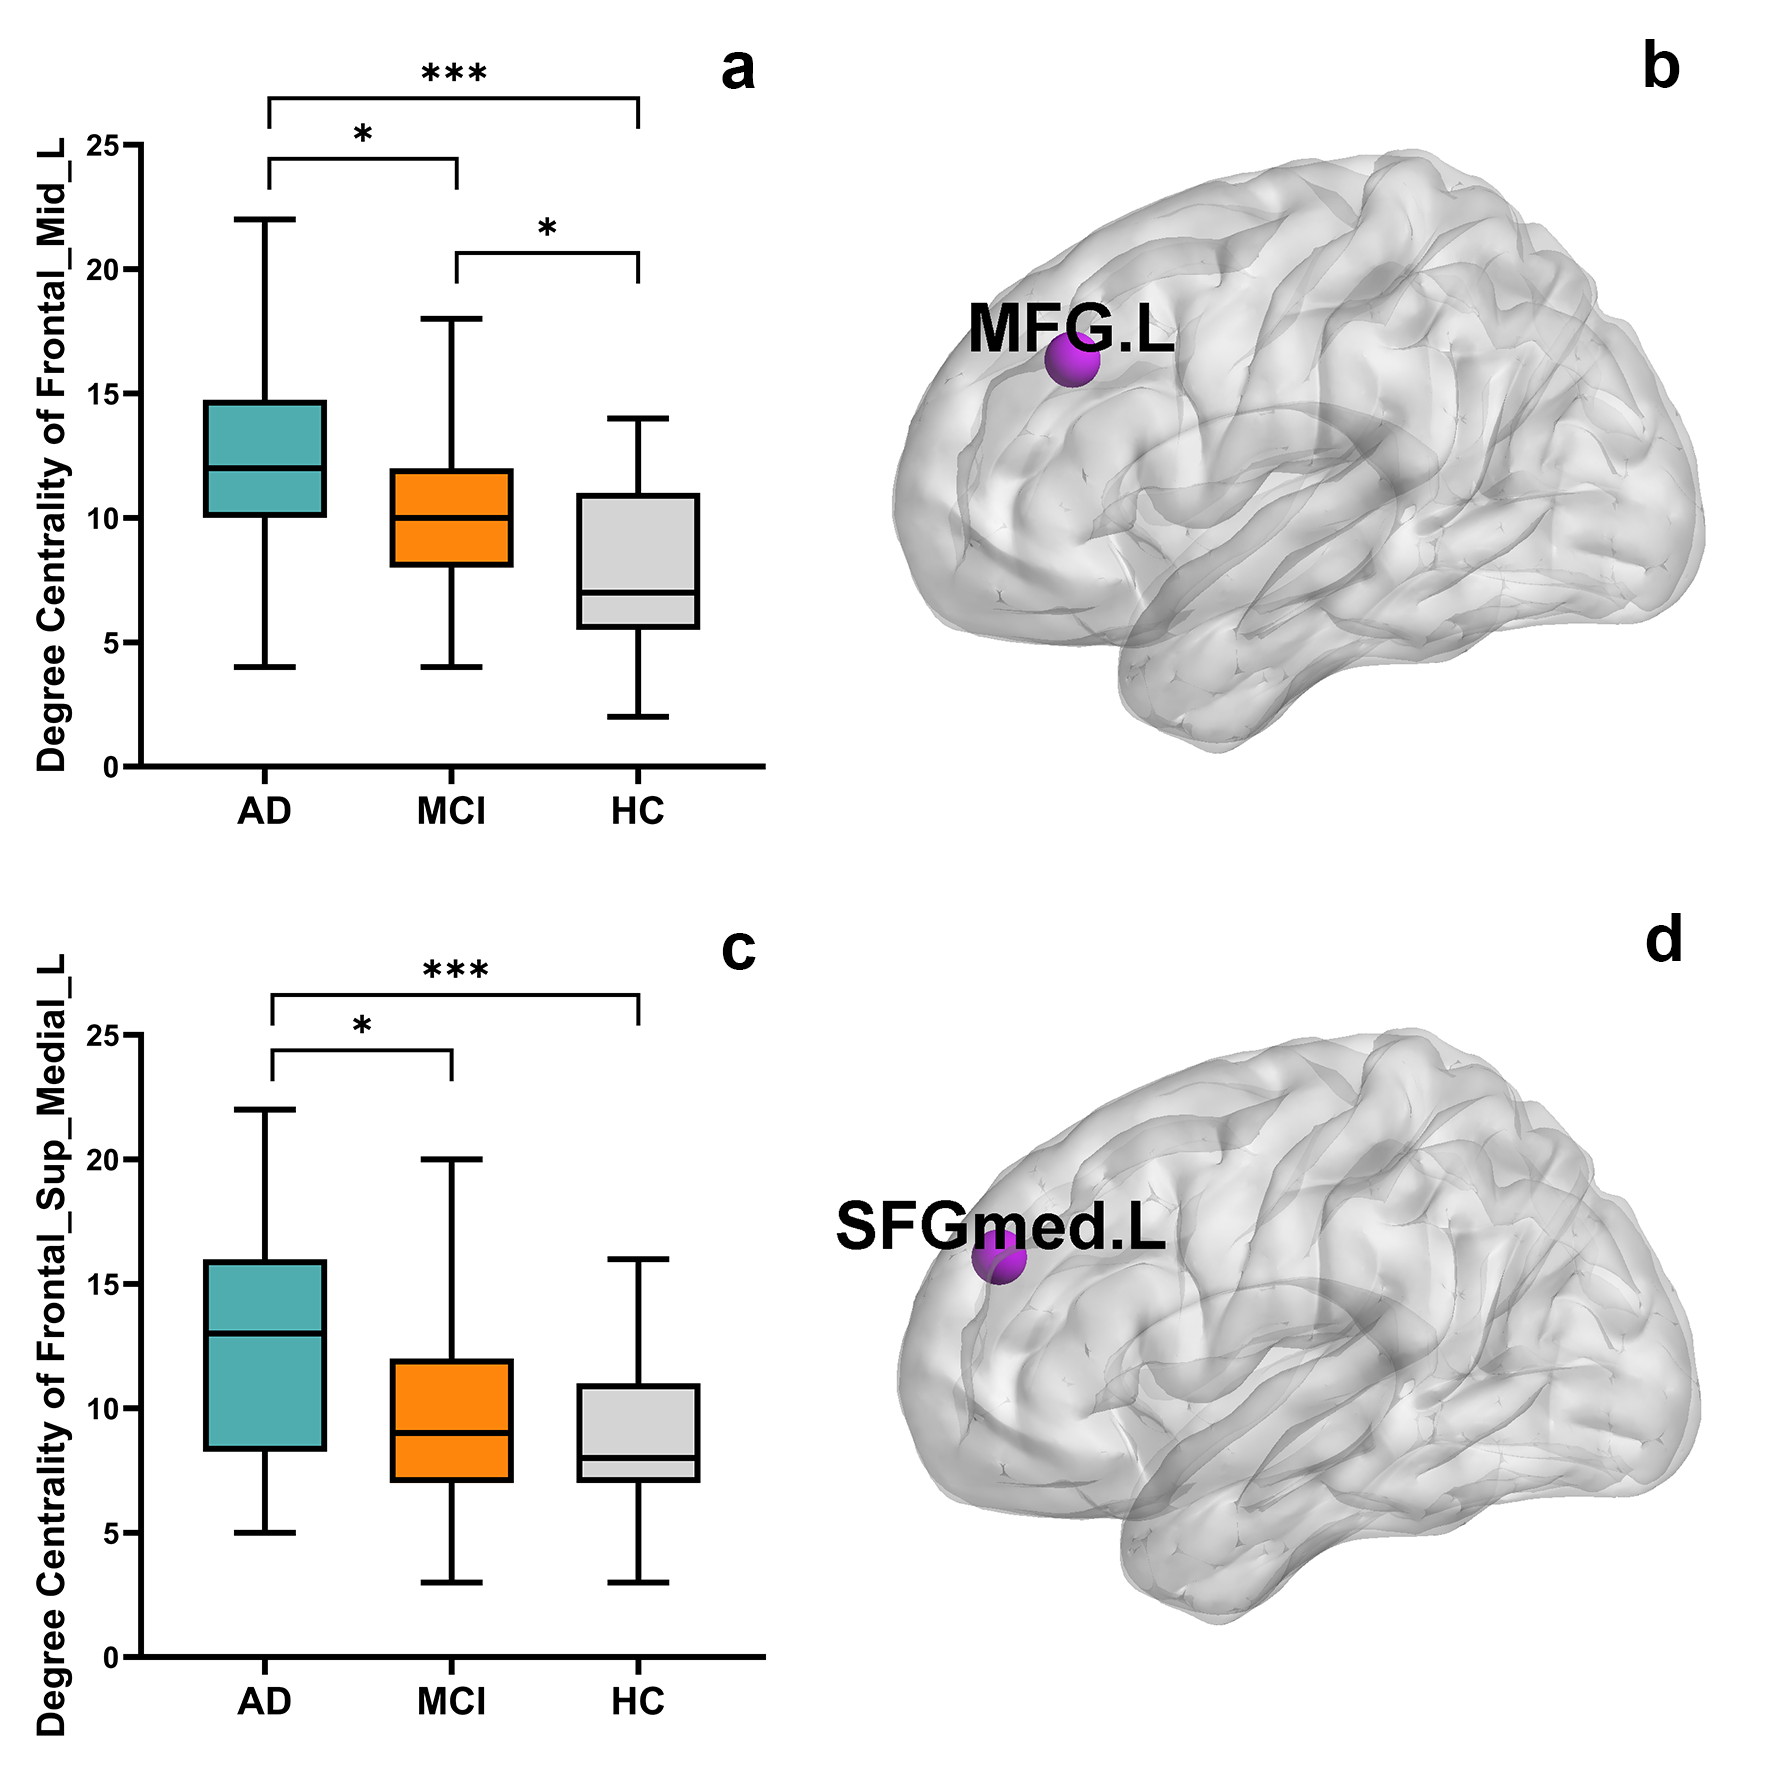
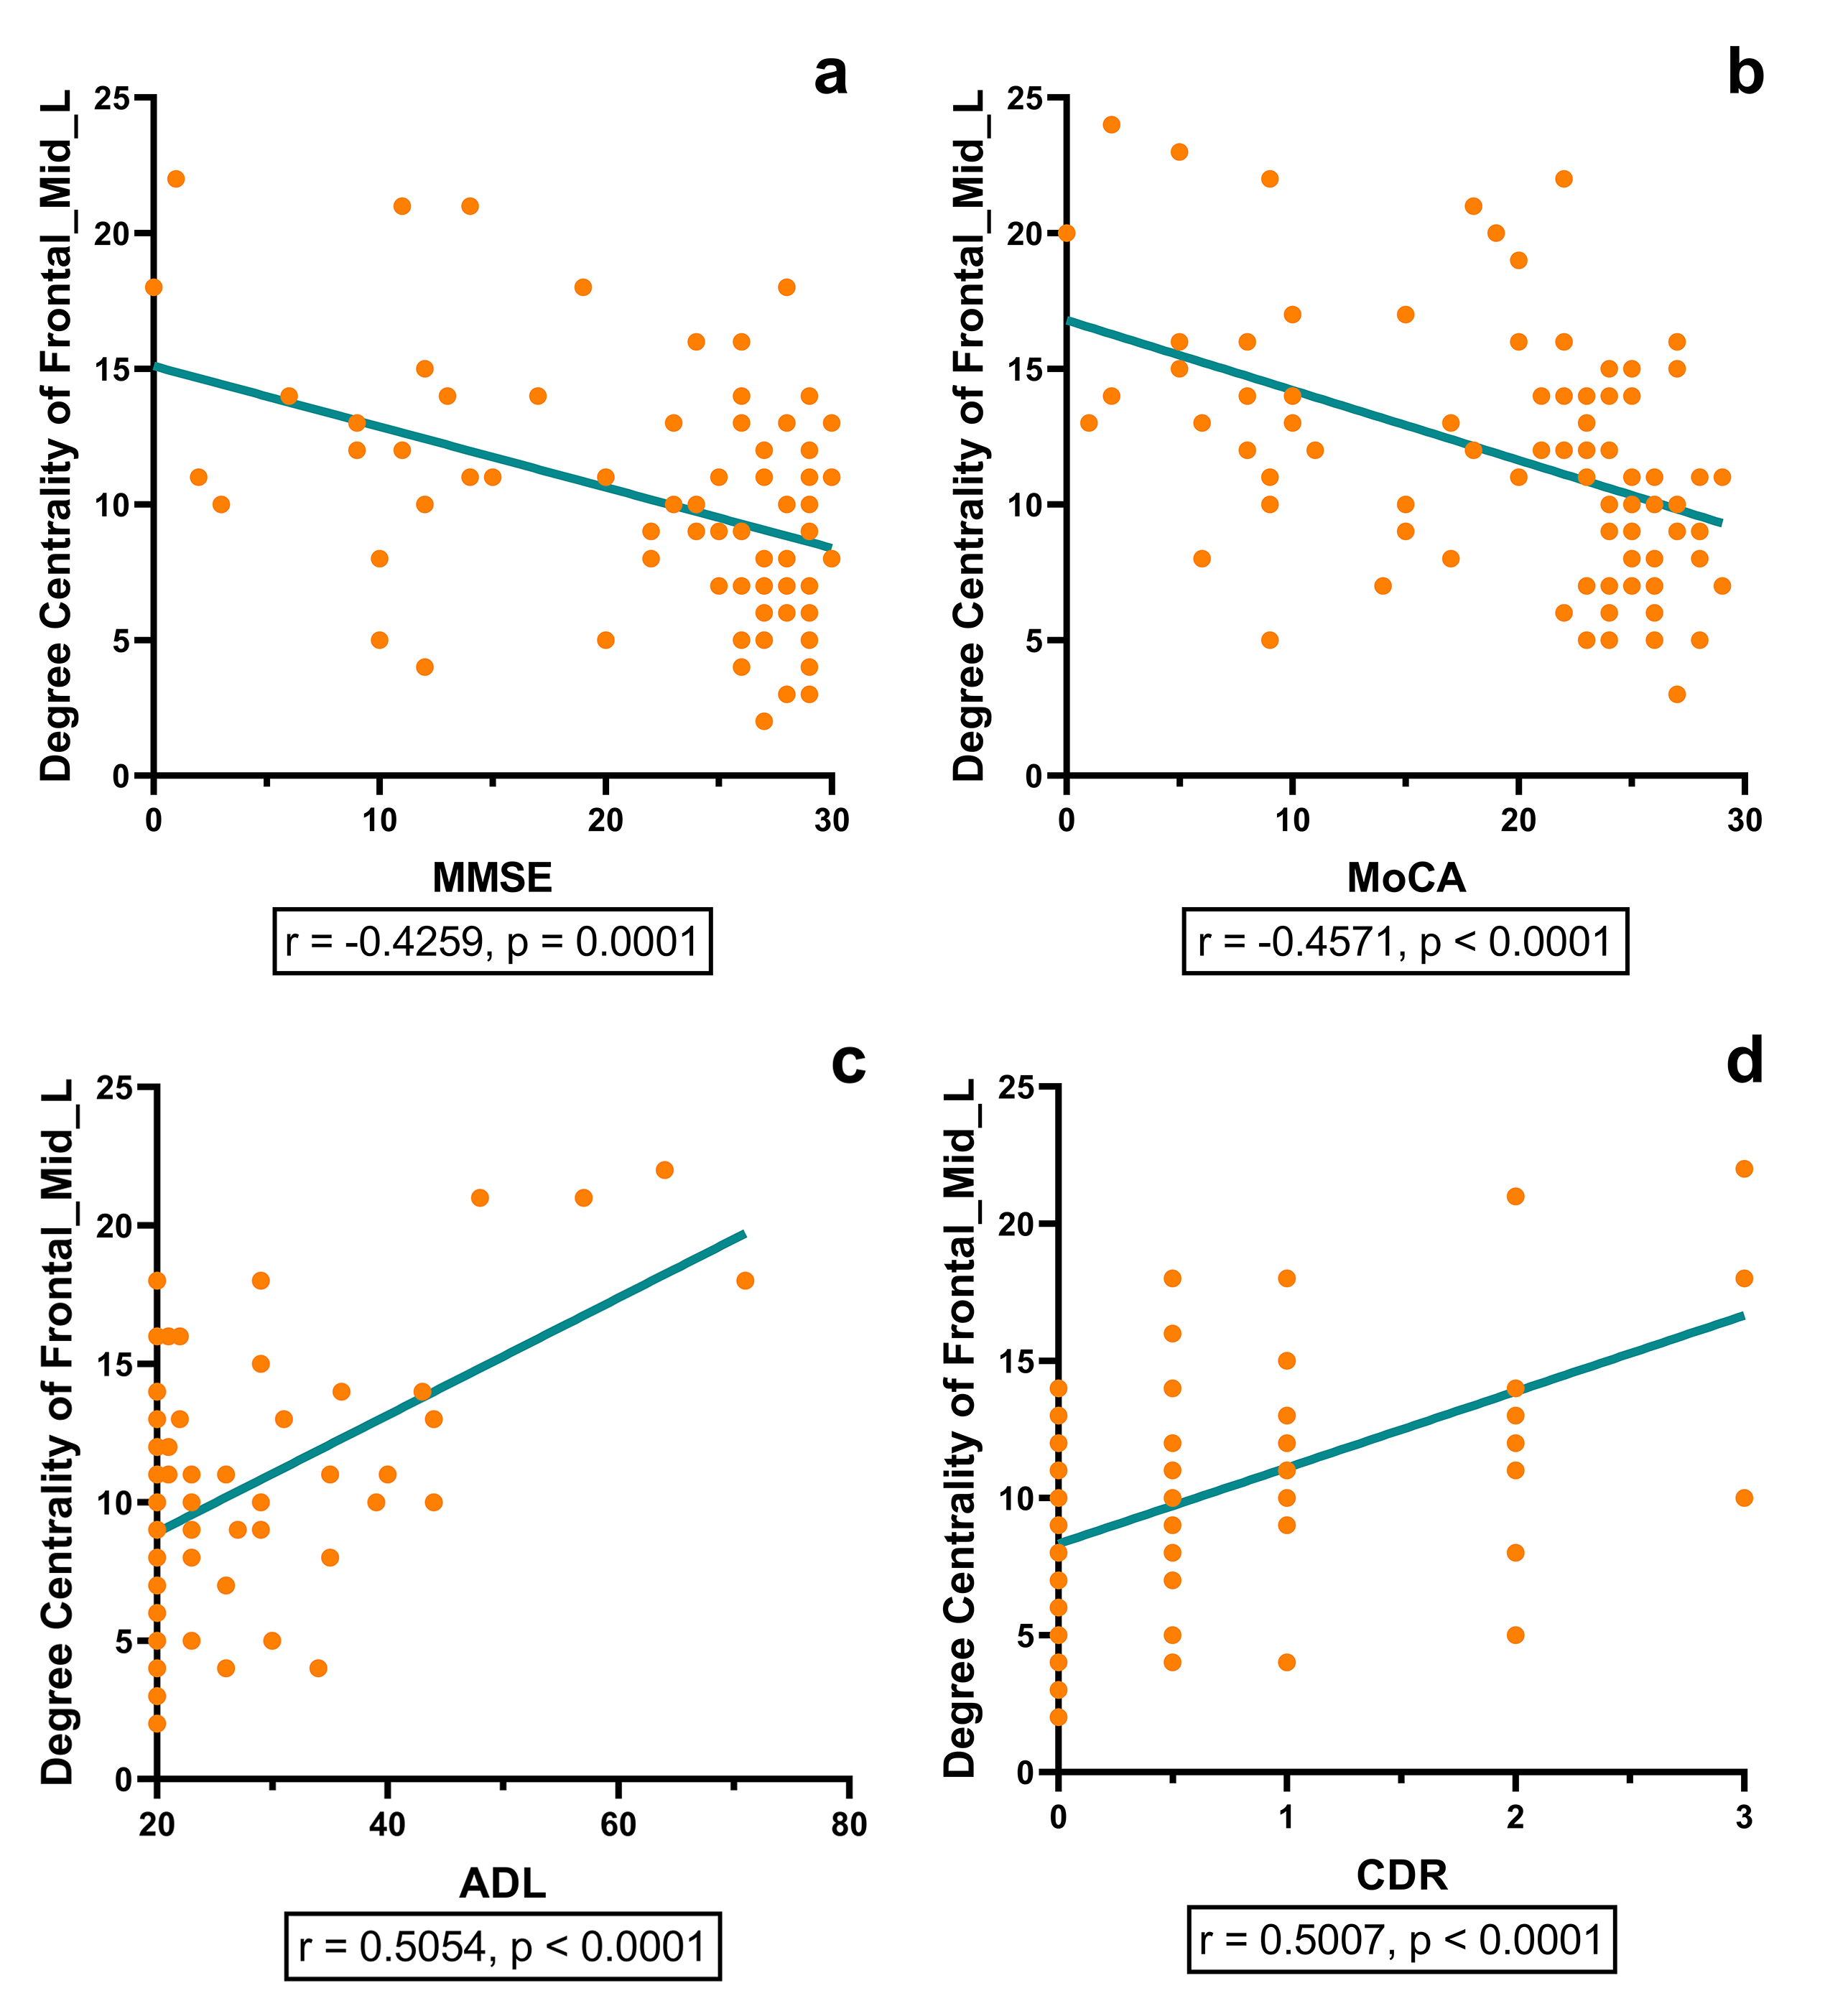
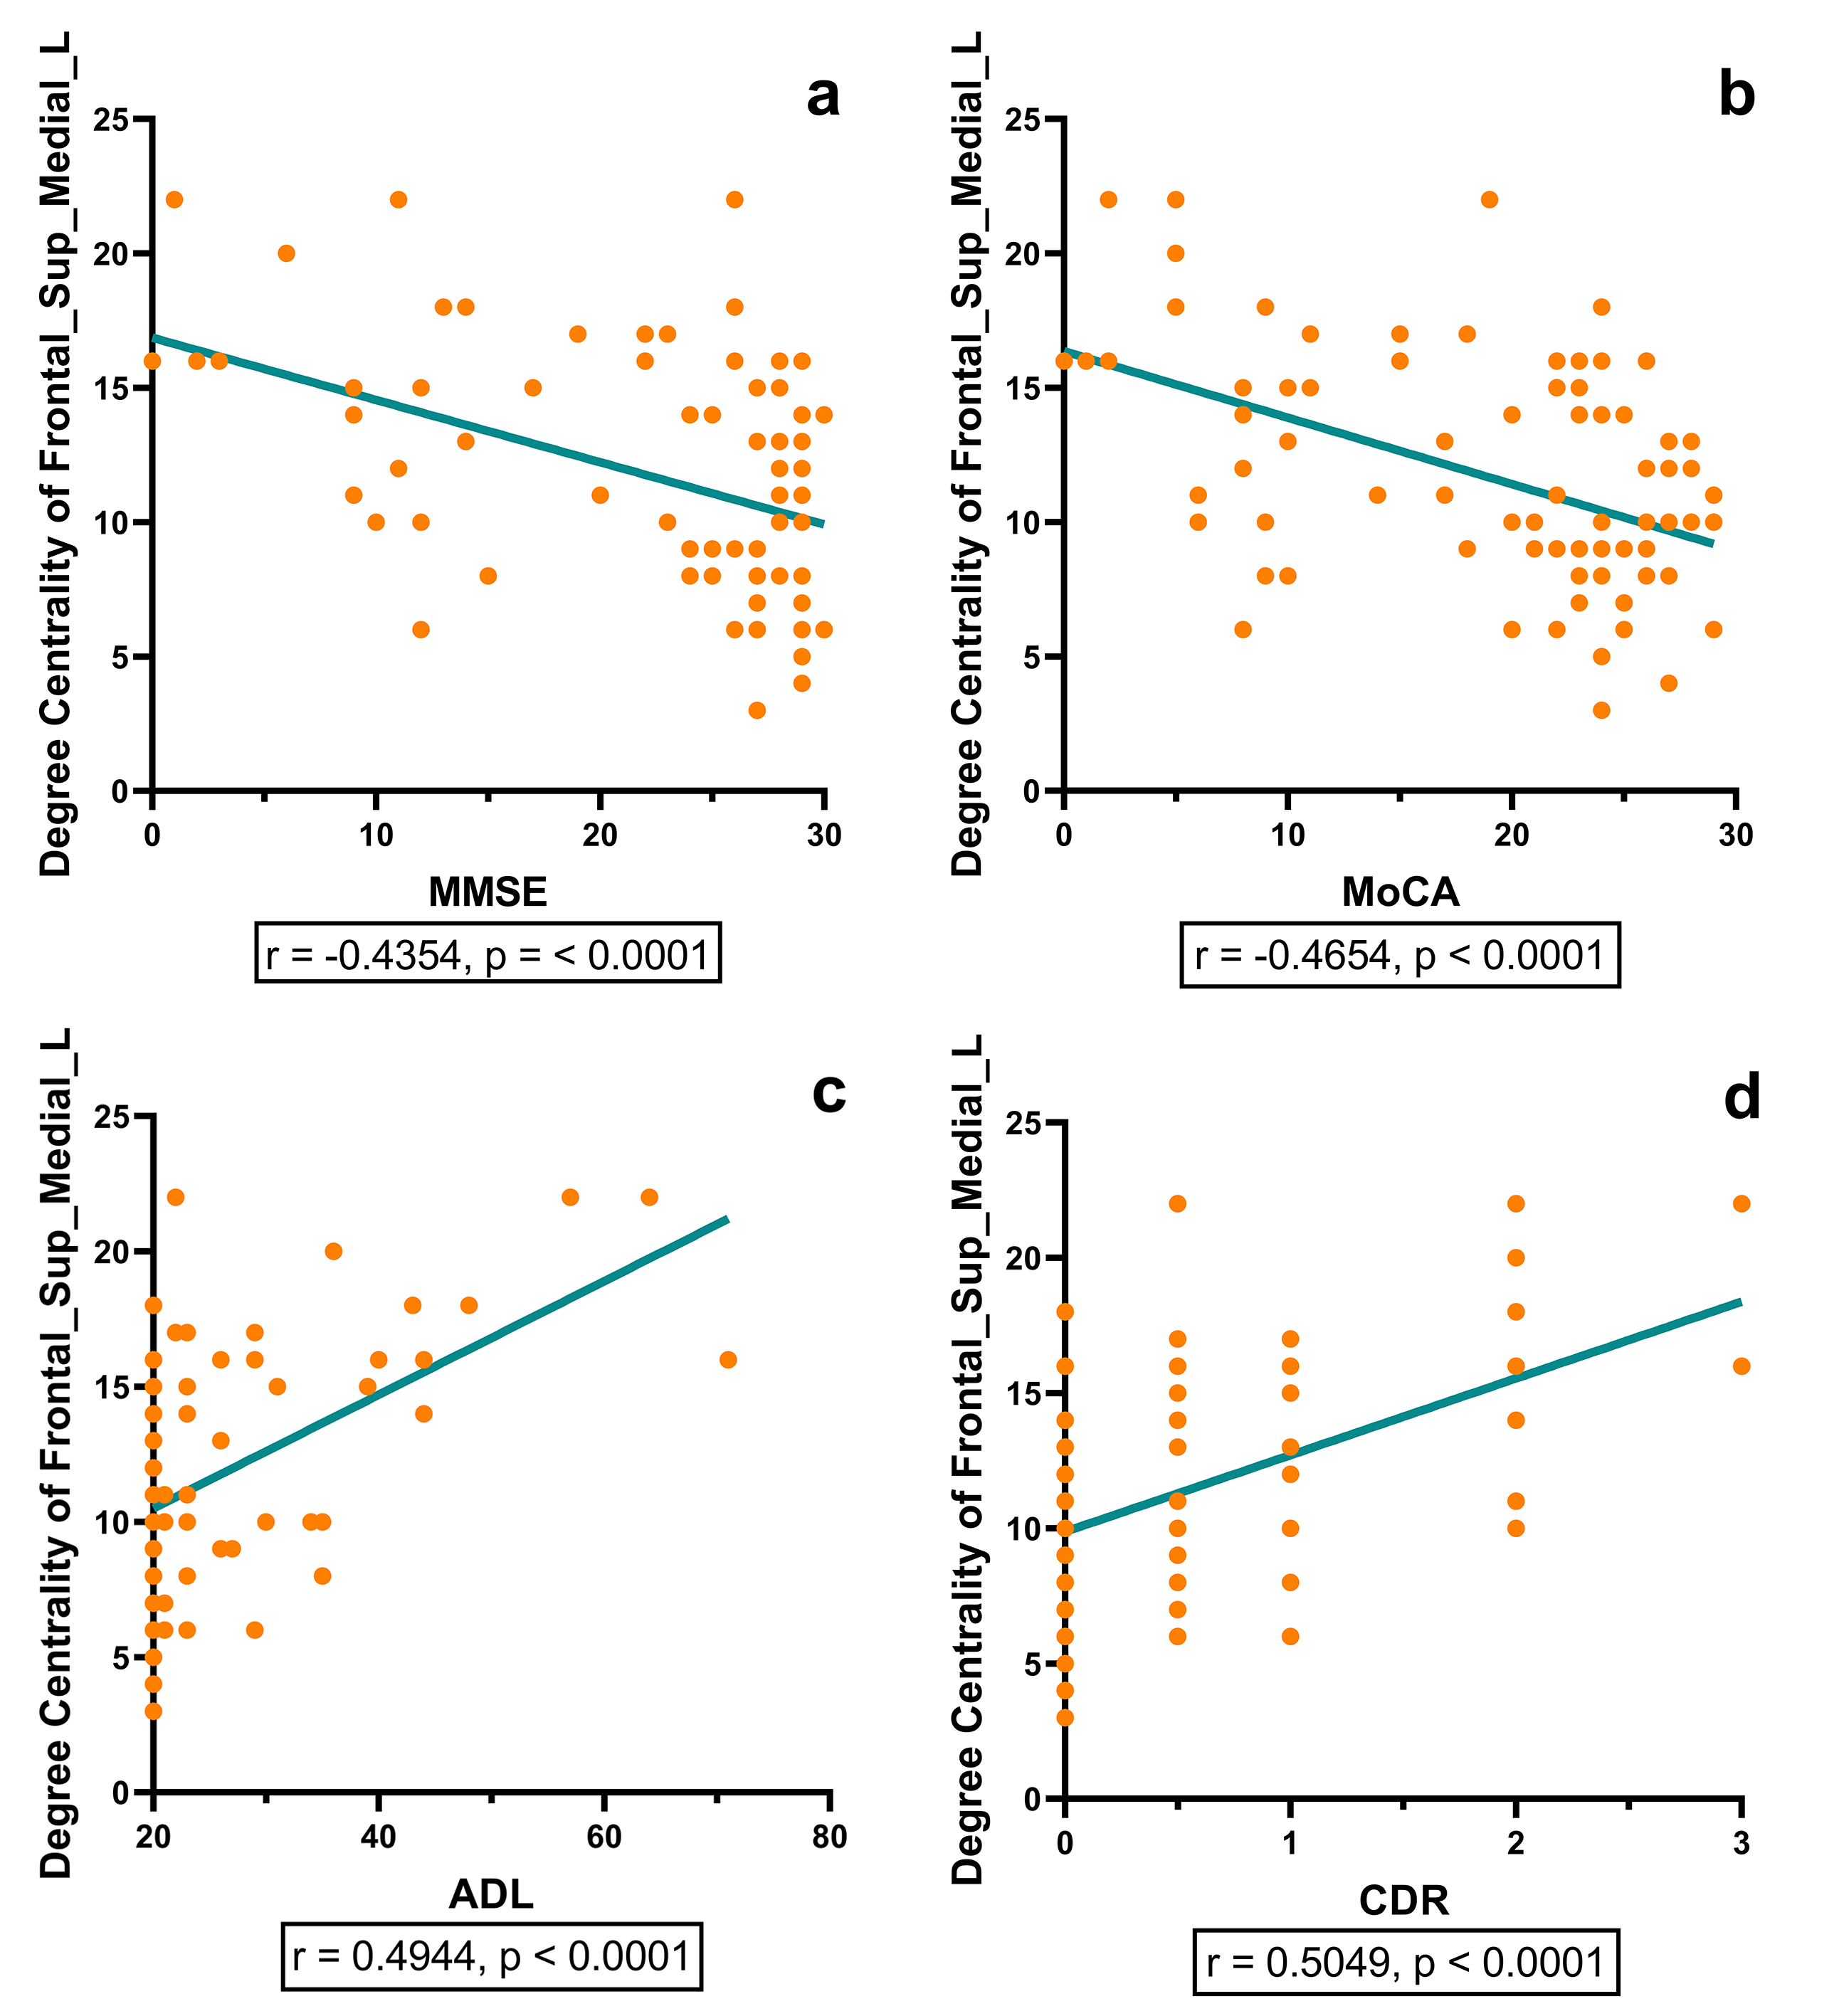
The AD group showed a significantly higher degree centrality in the left middle frontal gyrus and left medial superior frontal gyrus compared with the MCI group (p = 0.0243, p = 0.0188, respectively) and the HC group (p < 0.0001, p = 0.0001, respectively). The MCI group showed a significantly higher degree centrality in the left middle frontal gyrus compared with the HC group (p = 0.0181). The degree centrality of left middle frontal gyrus and left medial superior frontal gyrus significantly correlated with the scores measured by MMSE (r = -0.4259, p = 0.0001; r = -0.4354, p < 0.0001, respectively), MoCA (r = -0.4571, p < 0.0001; r = -0.4654, p < 0.0001, respectively), ADL (r = 0.5054, p < 0.0001; r = 0.4944, p < 0.0001, respectively) and CDR (r = 0.5007, p < 0.0001; r = 0.5049, p < 0.0001, respectively).Discussion and Conclusion
In graph theory, degree centrality is a metric that assesses how much a node communicates with the entire brain and integrates information across functionally segregated brain regions. 4 The frontal gyrus is one of the brain regions that is severely damaged in Alzheimer’s disease. This study found that as disease progressed, the frontal gyrus region has more influence on the entire brain and its integration of information. The higher degree centrality of these nodes in AD and MCI may somehow reflect brain plasticity. 5 Furthermore, the degree centrality of the left middle frontal gyrus and left medial superior frontal gyrus may have significant associations with cognitive function and daily activities, suggesting that the abnormality of degree centrality may act as an effective imaging biomarker to characterize the severity of disease. Future research may include investigating whether there are similar findings in other graph metrics in AD and MCI.Acknowledgements
This work was supported by the Natural Scientific Foundation of China (Grant number 30870713, PI: Hongyan Ni) and the Tianjin Natural Science Foundation Project (Grant number 16JCYBJC25900, PI: Hongyan Ni).References
1. Pereira JB, Mijalkov M, Kakaei E, et al. Disrupted Network Topology in Patients with Stable and Progressive Mild Cognitive Impairment and Alzheimer's Disease. Cereb Cortex 2016; 26:3476-3493.
2. Shi L, Liang P, Luo Y, et al. Using Large-Scale Statistical Chinese Brain Template (Chinese2020) in Popular Neuroimage Analysis Toolkits. Front Hum Neurosci 2017; 11:414.
3. Liang P, Shi L, Chen N, et al. Construction of brain atlases based on a multi-center MRI dataset of 2020 Chinese adults. Sci Rep 2015; 5:18216.
4. Guo Z, Liu X, Hou H, Wei F, Liu J, Chen X. Abnormal degree centrality in Alzheimer's disease patients with depression: A resting-state functional magnetic resonance imaging study. Exp Gerontol 2016; 79:61-66.
5. DelEtoile J, Adeli H. Graph Theory and Brain Connectivity in Alzheimer's Disease. Neuroscientist 2017; 23:616-626.
Figures