1483
Quantitative measurement of age-related change of myelin content in a large sample of Chinese population1Center for Brain Imaging Science and Technology, College of Biomedical Engineering and Instrumental Science, Zhejiang University, Hangzhou, China, 2MR Collaboration, Siemens Healthcare Ltd, Shanghai, China, 3School of Psychology, Capital Normal University, Beijing, China, 4Department of radiology, Xuanwu Hospital Capital Medical University, Beijing, China, 5Department of Imaging Sciences, University of Rochester, Rochester, NY, United States
Synopsis
Magnetic resonance structural images of 902 Chinese subjects were used to study the change of myelin content with the age based on the T1-weighted/T2-weighted ratio. Significant quadratic age effects were observed in white matter tracts and subcortical areas. The gender difference was reflected in the results that the myelin content levels are higher and begin to decline earlier in women. The inverted U-shape myelin-vs-age curve accords with the existing research literature. However, the age of the observed peaks may have been delayed by iron deposition in basal ganglia.
Introduction
Quantitative measurement of myelin content will be of great help in understanding the development of the nervous system and many neurodegenerative diseases.1 The previous studies2,3 suggest that it is possible to use the ratio of signal intensity of T1-weighted (T1W) and T2-wighted (T2W) images to depict myelin map. In this study, such method was applied to a large sample of Chinese population to study the change of myelin content with age progress.Methods
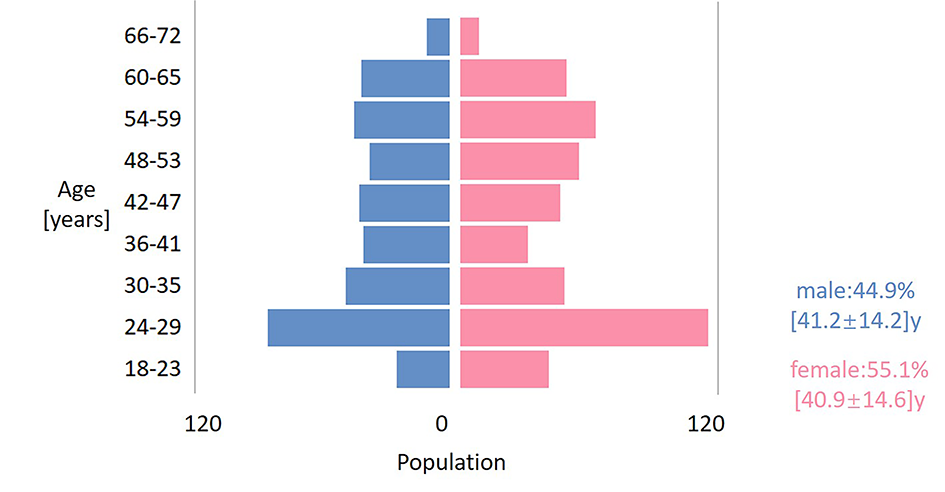
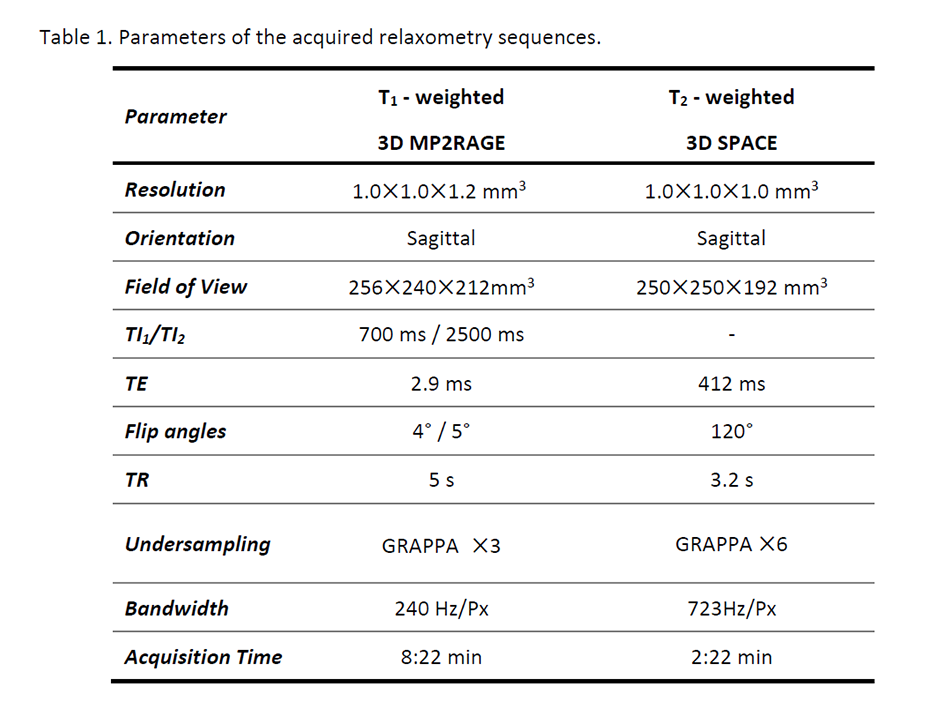
Our study is based on 902 cases of 3D T1W image and T2W image acquired from eleven scanners located at eleven centers in China. The scanners are all 3T MAGNETOM Prisma (Siemens, Healthcare, Erlangen). MP2RAGE4 and 3D T2-SPACE5 sequences were employed for whole brain, with acquisition parameters shown in Table 1. The images were processed with the method proposed by Ganzetti et al.6 Briefly, intensity inhomogeneity was first corrected with SPM12. The bias corrected T2w images were then co-registered to the T1w images through FSL FLIRT tool. An external linear calibration to these images were applied to minimize the effect of intensity scaling. The brain in the subject’s space was registered to the MNI standard space for obtaining registration matrix. Two masks of temporalis and eyes regions were used for calibration. These regions were pre-defined in the ICBM152 template images and then warped into each subject’s space using the inverted registration matrix. Finally, the T1W/T2W ratio image with the contrast to noise ratio for myelin enhanced were obtained, with the derived ratio representing myelin content. After data cleaning with SPSS, regression analysis with gender as a covariable was performed for the selected region of interest (ROI). Changes of myelin content with age was quantitatively investigated. Demographics of the subjects that were included in the analysis are revealed in Figure 1.Results
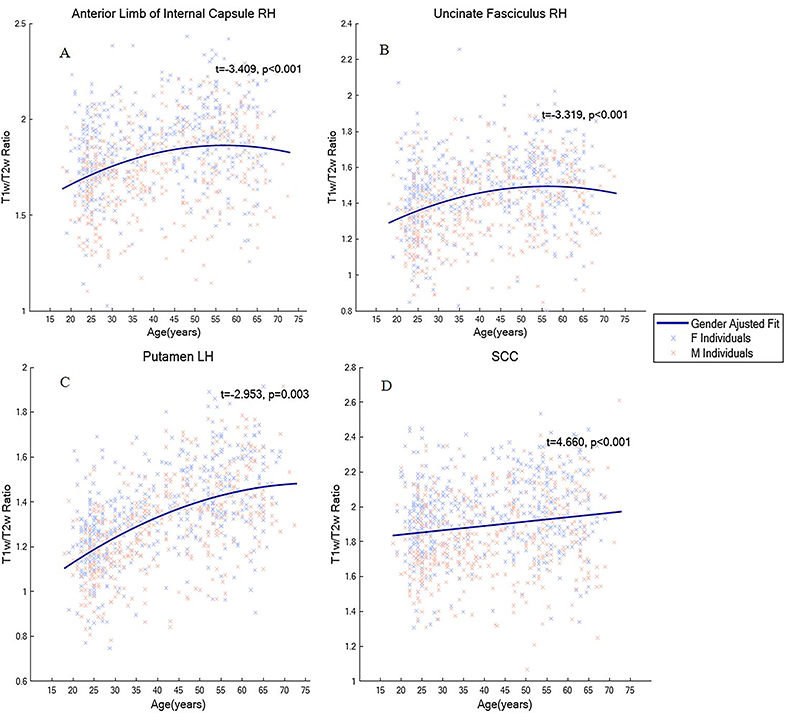
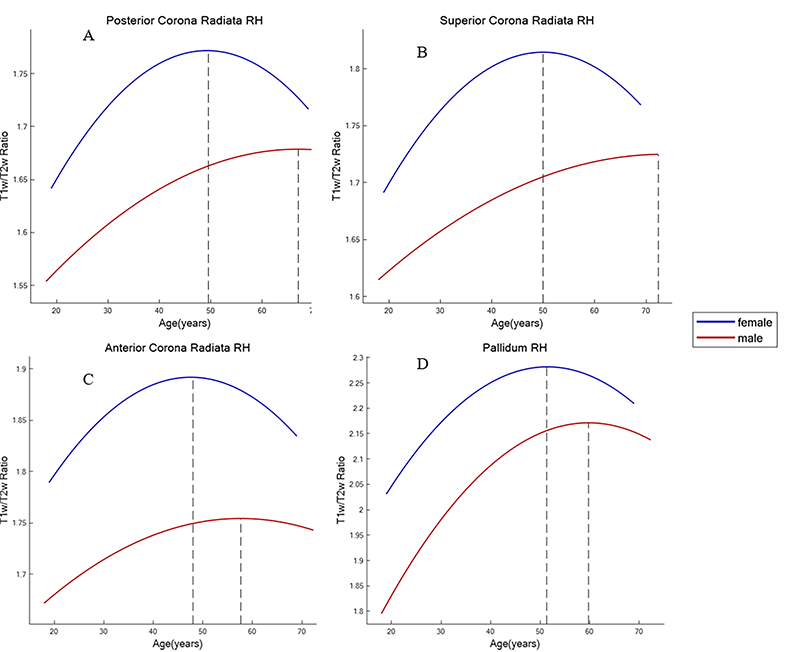
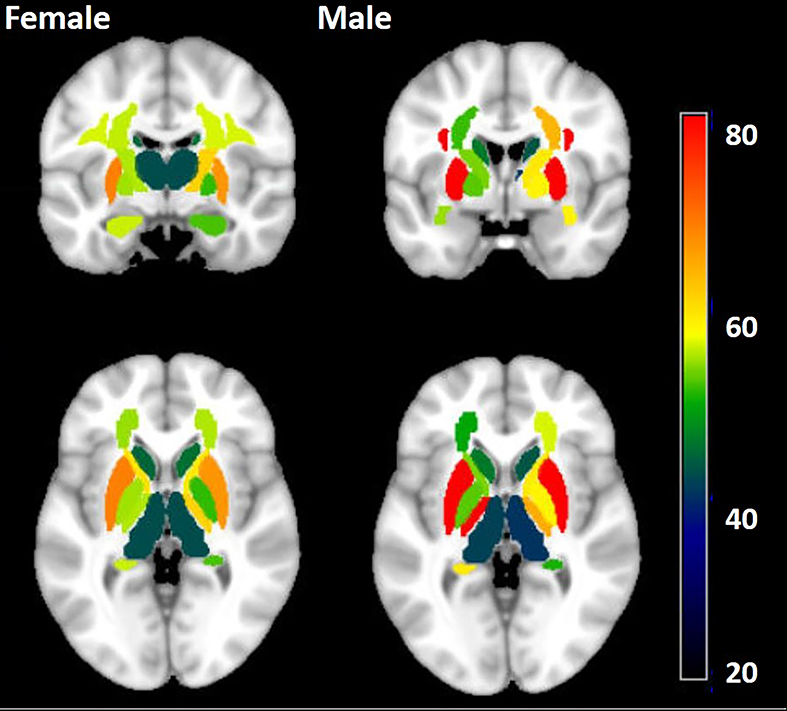
For both male and female, the myelin content trajectory in most of the ROIs shows an inverted U-shape along with age progress. Specifically, caudate and thalamus evidenced the largest quadratic age effects, with the right anterior limb of internal capsule (ALIC), uncinate fasciculus and bilateral pallidum showing weaker relation to age2, and no association with age2 was observed in the genu of corpus callosum (GCC). While the putamen and the splenium of corpus callosum (SCC) showed strong positive linear correlation with age. Regression curve fitting results are shown in Figure 2. In addition, significant gender differences were observed. We found that female myelin content was remarkably higher than that of male in all ROIs studied, except hippocampus (see Figure 3). The turning ages of myelin content change tendency in each ROI ranged from 40 to 60 in this study and female myelin content began to decline earlier than male. Especially in the PCR, PLIC, ACR, pallidum on the right hemisphere. Furthermore, no downward trend was observed in the left PLIC, bilateral SLF and putamen for males in the study age range. The turning points of each ROI are depicted in Figure 4.Discussion
In most of the ROIs, the calibrated T1W/T2W ratio regarded as myelin content showed inverted U-shape curvilinear trajectories, which is consistent with prior studies on the development of myelin content with age.7-10 However, the age at which myelin content begins to decline was found to be later than that of other existing myelin research.11-13 Considering that various means of myelin study are affected by different factors, the age of peak myelin content in each region has not been determined. Consistent with our study, some other studies have shown that women have higher MWF than men.9 At the same time, it was also concluded that there was no significant gender difference in white matter aging trajectories and axonal myelination.12,14 Discrepancy observed in this study might be influenced by the age distribution of different genders. Moreover, our research methods and subjects’ races were different from the above studies, thus the results might be due to true genetic differences. Gender differences in myelin content needs further study. Physiological iron deposition often occurs in the brain, especially in the basal ganglia, leading to a possible increase in the T1W/T2W ratio after iron deposition and therefore an overestimation of myelin content. In this study, no decline trend of myelin content was observed in the putamen within the age range of the study (18-72 years old), which may be due to the fact that the putamen in the adult human brain has highest levels of iron and the content of iron kept increasing.15,16 In contrast, the amount of iron in the caudate did not change significantly with age,15 and the ratio decreased by age 40 as expected. This may well explain the myelin content change trend in basal ganglia.Conclusion
We investigated the changes of brain myelin content with age in Chinese population with 902 samples from eleven acquisition sites based on T1W/T2W ratio, and similar age trajectory of myelin content were obtained with the existing studies. In addition, we observed significantly higher levels of myelin content in women than in men. Besides, myelin content levels begin to decline earlier in women.Acknowledgements
We would like to acknowledge participation in this work from the following hospitals and institutions in China: Beijing Neurosurgical Institute, Beijing Chaoyang Hospital, Henan Provincial People's Hospital, Meizhou People's Hospital, The First Affiliated Hospital of Zhengzhou University, Tianjin Medical University General Hospital, and the Zhongnan Hospital of Wuhan University.References
1 MacKay, A. L. & Laule, C. J. B. P. Magnetic resonance of myelin water: an in vivo marker for myelin. 2, 71-91 (2016).
2 Glasser, M. F. & Van Essen, D. C. J. J. o. N. Mapping human cortical areas in vivo based on myelin content as revealed by T1-and T2-weighted MRI. 31, 11597-11616 (2011).
3 Glasser, M. F., Goyal, M. S., Preuss, T. M., Raichle, M. E. & Van Essen, D. C. J. N. Trends and properties of human cerebral cortex: correlations with cortical myelin content. 93, 165-175 (2014).
4 Marques, J. P. et al. MP2RAGE, a self bias-field corrected sequence for improved segmentation and T1-mapping at high field. 49, 1271-1281 (2010).
5 Scott, K. & Schmeets, S. J. M. F. SPACE: an innovative solution to rapid low SAR T2-weighted contrast in 3D spin echo imaging. 92-95 (2005).
6 Ganzetti, M., Wenderoth, N. & Mantini, D. J. F. i. h. n. Whole brain myelin mapping using T1-and T2-weighted MR imaging data. 8, 671 (2014).
7 Lang, D. J. et al. 48 echo T2 myelin imaging of white matter in first-episode schizophrenia: Evidence for aberrant myelination. 6, 408-414 (2014).
8 Billiet, T. et al. Age-related microstructural differences quantified using myelin water imaging and advanced diffusion MRI. 36, 2107-2121 (2015).
9 Arshad, M., Stanley, J. A. & Raz, N. J. N. Adult age differences in subcortical myelin content are consistent with protracted myelination and unrelated to diffusion tensor imaging indices. 143, 26-39 (2016).
10 Chopra, S. et al. More highly myelinated white matter tracts are associated with faster processing speed in healthy adults. 171, 332-340 (2018).
11 Yakovlev, P. J. R. d. o. t. b. i. e. l. The myelogenetic cycles of regional maturation of the brain. 3-70 (1967).
12 Bartzokis, G. et al. Multimodal magnetic resonance imaging assessment of white matter aging trajectories over the lifespan of healthy individuals. 72, 1026-1034 (2012).
13 Papadaki, E. et al. Age‐related deep white matter changes in myelin and water content: A T2 relaxometry study. (2019).
14 Cercignani, M. et al. Characterizing axonal myelination within the healthy population: a tract-by-tract mapping of effects of age and gender on the fiber g-ratio. 49, 109-118 (2017).
15 Ramos, P. et al. Iron levels in the human brain: a post-mortem study of anatomical region differences and age-related changes. 28, 13-17 (2014).
16 Daugherty, A. M. & Raz, N. J. N. Accumulation of iron in the putamen predicts its shrinkage in healthy older adults: a multi-occasion longitudinal study. 128, 11-20 (2016).
Figures