1482
Quantitative T1 mapping of the substantia nigra using phase-sensitive inversion recovery: a healthy volunteer study at 3.0 T1Department of Medical Image Sciences, Faculty of Life Sciences, Kumamoto University, Kumamoto, Japan, 2Department of Radiology, National Hospital Organization Omuta National Hospital, Omuta, Japan, 3Department of Medical Radiation Sciences, Faculty of Life Sciences, Kumamoto University, Kumamoto, Japan
Synopsis
We estimated the T1 values of the SN in healthy subjects and clarified its correlation with the SN characteristics obtained in neuromelanin (NM) images to identify an imaging biomarker for early diagnosis of PD. In healthy adults, the area and T1 value of the SN, measured quantitatively from PSIR images, has different characteristics from those obtained from NM images, and may help assess SN degeneration.
Introduction
Parkinson's disease (PD) is the second most common neurodegenerative disorder after Alzheimer’s disease. The main pathological focus in parkinsonism is the substantia nigra pars compacta (SNc) of the midbrain, and the primary pathological issue is dopamine deficiency in the striatum, due to the loss of dopaminergic neurons within the SNc.Neuromelanin (NM) imaging can assess degeneration of the SNc directly using a TSE sequence. Although NM imaging is a useful technique for diagnosing PD, it is difficult to quantitative evaluation for slight changes of SN because the contrast in the NM image is changed not only by the severity of PD but also by imaging parameters related to the scanner and the static magnetic field. There is, therefore, a need for an imaging technique that allows quantitative evaluation of the degeneration of the SN.
It is considered that the T1 value of the SN may be altered with degeneration. If the T1 value of the SN could be measured during routine MRI examination, it could provide a quantitative evaluation of the degeneration of the SN. A 3D phase-sensitive inversion recovery (PSIR) sequence can obtain high T1 contrast and simultaneously measure the T1 value of the tissue with high accuracy. Since PSIR can be easily implemented in a clinical setting, it may also be applicable for assessment of the SN.
The relationship between age and the T1 value of the SN is not clear. Moreover, the correlation between the contrast of the SN obtained by NM imaging and the T1 value of the SN has not been clarified. This needs to be clarified in healthy subjects first, before attempting to use T1 values of the SN in PD patients. Thus, the purpose of this study was to estimate the T1 value of the SN in healthy subjects, and to clarify its correlation with the characteristics of the SN obtained in NM images.
Materials and Methods
All examinations in this study were performed using a 3.0-T MRI (Ingenia, Philips Healthcare, Best, The Netherlands). Thirty-two healthy volunteers were enrolled (mean age, 52.4 years; age range, 36–63 years). NM and PSIR images of the midbrain were obtained from all volunteers.NM imaging was performed using a 2D TSE sequence. The 3D PSIR sequence consisted of an inversion pulse and TFE readouts at two TIs. The magnitude and reference images were obtained at the first and second TIs, respectively. Real image (phase-sensitive images) at the first TI were produced using magnitude and reference images.
The signal intensity of cerebral peduncle (CP) and SN on the NM image was measured. The contrast between the SN and CP was calculated. As for PSIR imaging, we carefully traced the ROIs of both SNs on the magnitude image. The signal intensity of the SN, the area of the SN, and the contrast between the SN and CP on the PSIR image was measured. Moreover, the T1 value of the SN was calculated using PSIR and reference images in accordance with the iterative process reported by Warntjes et al.
Results
Figure 1 shows the representative images in a volunteer. There was a significant negative correlation between age and SN area obtained using PSIR imaging (r = -0.37, p = 0.037). No significant correlation was found between age and SN area measured on the TSE image (r = 0.126, p = 0.49) (Fig. 2).The SN area on PSIR image was thus significantly larger than that on the NM image (p < 0.0001). No significant correlation was found between age and contrast with either imaging approach (r = 0.022, p = 0.905 for NM images, and r = 0.126, p = 0.49 for PSIR images) (Fig .3).
The contrast on PSIR images was thus significantly greater than that on NM images (p < 0.0001). There was a weak positive correlation between age and the T1 value of the SN, which was a not significant (r = 0.31, p = 0.080) (Fig. 4). There was a significant negative correlation between the SN area and the T1 value (r = -0.59, p = 0.004) (Fig. 5).
Discussion
In this study, we measured the area and T1 value of the SN in healthy volunteers using PSIR to assess its characteristics in non-pathological conditions. We demonstrated that the area and T1 value of the SN changes with age. We also confirmed that the contrast of the SN on PSIR images was higher than that on NM images, which enables easy identification of the SN by PSIR imaging. Contrast of PSIR was significantly higher than that obtained with NM imaging. Thus, the PSIR is useful for identifying the SN region. The T1 value of SN estimated by PSIR may correlate with NM accumulation in the SN. Although we have not validated this finding pathologically, measurement of T1 value of the SN using PSIR may help evaluate degenerative changes of the SN on NM imaging.In conclusion, the quantitative measurements of the T1 value and area of the SN using PSIR imaging in healthy adults differ from those obtained by NM imaging. PSIR imaging may allow the evaluation of SN degeneration.
Acknowledgements
No acknowledgement found.References
- Sasaki M, et al. Neuroreport. 2006;17:1215–1218.
- Hutchinson M, et al. Neuroimage. 2003;20:1899–1902.
- Kellman P, et al. Magn Reson Med. 2002;47:372–383.
- Warntjes MJ, et al. BMC Med Imaging. 2010;10:1992–1910.
- Fujiwara Y, et al. Acta Radiol. 2016;58:899–905.
- Okubo G, et al. J Magn Reson Imaging. 2015;43:55–62.
Figures
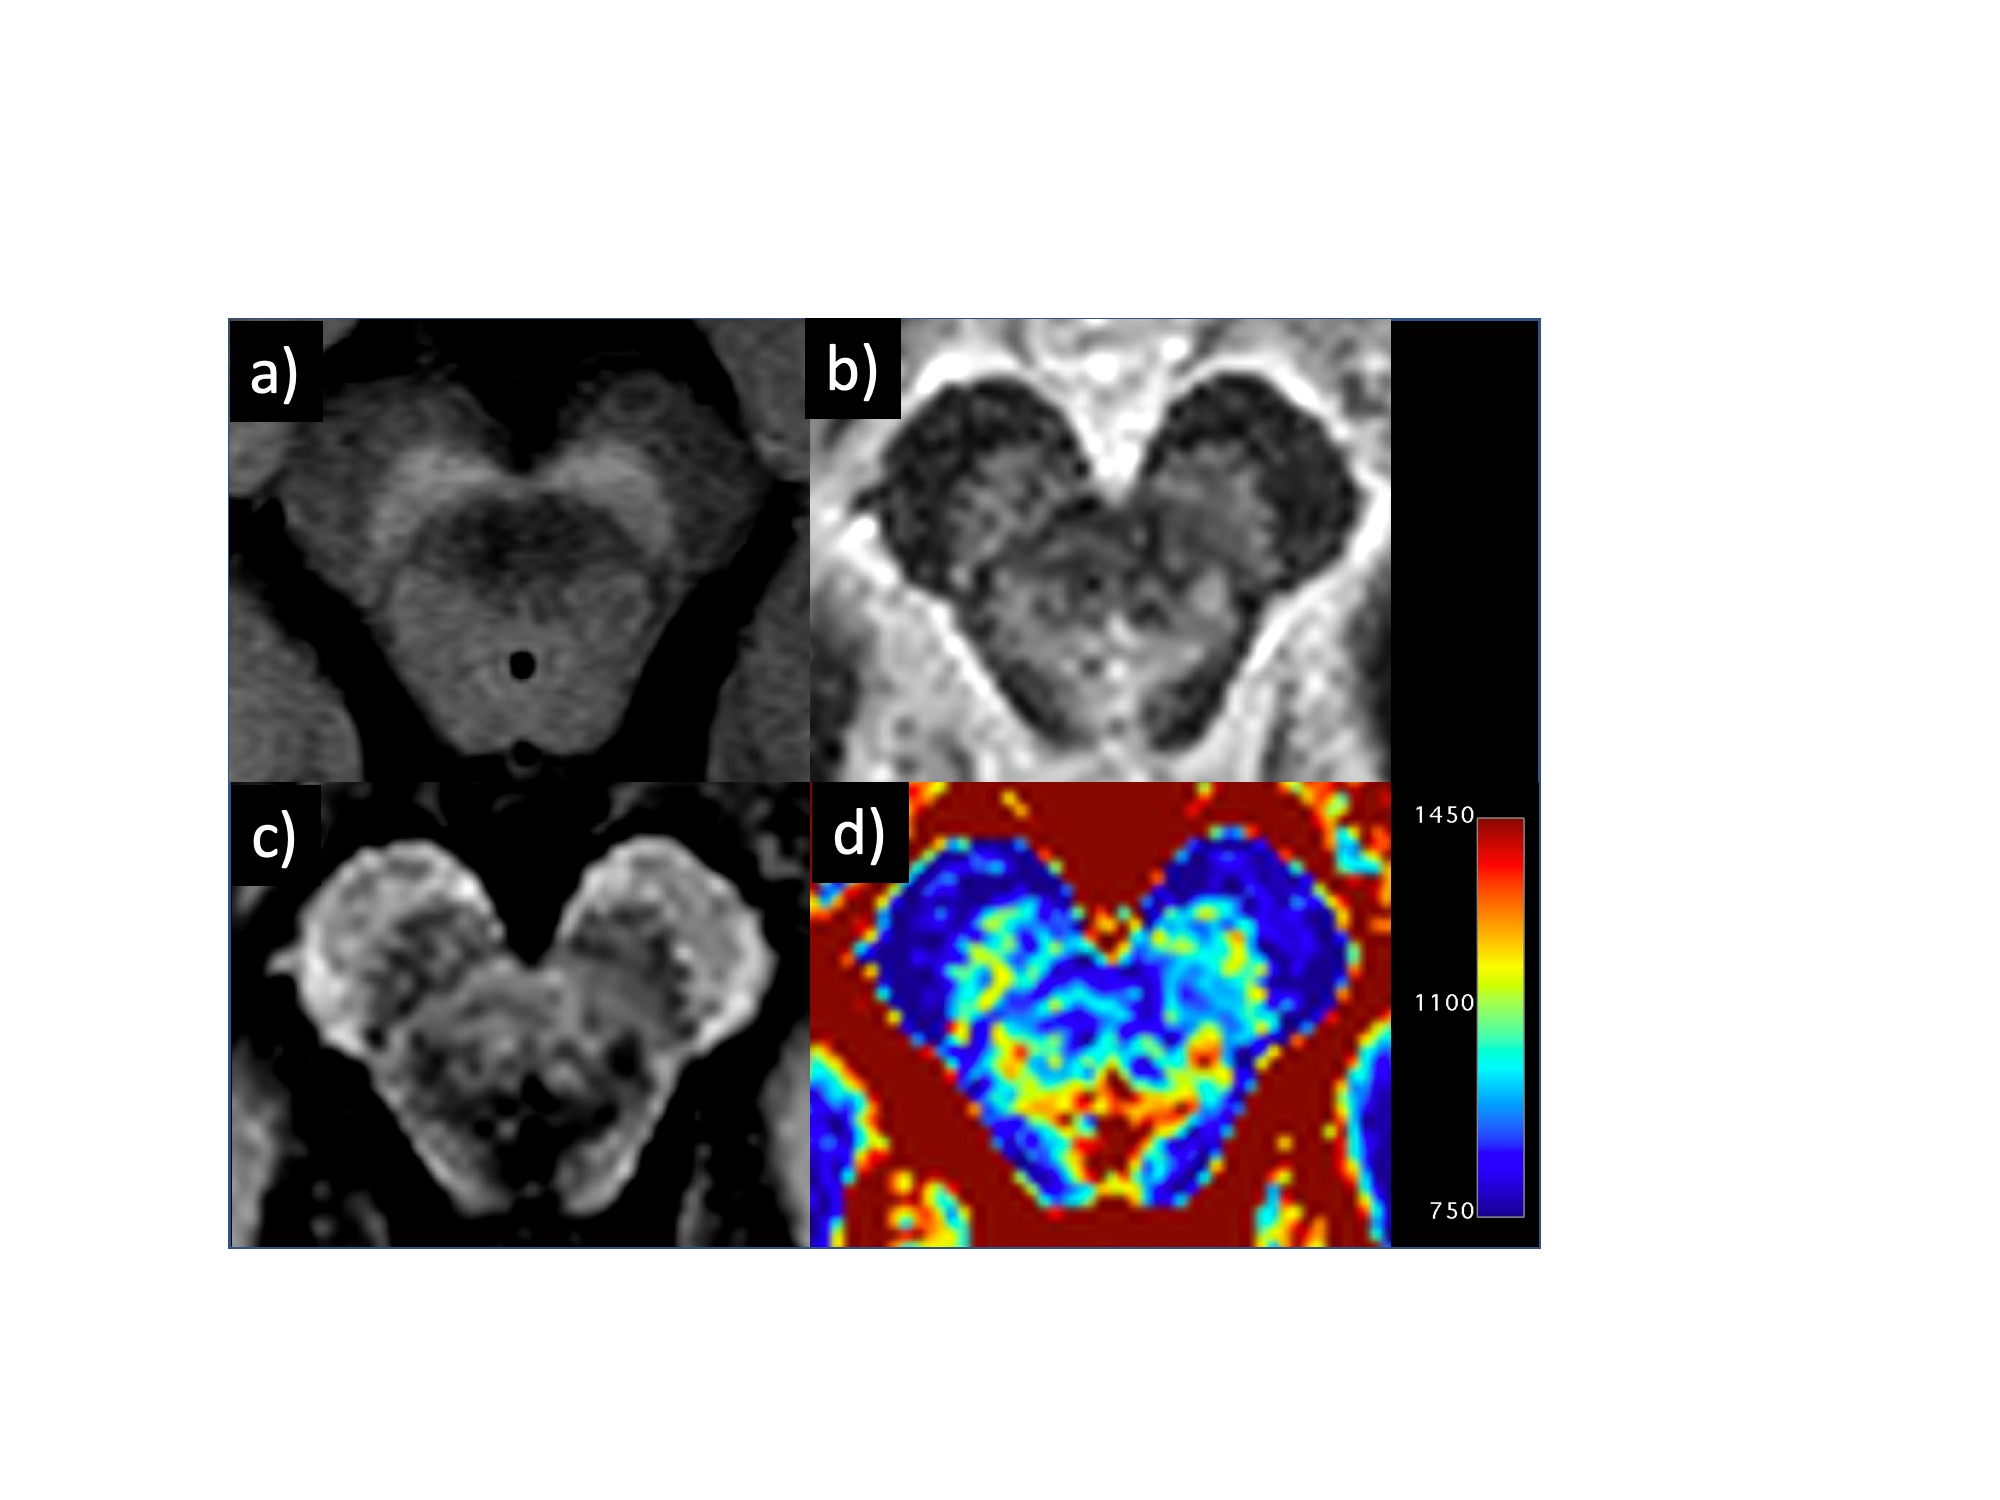
Figure 1
Representative neuromelanin (a), magnitude (b), PSIR (c), and T1 mapping (d) images obtained in a 59-year-old man.
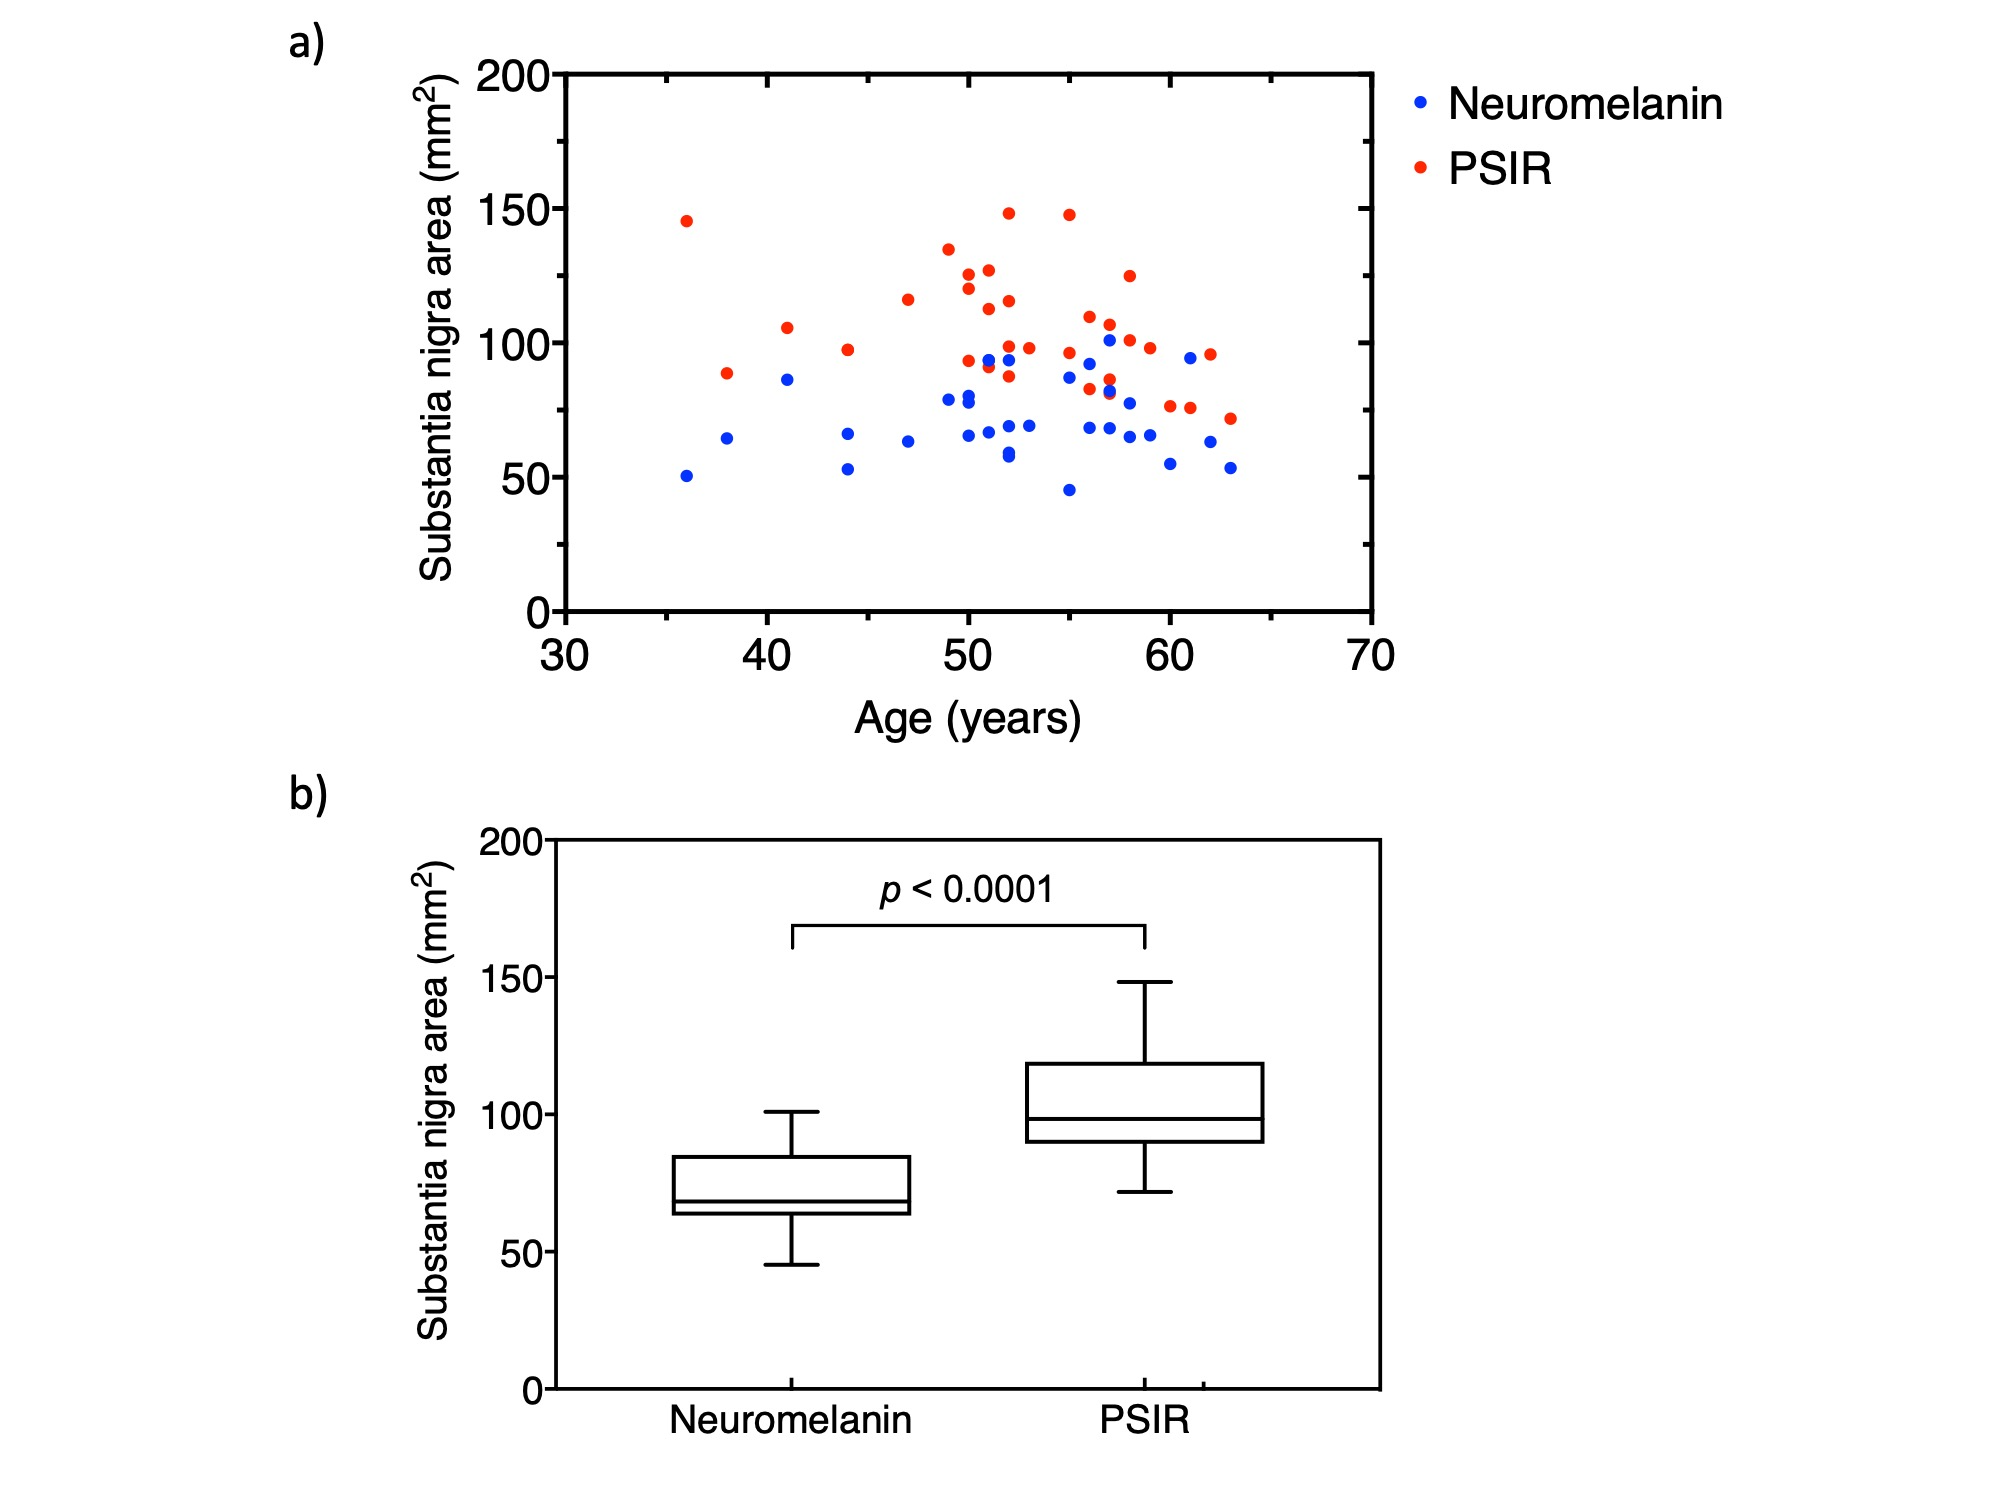
Figure 2
(a) Relationship between age and substantia nigra area obtained by neuromelanin (NM) and PSIR imaging. (b) Comparison of substantia nigra area in all subjects obtained by NM and PSIR imaging.
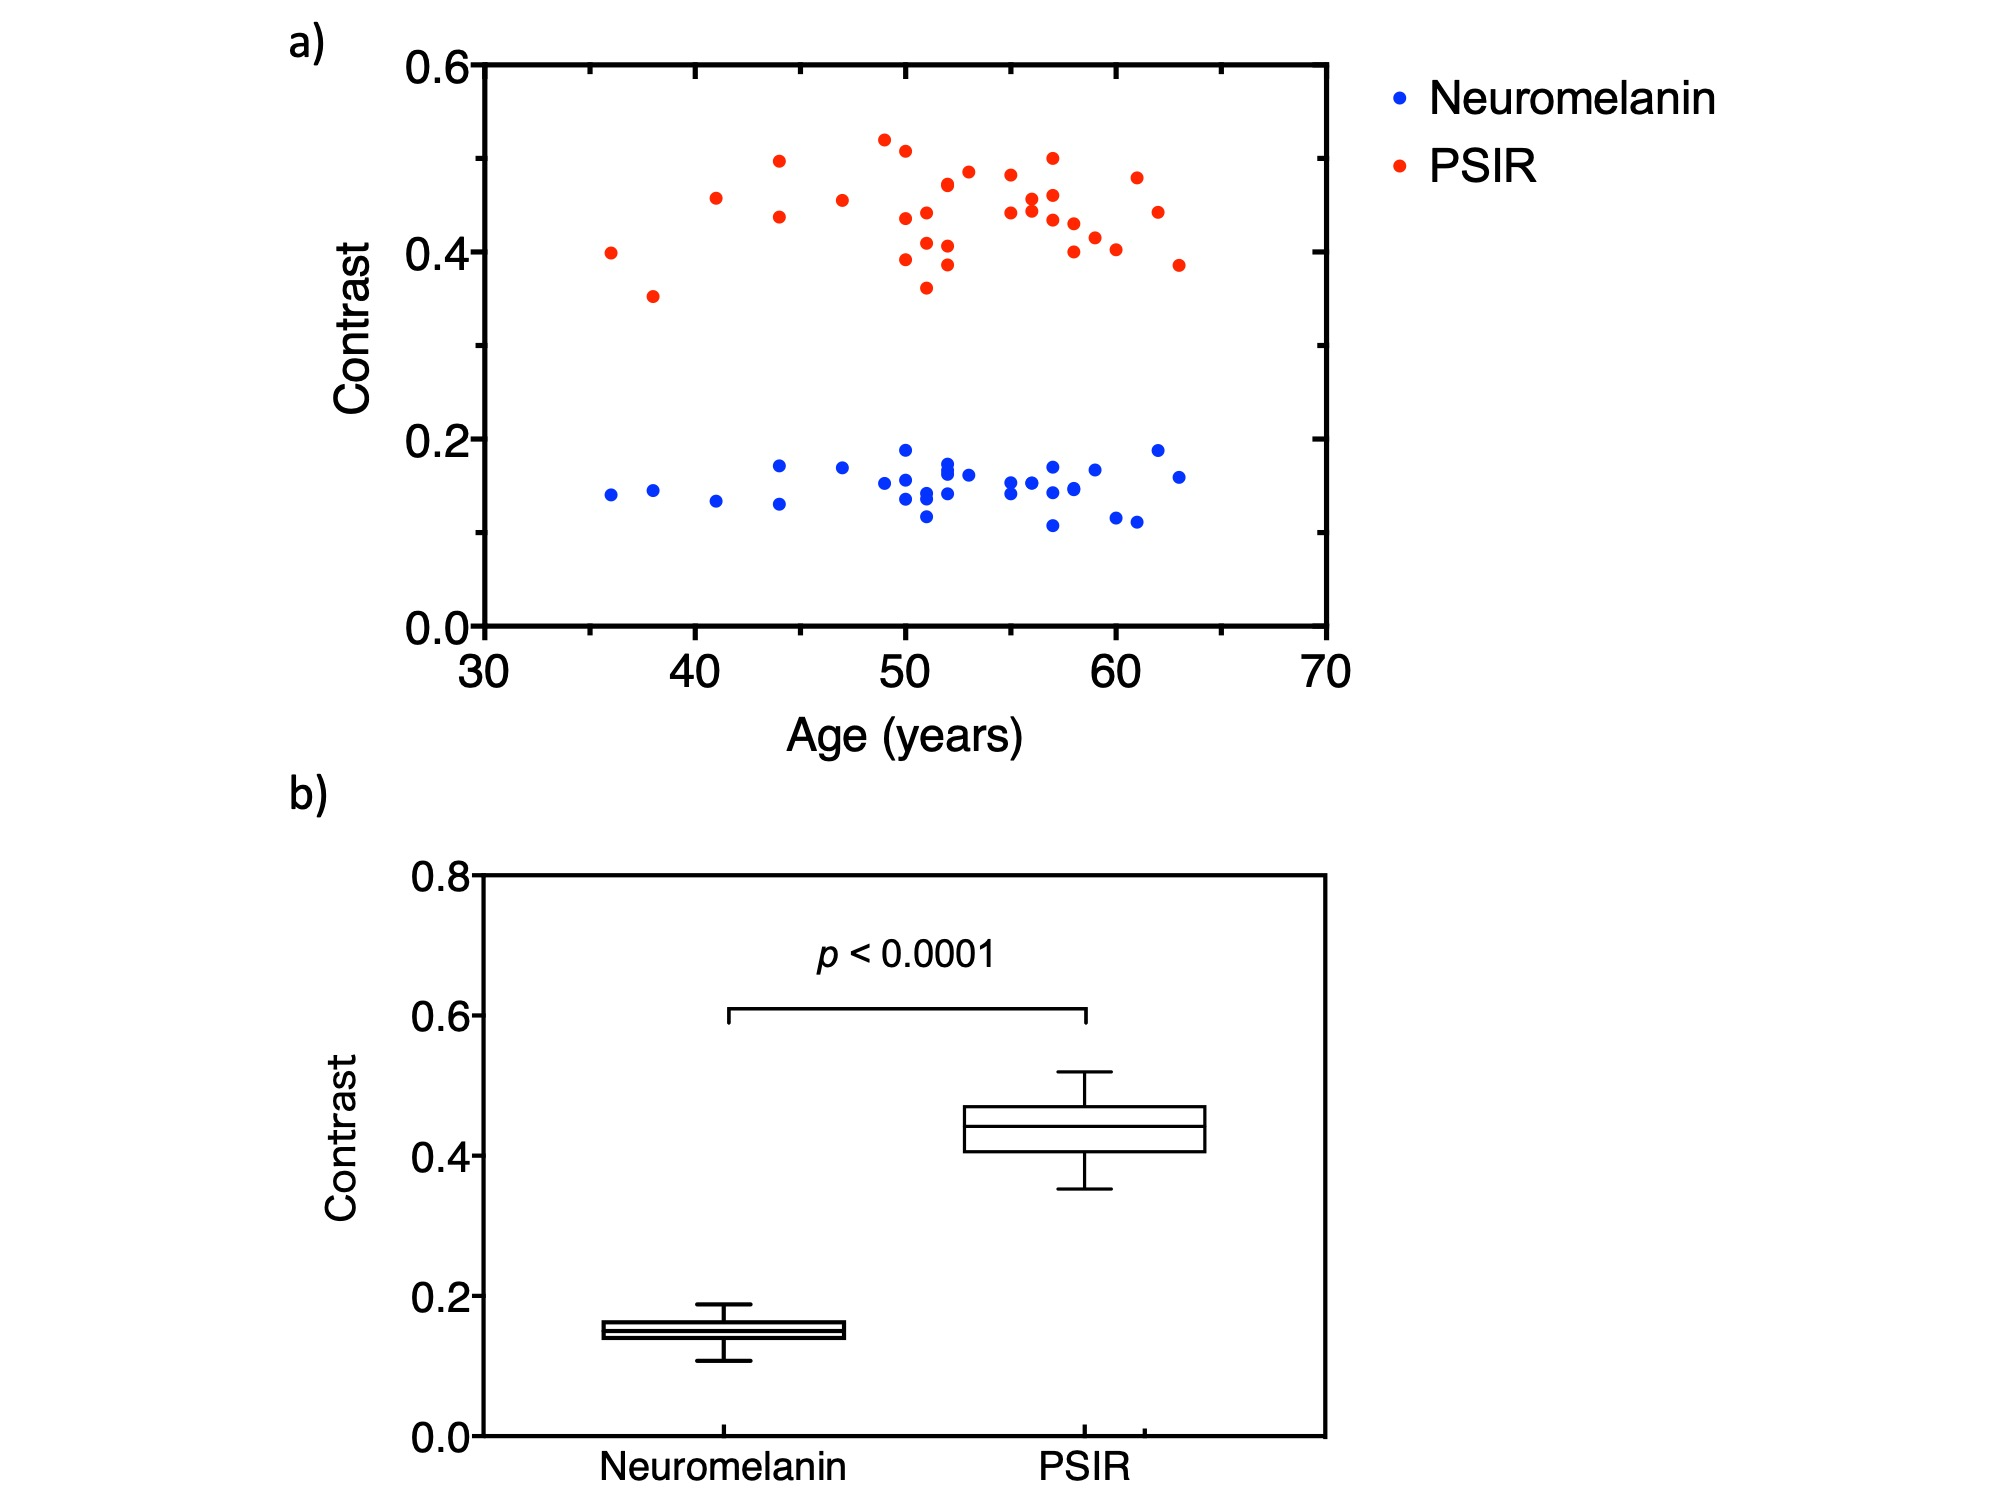
Figure 3
(a) Relationship between age and contrast between the substantia nigra and the cerebral peduncle obtained with neuromelanin (NM) and PSIR imaging. (b) Comparison of the contrast in all subjects obtained by NM and PSIR imaging.
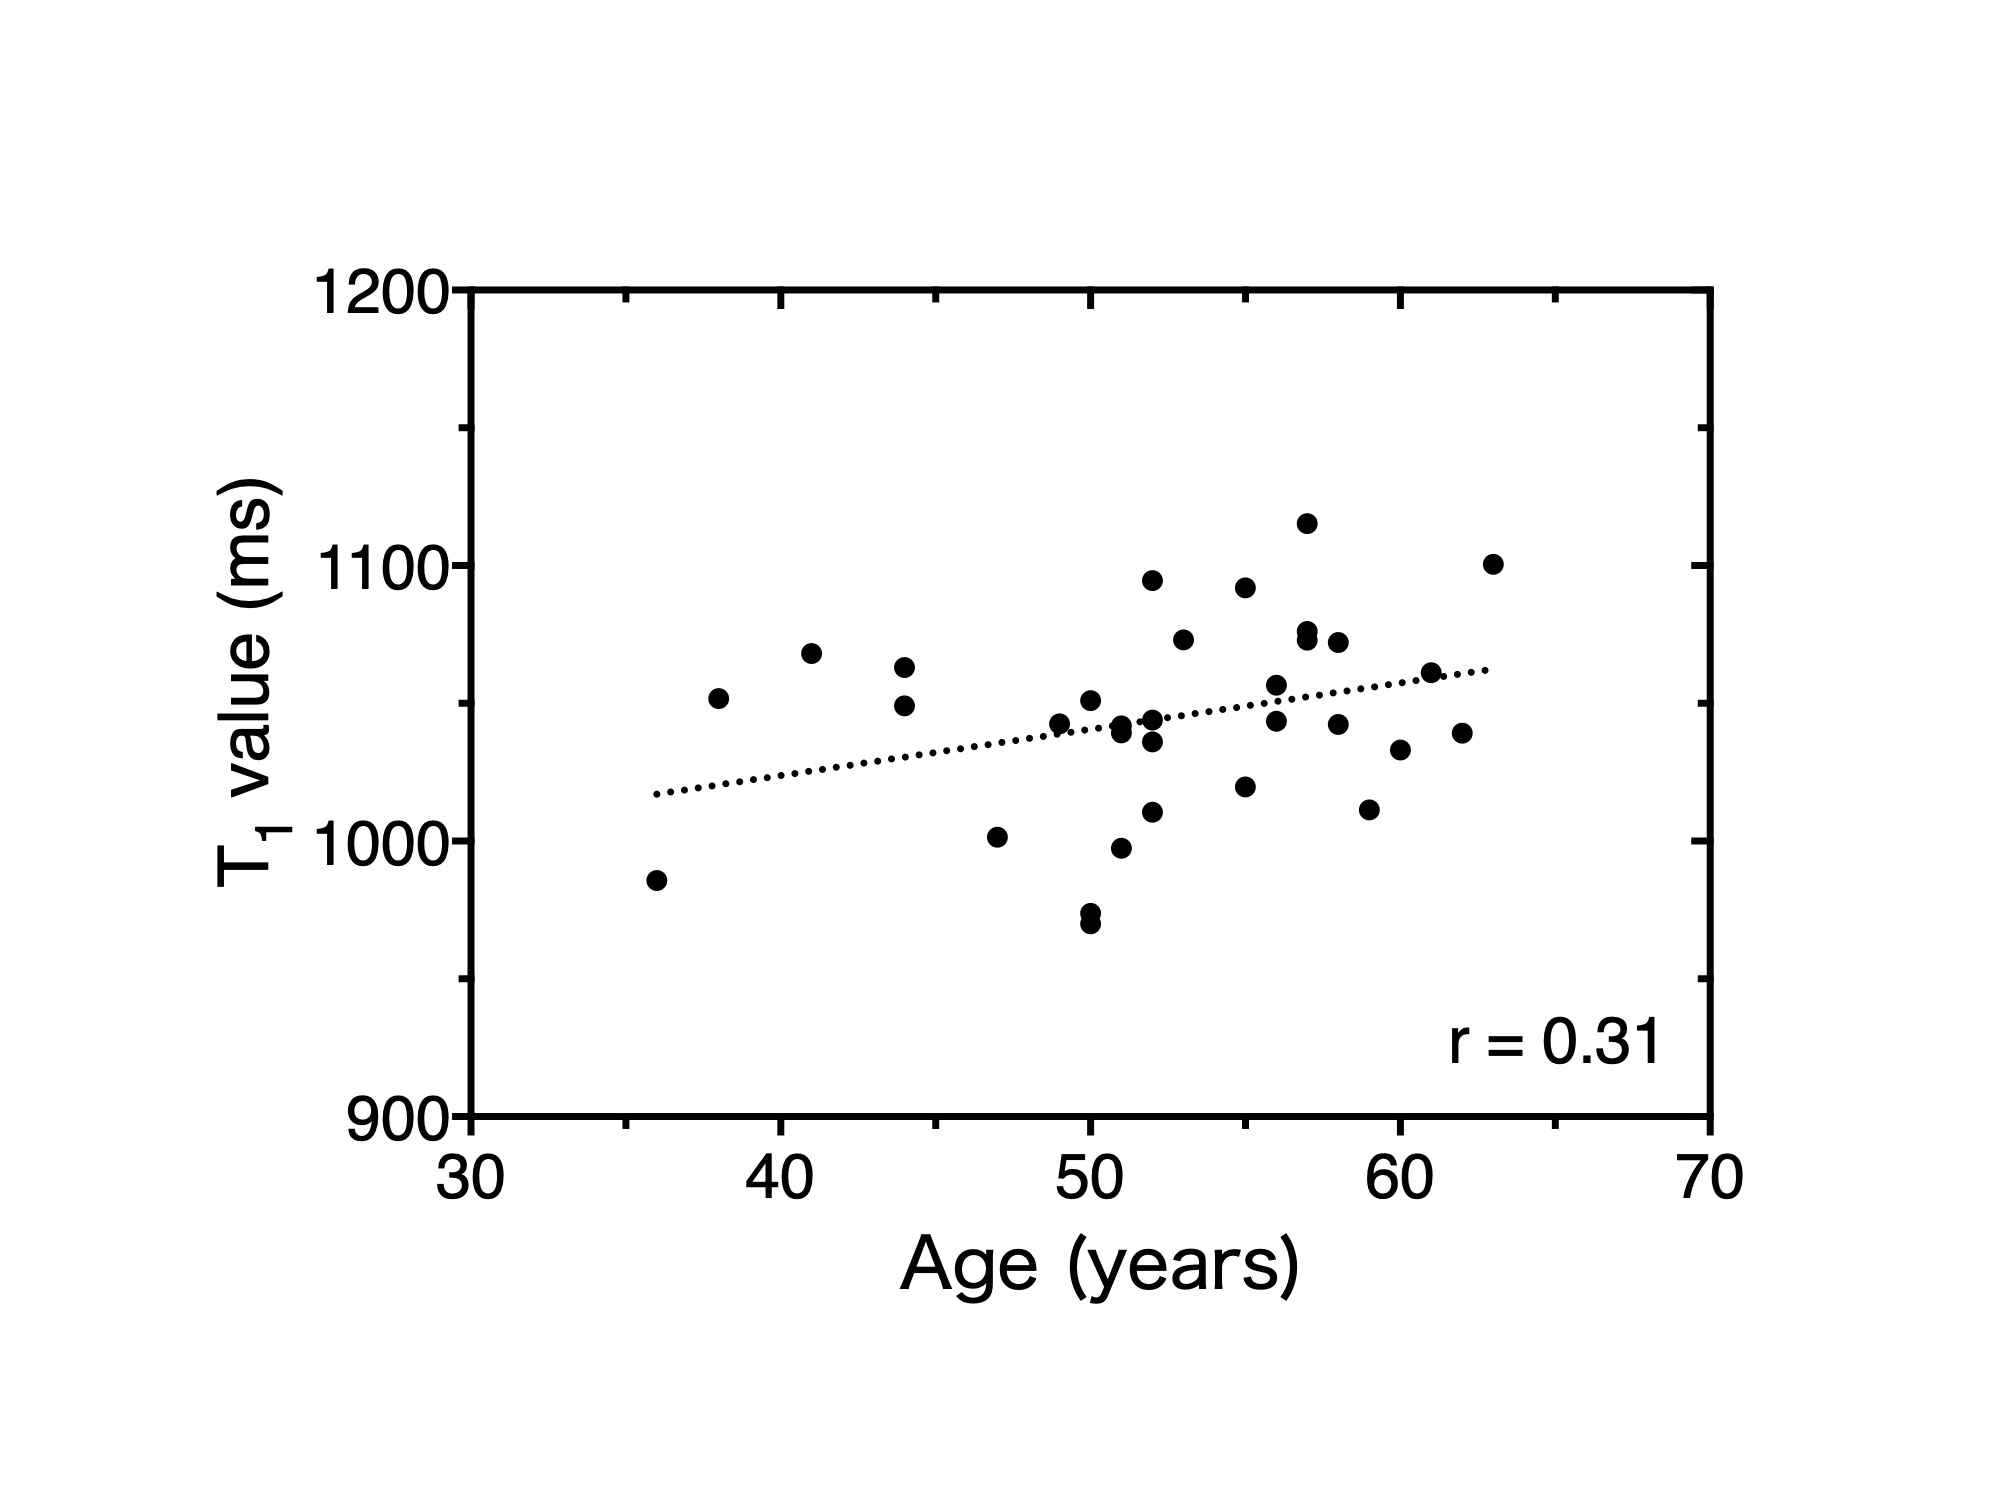
Figure 4
Relationship between age and the T1 value of the substantia nigra measured by PSIR. There was a weak positive correlation between age and the T1 value of substantia nigra, which was not significant (r = 0.31, p = 0.080).
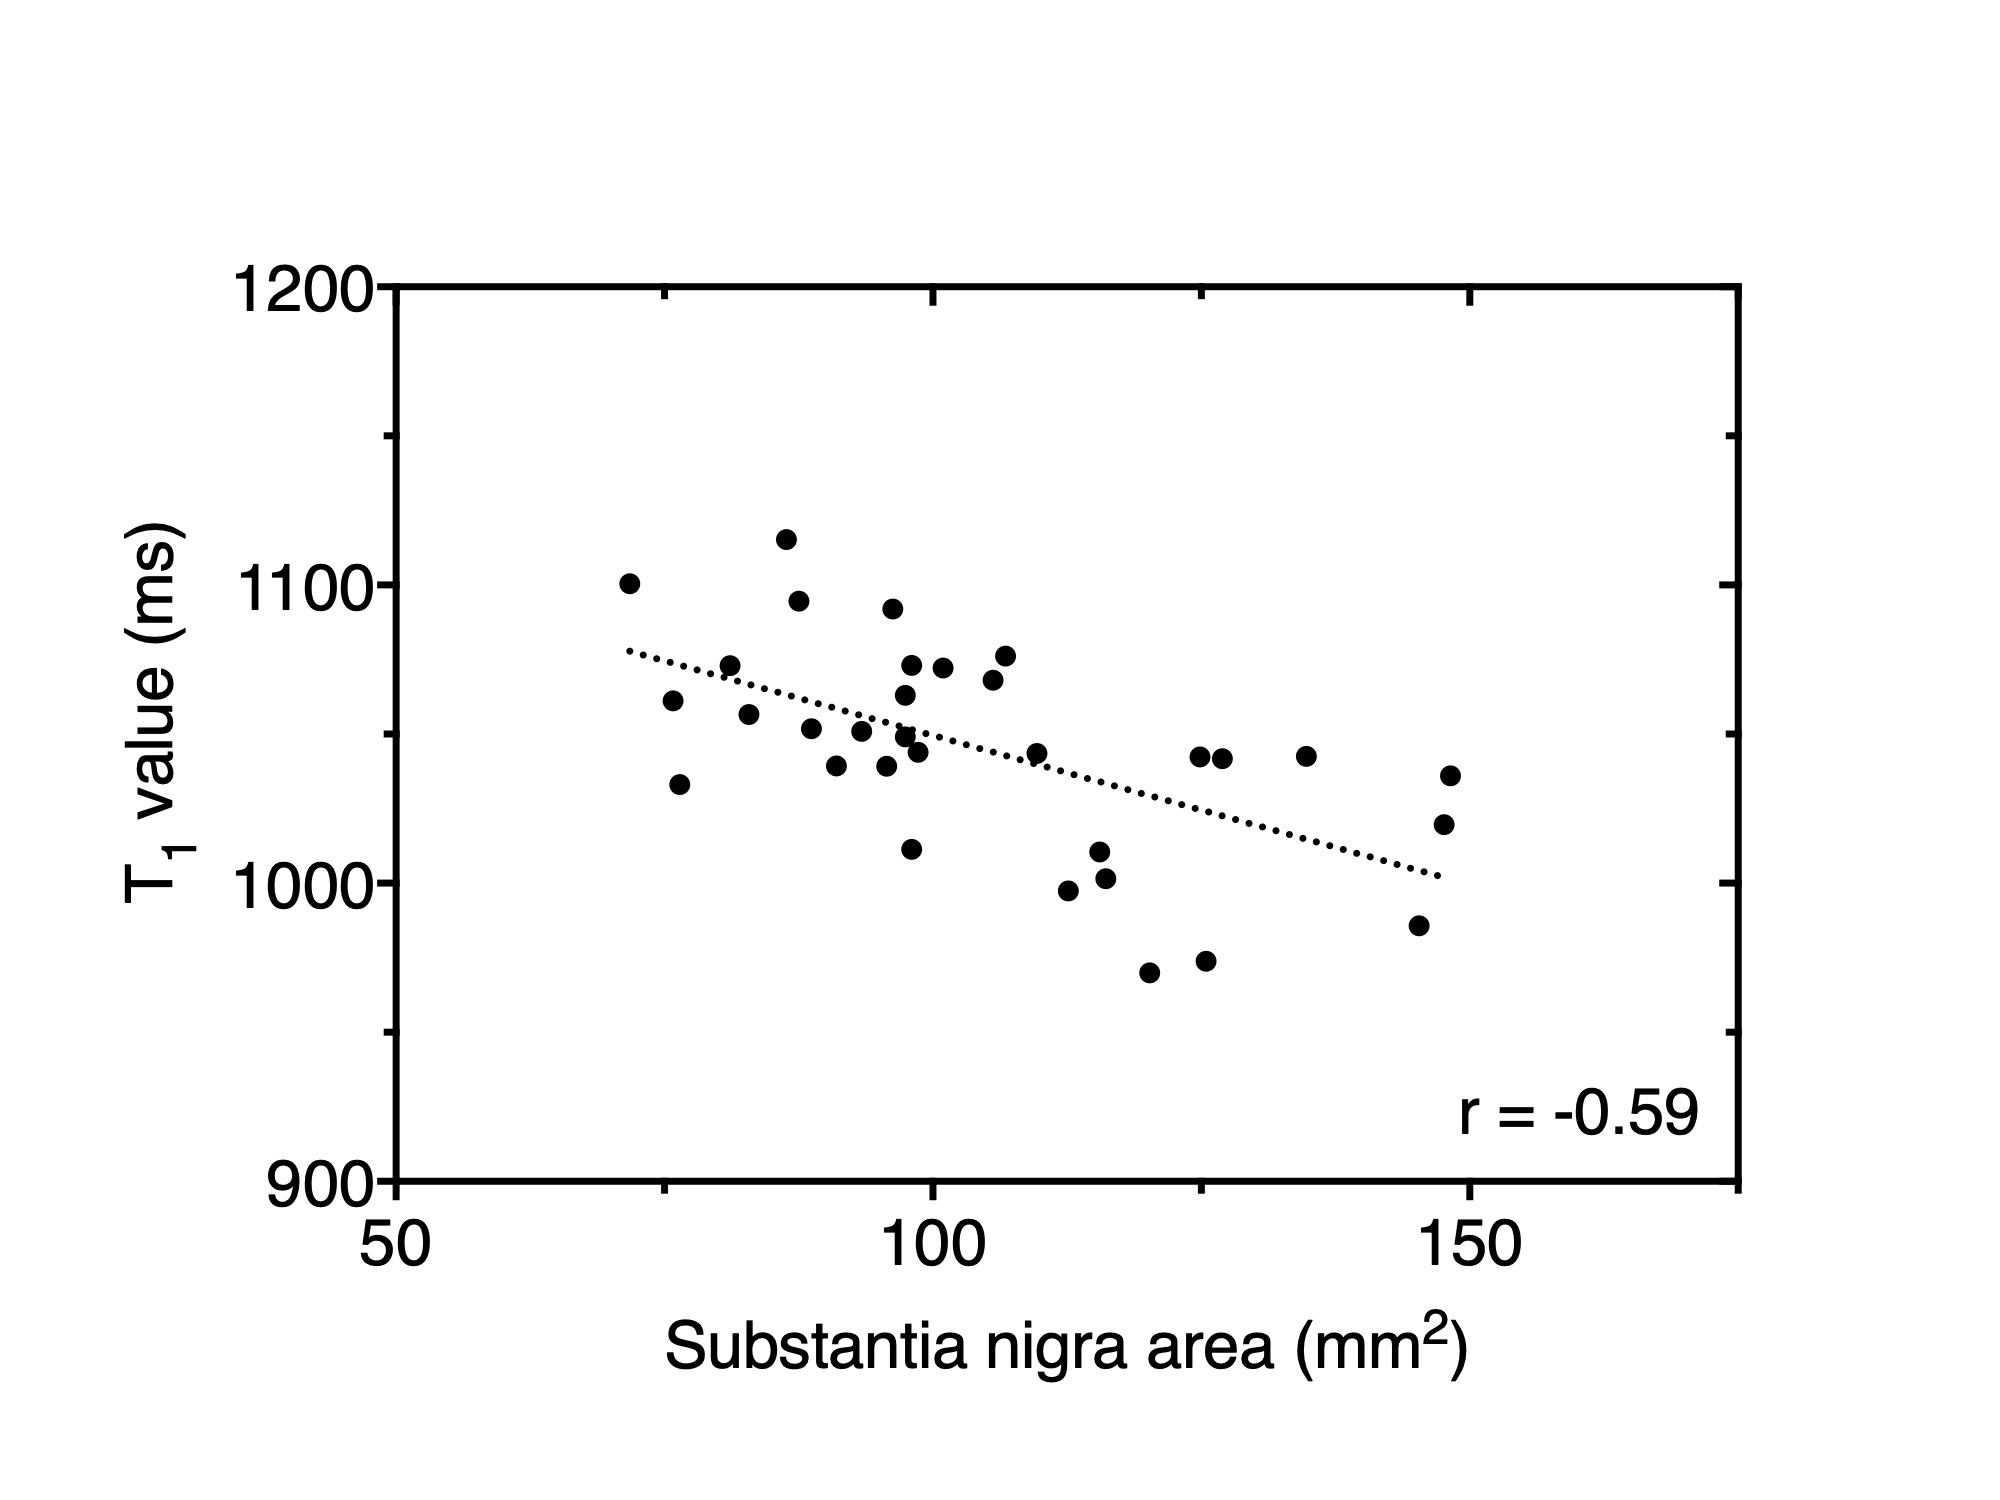
Figure 5
Relationship between the substantia nigra area and T1 value based on PSIR imaging. There was a significant negative correlation between the substantia nigra area and T1 value (r = -0.59, p = 0.037).