1481
Longitudinal assessment of brain iron deposition in Alzheimer’s disease1Department of Neurology, Medical University of Graz, Graz, Austria, 2Institute for Medical Informatics, Statistics and Documentation, Medical University of Graz, Graz, Austria, 3Department of Radiology, Medical University of Graz, Graz, Austria
Synopsis
Using R2* relaxation rate mapping we found higher iron concentrations in the deep grey matter and neocortical regions in 101 patients with Alzheimer’s disease compared to 101 age-matched community-dwelling individuals. AD patients had significantly higher R2* in the temporal and occipital lobes and caudate nuclei. Independently of brain volume loss, changes in cortical iron levels over time were associated with cognitive decline in participants with Alzheimer's disease.
Introduction
Increased brain iron deposition has been repeatedly reported in Alzheimer’s disease (AD) patients. The majority of AD studies have investigated in vivo iron levels in deep gray matter. Only few studies evaluated iron deposition in AD outside the basal ganglia 1,2, which are clinically highly relevant but challenging to assess from an MRI perspective because of discontinuities in the magnetic susceptibility resulting mainly from air-tissue boundaries in the brain.3 To our knowledge, no published study has examined the relationship between the longitudinal iron change in the neocortex and the cognitive decline in AD. In this study, we assessed brain iron in a large clinical cohort of participants with AD by R2* relaxation rate mapping using an advanced correction method which also allows for the R2* calculation in neocortical regions. We compared the global and regional iron differences between AD cases and age-matched controls, evaluated the longitudinal R2* change in patients with AD over a 17 months follow-up period and correlated the longitudinal iron data with the cognitive decline.Methods
101 participants with AD (mean age=72.7±8.7 years) and 101 age-matched healthy controls (HC) from a community-dwelling study were included. Of the 101 participants with AD, 59 had subsequent neuropsychological testing and MRI at a mean follow-up of 1.39±0.54 years. All study participants underwent MRI at 3 Tesla including R2* relaxation rates mapping, corrected for macroscopic field variations. Anatomical structures were segmented using FreeSurfer and median R2* rates were calculated in the neocortex and cortical lobes, the basal ganglia, hippocampus and thalamus. Multivariate linear regression analysis was applied to study the differences of the R2* levels between groups and the association between longitudinal changes in R2* and cognition.Results
Characteristics of study participants are shown in Table 1. Smoking was the only one risk factor that was different between AD and HC. Table 2 shows the comparison of R2* in total and regional grey matter between AD and HC. After correcting for smoking and regional volumes, R2* remained higher in the whole cortex including total neocortex and the deep grey matter in AD patients as compared to HC (p <0.01; p= 0.01, respectively). Regionally, AD showed higher R2* in the temporal (p <0.01) and occipital lobes (p= 0.01) and in the caudate nuclei (p <0.01). Table 3 summarizes the global and regional annualized percentage R2* rates. R2* in parietal lobe decreased whereas R2* relaxation rates of global basal ganglia, putamen, caudate nucleus and thalamus increased over time (Table 3). R2* change in the temporal and occipital lobes, after adjustment for change in brain volume over the observational period, correlated significantly with change in cognition over 17 months (ß = -0.31, p = 0.02, ß = -0.34, p = 0.01, respectively).Discussion and Conclusion
In the present study using R2* relaxometry with a correction technique for intravoxel dephasing, we found higher R2* levels in the global basal ganglia and total neocortex in patients with AD as compared to age-matched community-dwelling individuals without overt cognitive impairment. The regional differences of iron load between AD and control groups were found in the occipital and temporal lobes and in the caudate nuclei. Our study extends previous investigations in sample size and by longitudinally exploring if effects of R2* are related to cognitive functioning. Our results demonstrate that an increase of iron in the temporal and occipital lobes correlated with decline in cognitive functions independently of longitudinal change in brain volume. We can only speculate on the cause of the association between R2* and cognition in these brain regions. Both the temporal and the occipital lobe are strongly affected by beta-amyloid deposition. Iron is particularly present in beta-amyloid plaques 4 and it might well be that interactive effects between beta-amyloid and iron in amyloid-rich brain areas such as the temporal and occipital lobe are responsible for our finding that already small increases of iron in these regions had substantial effects on the cognition. Given these evidences and the fact that iron is attached to beta-amyloid might explain the association between R2* and cognition, at least to a certain extent.Acknowledgements
This study was funded by the Austrian Science Fund (FWF grant numbers: KLI523, P30134 and I2889-B31) and the German Research Foundation (DFG DU1626/1-1).References
1. Zhu WZ, Zhong W De, Wang W, Zhan CJ, Wang CY, Qi JP, et al. Quantitative MR phase-corrected imaging to investigate increased brain iron deposition of patients with Alzheimer disease. Radiology 2009;253(2):497–504. doi: 10.1148/radiol.2532082324
2. Kim HG, Park S, Rhee HY, Lee KM, Ryu CW, Rhee SJ, et al. Quantitative susceptibility mapping to evaluate the early stage of Alzheimer’s disease. NeuroImage Clin 2017;16:429–38. doi: 10.1016/j.nicl.2017.08.019
3. Fernandez-Seara MA, Wehrli FW. Postprocessing technique to correct for background gradients in image-based R2* measurements. Magn Reson Med 2000;44(3):358–66. doi: 10.1002/1522-2594(200009)44:3
4. van Duijn S, Bulk M, van Duinen SG, Nabuurs RJA, van Buchem MA, van der Weerd L, Natté R. Cortical Iron Reflects Severity of Alzheimer's Disease. J Alzheimers Dis 2017;60(4):1533-1545. doi: 10.3233/JAD-161143
Figures
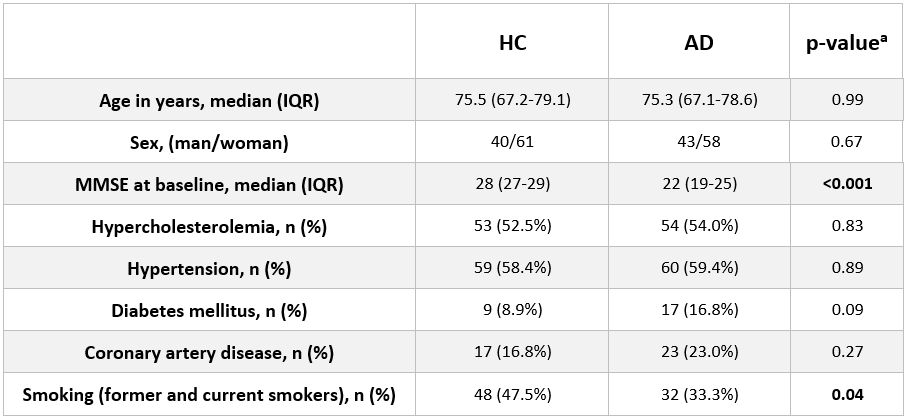
Table 1: Characteristics of study participants.
HC = healthy controls, AD = Alzheimer’s disease, IQR = interquartile range, MMSE = Mini-Mental State Examination. aMann-Whitney-U-test for continuous, Pearson χ2 for nominal variables were applied
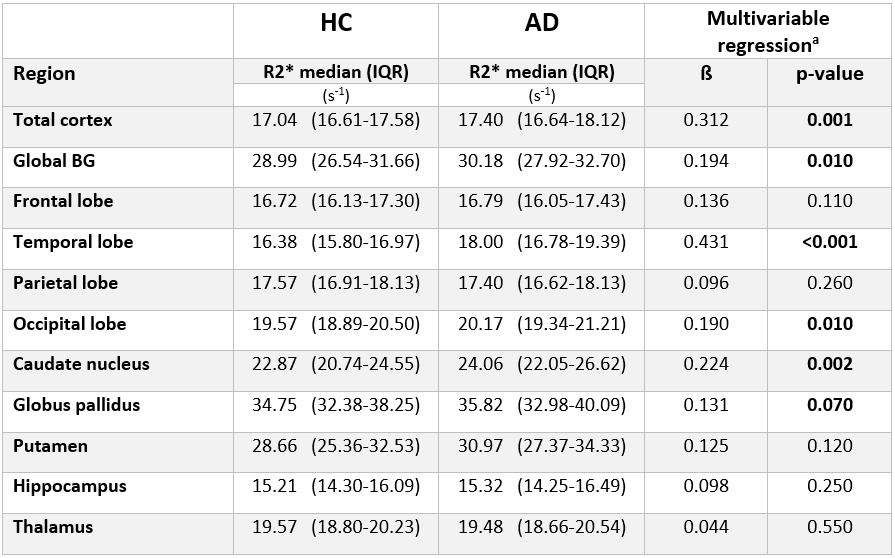
Table 2: R2* levels in patients with Alzheimer’s Disease and Healthy Controls in different brain regions.
(a corrected for smoking and regional volume)
HC = healthy controls, AD = Alzheimer’s disease, BG = Basal ganglia, IQR = interquartile range, ß = regression coefficient.
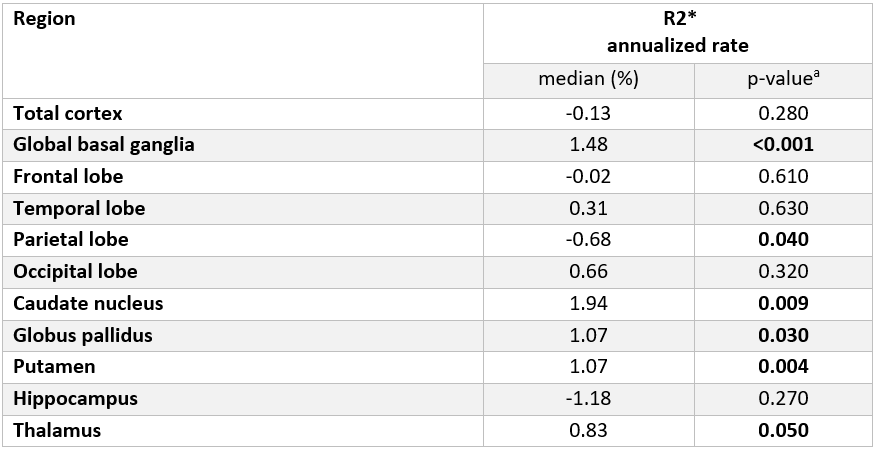
Table 3: Annualized percentage rates of R2* levels in patients with Alzheimer’s Disease after 17 months follow-up.
(a computed using Wilcoxon Signed Ranks Test)
The annualized R2* percentage rate was calculated as: (FU-BL)/BL*100/FU-time.
BL: R2* levels at baseline; FU: R2* levels at follow-up; FU-time: follow up time