1480
Multivariate Structural and Diffusion MRI Measures Correspond to Mild Cognitive Impairment in Parkinson’s disease1Cleveland Clinic Lou Ruvo Center for Brain Health, Las Vegas, NV, United States, 2University of Colorado, Boulder, Boulder, CO, United States, 3Department of Brain Health, University of Nevada, Las Vegas, Las Vegas, NV, United States, 4University of California, San Diego, San Diego, CA, United States
Synopsis
Mild Cognitive Impairment (MCI) affects approximately 30% of individuals with Parkinson’s disease (PD). However, no reliable imaging methodology currently exists to identify PD-MCI within PD. We hypothesized that multivariate analysis of sophisticated diffusion-MRI (dMRI) voxelwise measures, volumetric measures, and dMRI-derived graph-theoretical network measures will provide a set of imaging measures that are both sensitive and specific to PD-MCI. Our preliminary analysis with 22 PD-MCI and 15 PD-non-MCI participants suggest that beyond single tensor dMRI voxelwise measures, network measures, and structural MRI-derived measurements might provide both sensitive and specific measures for further multivariate analysis to identify imaging markers corresponding to PD-MCI.
Introduction
Mild Cognitive Impairment (MCI) affects approximately 30% of individuals with Parkinson’s disease1. However, no reliable imaging methodology currently exists to identify PD-MCI in PD. We hypothesized that multivariate analysis of sophisticated diffusion MRI (dMRI) voxelwise measures, conventional volumetric measures, and dMRI-derived graph-theoretical network measures will provide a set of imaging measures that are both sensitive and specific to PD-MCI.Methods
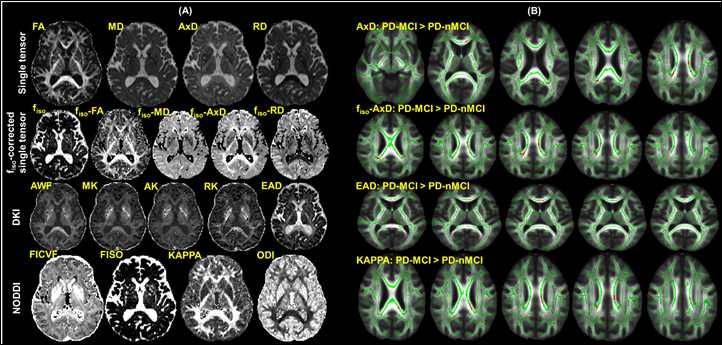
Participants: We recruited 37 PD participants and conducted a comprehensive neuropsychological evaluation1,2 to identify PD-MCI and PD-non-MCI (PD-nMCI) participants. For diagnostic accuracy, PD-MCI was classified after applying a threshold of 1.5 standard deviations1,2 below appropriate norms on at least two neuropsychological tests following Movement Disorders Society (MDS) criteria1. Based on clinical presentation and neuropsychological evaluations, a consensus diagnosis of PD-MCI was made by a practicing neurologist and a trained neuropsychologist. All participants were scanned with the following parameters on a 3T Siemens Skyra MRI scanner: 3D T1-weighted MRI acquisition: Isotropic spatial resolution=1mm3, inversion time (TI)=900ms, repetition time (TR)=2300ms, echo time (TE)=2.96ms. dMRI acquisition: Number of b-values=3, b-values=500s/mm2, 1000s/mm2, 2500s/mm2 (multi-shell dMRI data was acquired in the same run), number of diffusion-encoding directions at each shell=71, number of non-diffusion weighted images (b0)=25, isotropic spatial resolution=1.5mm3, TR=5218ms, TE=100ms, multiband factor(MB)=3, acceleration factor (GRAPPA)=2, phase encoding direction= P>>A. We also acquired a b0 image with the same parameters but with opposite phase encoding direction (A>>P) for eddy-current distortion correction3. Total acquisition time=28 minutes. Pre-processing: Eddy-current distortion correction was performed using eddy tool in FSL 6.0, and translational head motion during the scan was computed for each participant. Volumetric analysis: FreeSurfer 6.04 was utilized to generate cortical/subcortical volume, cortical thickness, and curvature measures for each participant. dMRI analysis: We computed single-tensor (ST) measures (fractional anisotropy (FA), radial diffusivity (RD), axial diffusivity (AxD), mean diffusivity (MD)), utilizing the lower shell dMRI data (b=500s/mm2, 1000s/mm2) using dtifit toolbox in FSL 6. Additionally, in-house estimation of whole-brain free-water fraction (fiso) was performed for each participant utilizing the lower shell dMRI data (b=500s/mm2, 1000s/mm2), and fiso-ST measures (fiso-FA, fiso-MD, fiso-AxD, fiso-RD) were estimated for all participants. Diffusion kurtosis imaging5 (DKI) measures (axonal kurtosis (AK), extra axonal diffusivity (EAD), radial kurtosis (RK), axonal water fraction (AWF), mean kurtosis (MK)), and neurite orientation dispersion and density imaging (NODDI)6 measures (KAPPA, orientation dispersion index (ODI), intracellular volume fraction (FICVF), isotropic volume fraction (FISO)) were also estimated for all participants using dMRI at all three-shells using appropriate toolboxes. All dMRI-derived measures for a representative participant are shown in Fig.2A. Network construction: AAL atlas7 was used to generate 90 nodes of the network in each subject’s native diffusion space after appropriate transformation8. Whole-brain tractography was performed using diffusion toolkit (http://www.trackvis.org/dtk/)9. Fibers smaller than 10mm10 or having FA<0.2 were removed from any further analysis. Each internode connection (edge) was weighted by the product of the number of fibres and average FA of the fibres connecting the two nodes. Graph-theoretical measures: Various global and local graph-theoretical measures were computed using GRETNA11 for each participant. Statistical analysis: Nonparametric comparisons between the means of each dMRI measure/volumetric measure/cortical thickness measure/graph-theoretical measure between groups, and also correlations of these measures with clinical measures were performed using permutation analysis of linear models (PALM)12 in FSL. In addition, network-based statistic (NBS)13 was used to statistically quantify differences in the weighted structural connectivity pattern between the groups. Significance was established at pcorr<0.05.Results
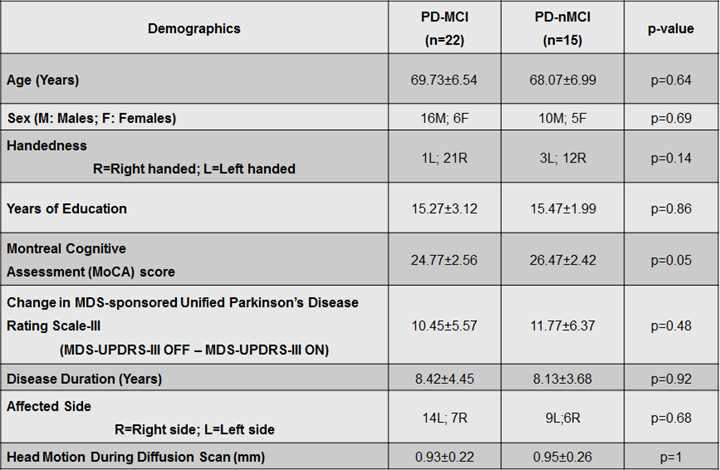
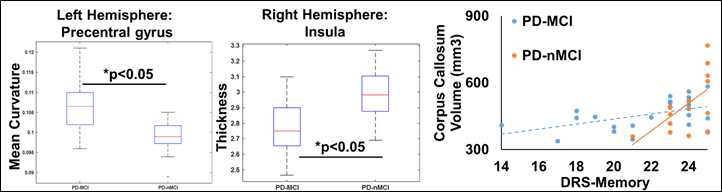
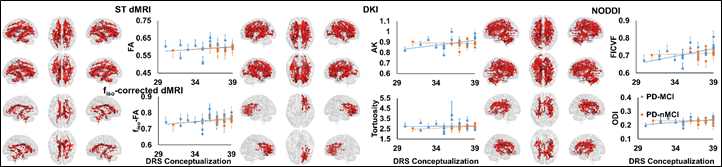
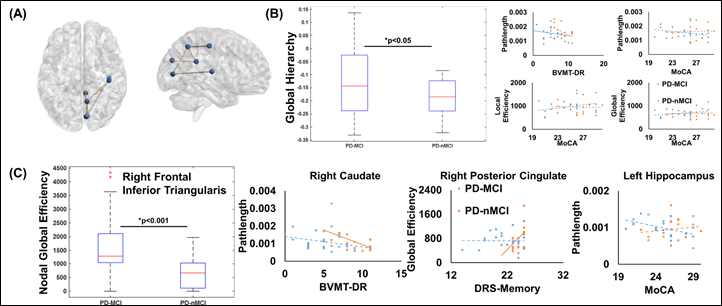
22 PD-MCI and 15 PD-nMCI participants were identified in this study with no difference in demographics, global cognition, and head motion during the scan (Table.1). Significantly higher curvature in left-hemispheric precentral gyrus and lower cortical thickness in right-hemispheric insula was observed in PD-MCI (Fig.1). Furthermore, corpus-callosum (CC) volume was significantly associated with the dementia rating scale (DRS)-Memory score in PD-nMCI (Fig.1). All dMRI models suggested WM disorganization in CC and cingulate fibers in PD-MCI (Fig.2B). Similarly, the correlation between DRS-Conceptualization and almost all dMRI-derived measures were observed in both groups (Fig.3). AK, FICVF, and ODI showed a significantly different correlation between groups with DRS-Conceptualization (Fig.3). NBS revealed lower structural connectivity in PD-MCI encompassing posterior cingulate, cuneus, and Heschl gyrus (Fig.4A). Global network measures showed a significantly lower global hierarchy in PD-MCI, and a distinct correlation of path length, local efficiency, and global efficiency in PD-MCI (Fig.4B). Significantly higher nodal efficiency in right frontal inferior triangularis was observed in PD-MCI (Fig.4C). Path length of right caudate and left hippocampus showed a differential correlation with Brief Visuospatial Memory Test-Delayed Recall (BVMT-DR) and Montreal Cognitive Assessment (MoCA) score, respectively (Fig.4C). Global efficiency of right posterior cingulate also showed a differential correlation with DRS-Memory between groups (Fig.4C).Discussion
Our preliminary analysis suggests that both dMRI-derived voxelwise measures and cortical volume/thickness of CC, insula, and limbic cortex are sensitive measure to identify PD-MCI and differentiate PD-MCI from cognitively normal PD. Furthermore, distinct topographical disorganization involving visual and parietal cortex was observed in PD-MCI.Conclusion
Beyond ST dMRI-derived voxelwise measures from NODDI or DKI, in addition to conventional network measures and structural MRI measurements might provide both sensitive and specific measures for further multivariate analysis to identify imaging markers corresponding to PD-MCI. Analysis with longitudinal data and multimodal analyses utilizing resting-state functional MRI are currently underway.Acknowledgements
This research project was supported by the NIH COBRE grant 5P20GM109025, Keep Memory Alive-Young Investigator Award, and philanthropic funds from Peter and Angela Dal Pezzo, Lynn and William Weidner, and Stacie and Chuck Matthewson.References
1. Litvan I, Goldman JG, Tröster AI, et al. Diagnostic criteria for mild cognitive impairment in Parkinson’s disease: Movement Disorder Society Task Force guidelines. Mov Disord. 2012/01/24. 2012;27:349–356.
2. Goldman JG, Holden S, Bernard B, Ouyang B, Goetz CG, Stebbins GT. Defining optimal cutoff scores for cognitive impairment using Movement Disorder Society Task Force criteria for mild cognitive impairment in Parkinson’s disease. Mov Disord. United States; 2013;28:1972–1979.
3. Andersson JLR, Sotiropoulos SN. An integrated approach to correction for off-resonance effects and subject movement in diffusion MR imaging. Neuroimage. United States; 2016;125:1063–1078.
4. Fischl B. FreeSurfer. Neuroimage. 2012;62:774–781.
5. Jensen JH, Helpern JA, Ramani A, Lu H, Kaczynski K. Diffusional kurtosis imaging: the quantification of non-gaussian water diffusion by means of magnetic resonance imaging. Magn Reson Med. United States; 2005;53:1432–1440.
6. Zhang H, Schneider T, Wheeler-Kingshott CA, Alexander DC. NODDI: practical in vivo neurite orientation dispersion and density imaging of the human brain. Neuroimage. United States; 2012;61:1000–1016.
7. Tzourio-Mazoyer N, Landeau B, Papathanassiou D, et al. Automated anatomical labeling of activations in SPM using a macroscopic anatomical parcellation of the MNI MRI single-subject brain. Neuroimage. United States; 2002;15:273–289.
8. Mishra VR, Sreenivasan KR, Zhuang X, et al. Unique White Matter Structural Connectivity in Early Stage, Drug Naive Parkinson’s Disease. Neurology. 2019;In-Press.
9. Wang R, Wedeen VJ. TrackVis.org. Proc Intl Soc Mag Reson Med. 2007. p. 3720.
10. Cheng H, Wang Y, Sheng J, et al. Optimization of seed density in DTI tractography for structural networks. J Neurosci Methods. 2011/09/29. 2012;203:264–272.
11. Wang J, Wang X, Xia M, Liao X, Evans A, He Y. GRETNA: a graph theoretical network analysis toolbox for imaging connectomics. Front Hum Neurosci. 2015;9:386.
12. Winkler AM, Ridgway GR, Webster MA, Smith SM, Nichols TE. Permutation inference for the general linear model. Neuroimage. United States; 2014;92:381–397.
13. Zalesky A, Fornito A, Bullmore ET. Network-based statistic: identifying differences in brain networks. Neuroimage. United States; 2010;53:1197–1207.
Figures