1479
CDR stage of MCI in Parkinson’s disease is associated with whiter matter hyperintensities characteristics: an initial comparison study1Center for Biomedical Imaging Research, Department of Biomedical Engineering, Tsinghua University, Beijing, China, 2Department of Neurosurgery, Tsinghua University Yuquan Hospital, Beijing, China, 3School of Computer Science and Technology, Beijing Institute of Technology, Beijing, China
Synopsis
The aim of this study was to investigate the white matter hyperintensities (WMH) on FLAIR MRI in patients of Parkinson’s disease (PD) with questionable mild cognitive impairment (PD-Q) and without MCI (PD-N). Automatic segmentation and artificial localization of WMH were done to accurately describe WMH characteristics. By the Clinical Dementia Rating (CDR) staging dementia in PD patients, the WMH showed more in the region of bilateral cornu occipital in PD-Q than PD-N. This finding may initially improve understanding about the association between WMH and PD cognitive dysfunction.
Introduction
Mild cognitive impairment affects approximately 20–50% of people with Parkinson's disease.1 White matter hyperintensities (WMH) on T2-FLAIR MRI was recognized as a surrogate imaging biomarker of cognitive dysfunction in the elder individuals2 and may be of potential benefit for the PD mild cognitive impairment (PD-MCI) patients. Some of the recent literature claimed that WMH volume or distribution contributed to cognition decline3, 4 while the others, however, reported no significant associations.5, 6 The varied standards for PD-MCI and the lack of quantitative WMH analysis may be to blame for the controversy. The Clinical Dementia Rating (CDR) scale was gradually accepted as a useful tool in staging PD-MCI.7 To date, there was seldom research focus on WMH analysis based on CDR-staged PD-MCI. In this study, we aim to investigate the association between the CDR stages of PD-MCI and localized WMH burden. Additionally, this study will provide more evidence of the relationship between PD with cognitive dysfunction and WMH distribution.Methods
Study population: 28 PD patients were recruited in this study after informed consent. The PD-MCI status was staged by CDR global score and the motor ability was assessed by Instrumental Activities of Daily Living (IADLs). 14 of the total 28 PD patients ranked 0.5 in CDR-global score which indicated a questionable MCI stage (Group PD-Q, PD with Questionable MCI), while the remaining 14 PD patients were absent from MCI by CDR=0 (Group PD-N, PD with None MCI).MRI Protocol: All scans were obtained on a 3T MR scanner (Philips Achieva TX, Best, Netherland) with a 32-channel head coil. 3D T1w and 3D FLAIR scans were examined successively with our routine parameters (3D T1w: sagittal acquisition with 256(FH)×256(AP)×160(RL) mm3 FOV; 1×1×2 mm3 voxels; TE/TR/Flip angle=3.6 ms/7.8 ms/8°. 3D FLAIR: sagittal acquisition with 200(FH)×231(AP)×180(RL) mm3 FOV; 0.8×0.8×1.5 mm3 voxels; IR/TE/TR/Flip angle=1650ms/386 ms/5000 ms/40°). 3D FLAIR data were used to delineate WMH masks slice by slice.
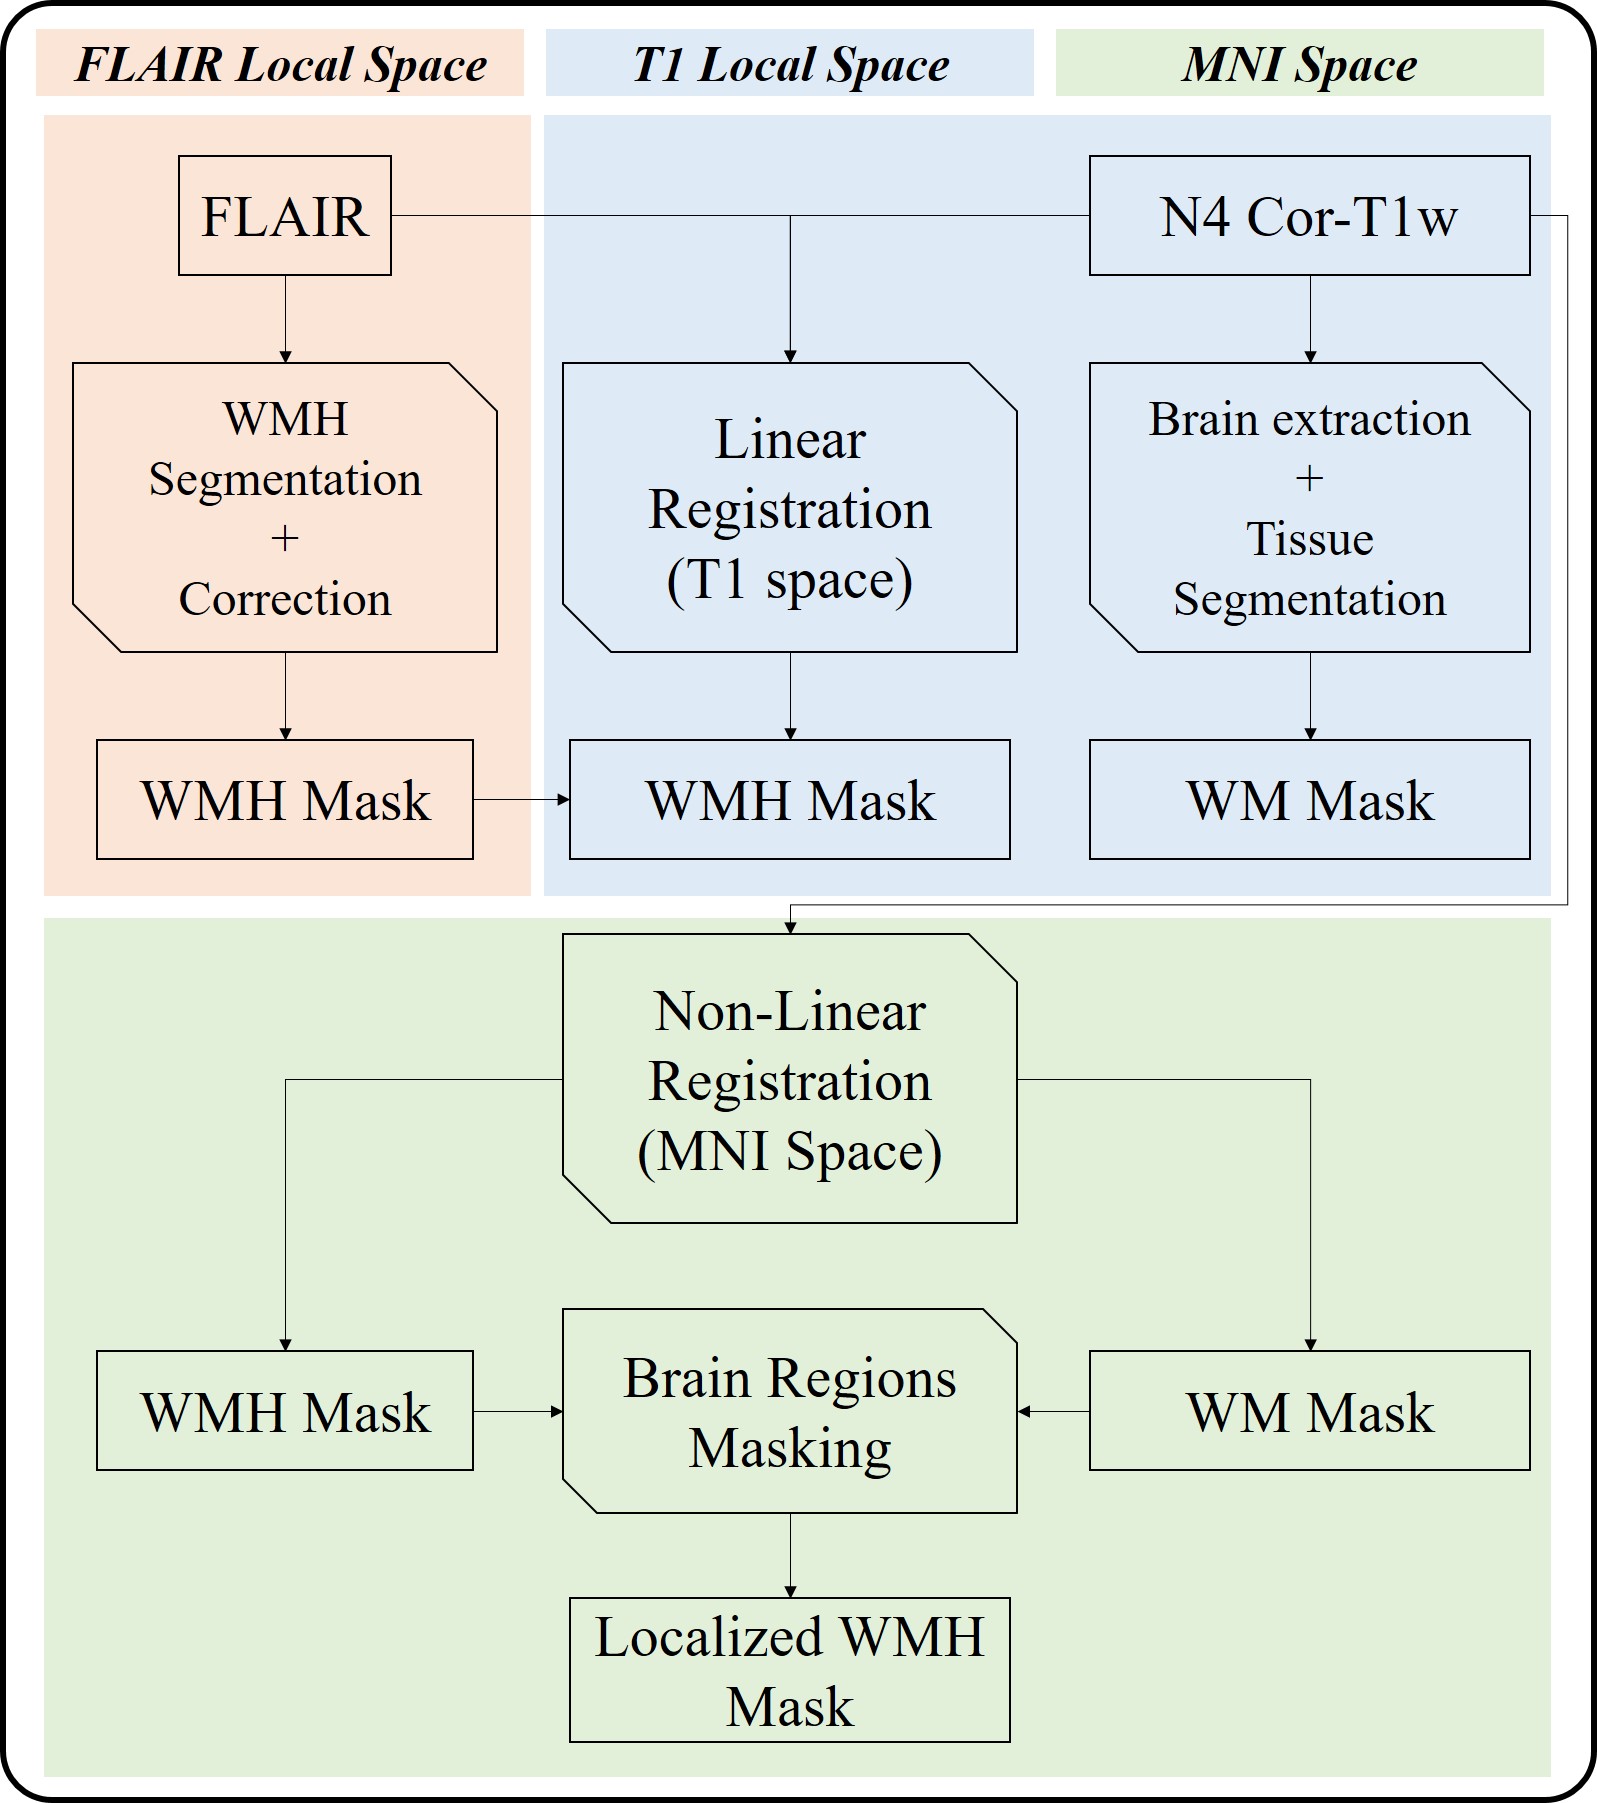
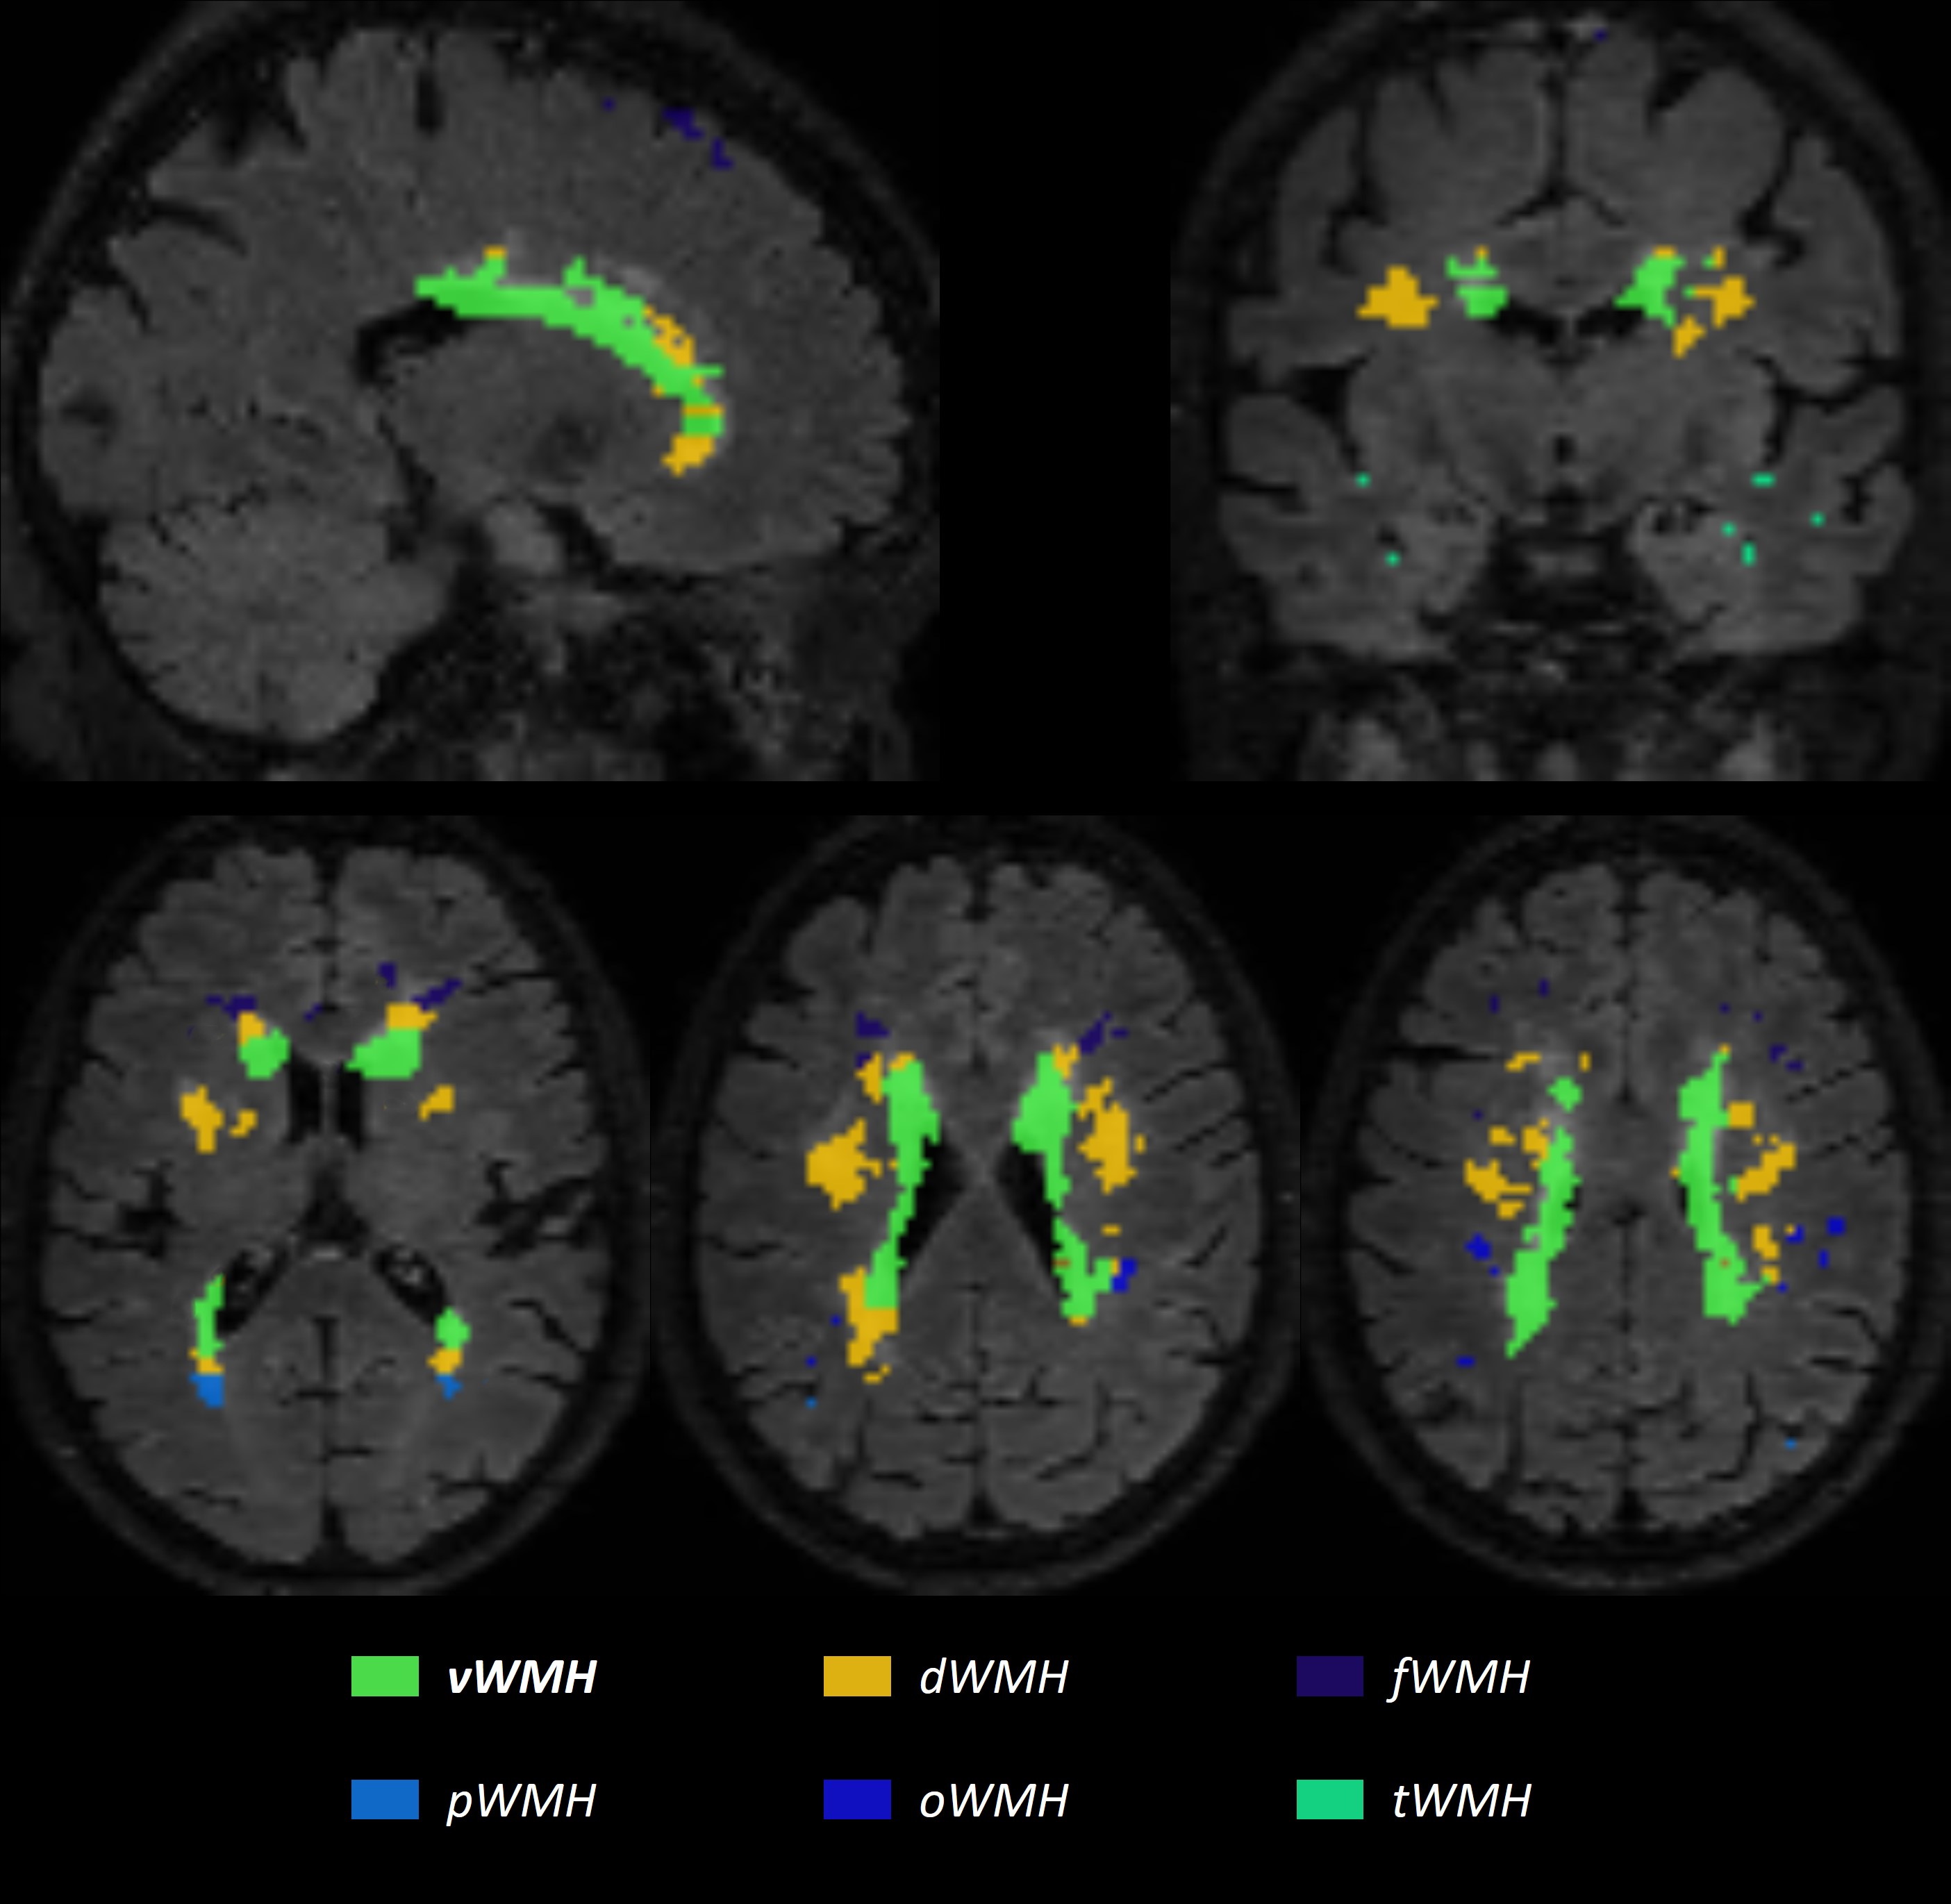
Image analysis (Fig. 1): A MICCIA 2017 outstanding deep learning WMH segmentation network,8 which was pre-trained by FLAIR data from MICCIA 2017 WMH Segmentation Challenge and fine-tuned on data from our scanner, was utilized to delineate WMH. An experienced radiologist would then do hand-correction to guarantee the segmentation quality. FLAIR with corresponded WMH masks and the skull striped N4 corrected T1w images were linearly co-registered and then nonlinearly registered to MNI space for subsequent analysis via FSL.9 After registration, WMH frequency maps were calculated to directly reflect the global WMH distribution, overlaying with the MNI-152 1mm T1 template as an anatomical reference. WMH masks were empirically divided into 5 zones by experienced radiologists: periventricular WMH (vWMH), together with WMH closed to frontal lobe subcortical region (fWMH), occipital lobe subcortical region (oWMH), parietal lobe subcortical region (pWMH) , temporal lobe subcortical region (tWMH), and the residues are deep WMH (dWMH), as shown in Fig. 2. Localized WMH burden was the regional volume of WMH.
Statistical analysis: For WMH distribution, Fisher’s exact test was conducted voxel-by-voxel to reflect the significant different WMH voxels between PD-N and PD-Q. For localized WMH and total WMH burden, Mann-Whitney tests were conducted to determine the volumetric difference between PD-Q and PD-N. All significant level was 0.05 and not corrected.
Results
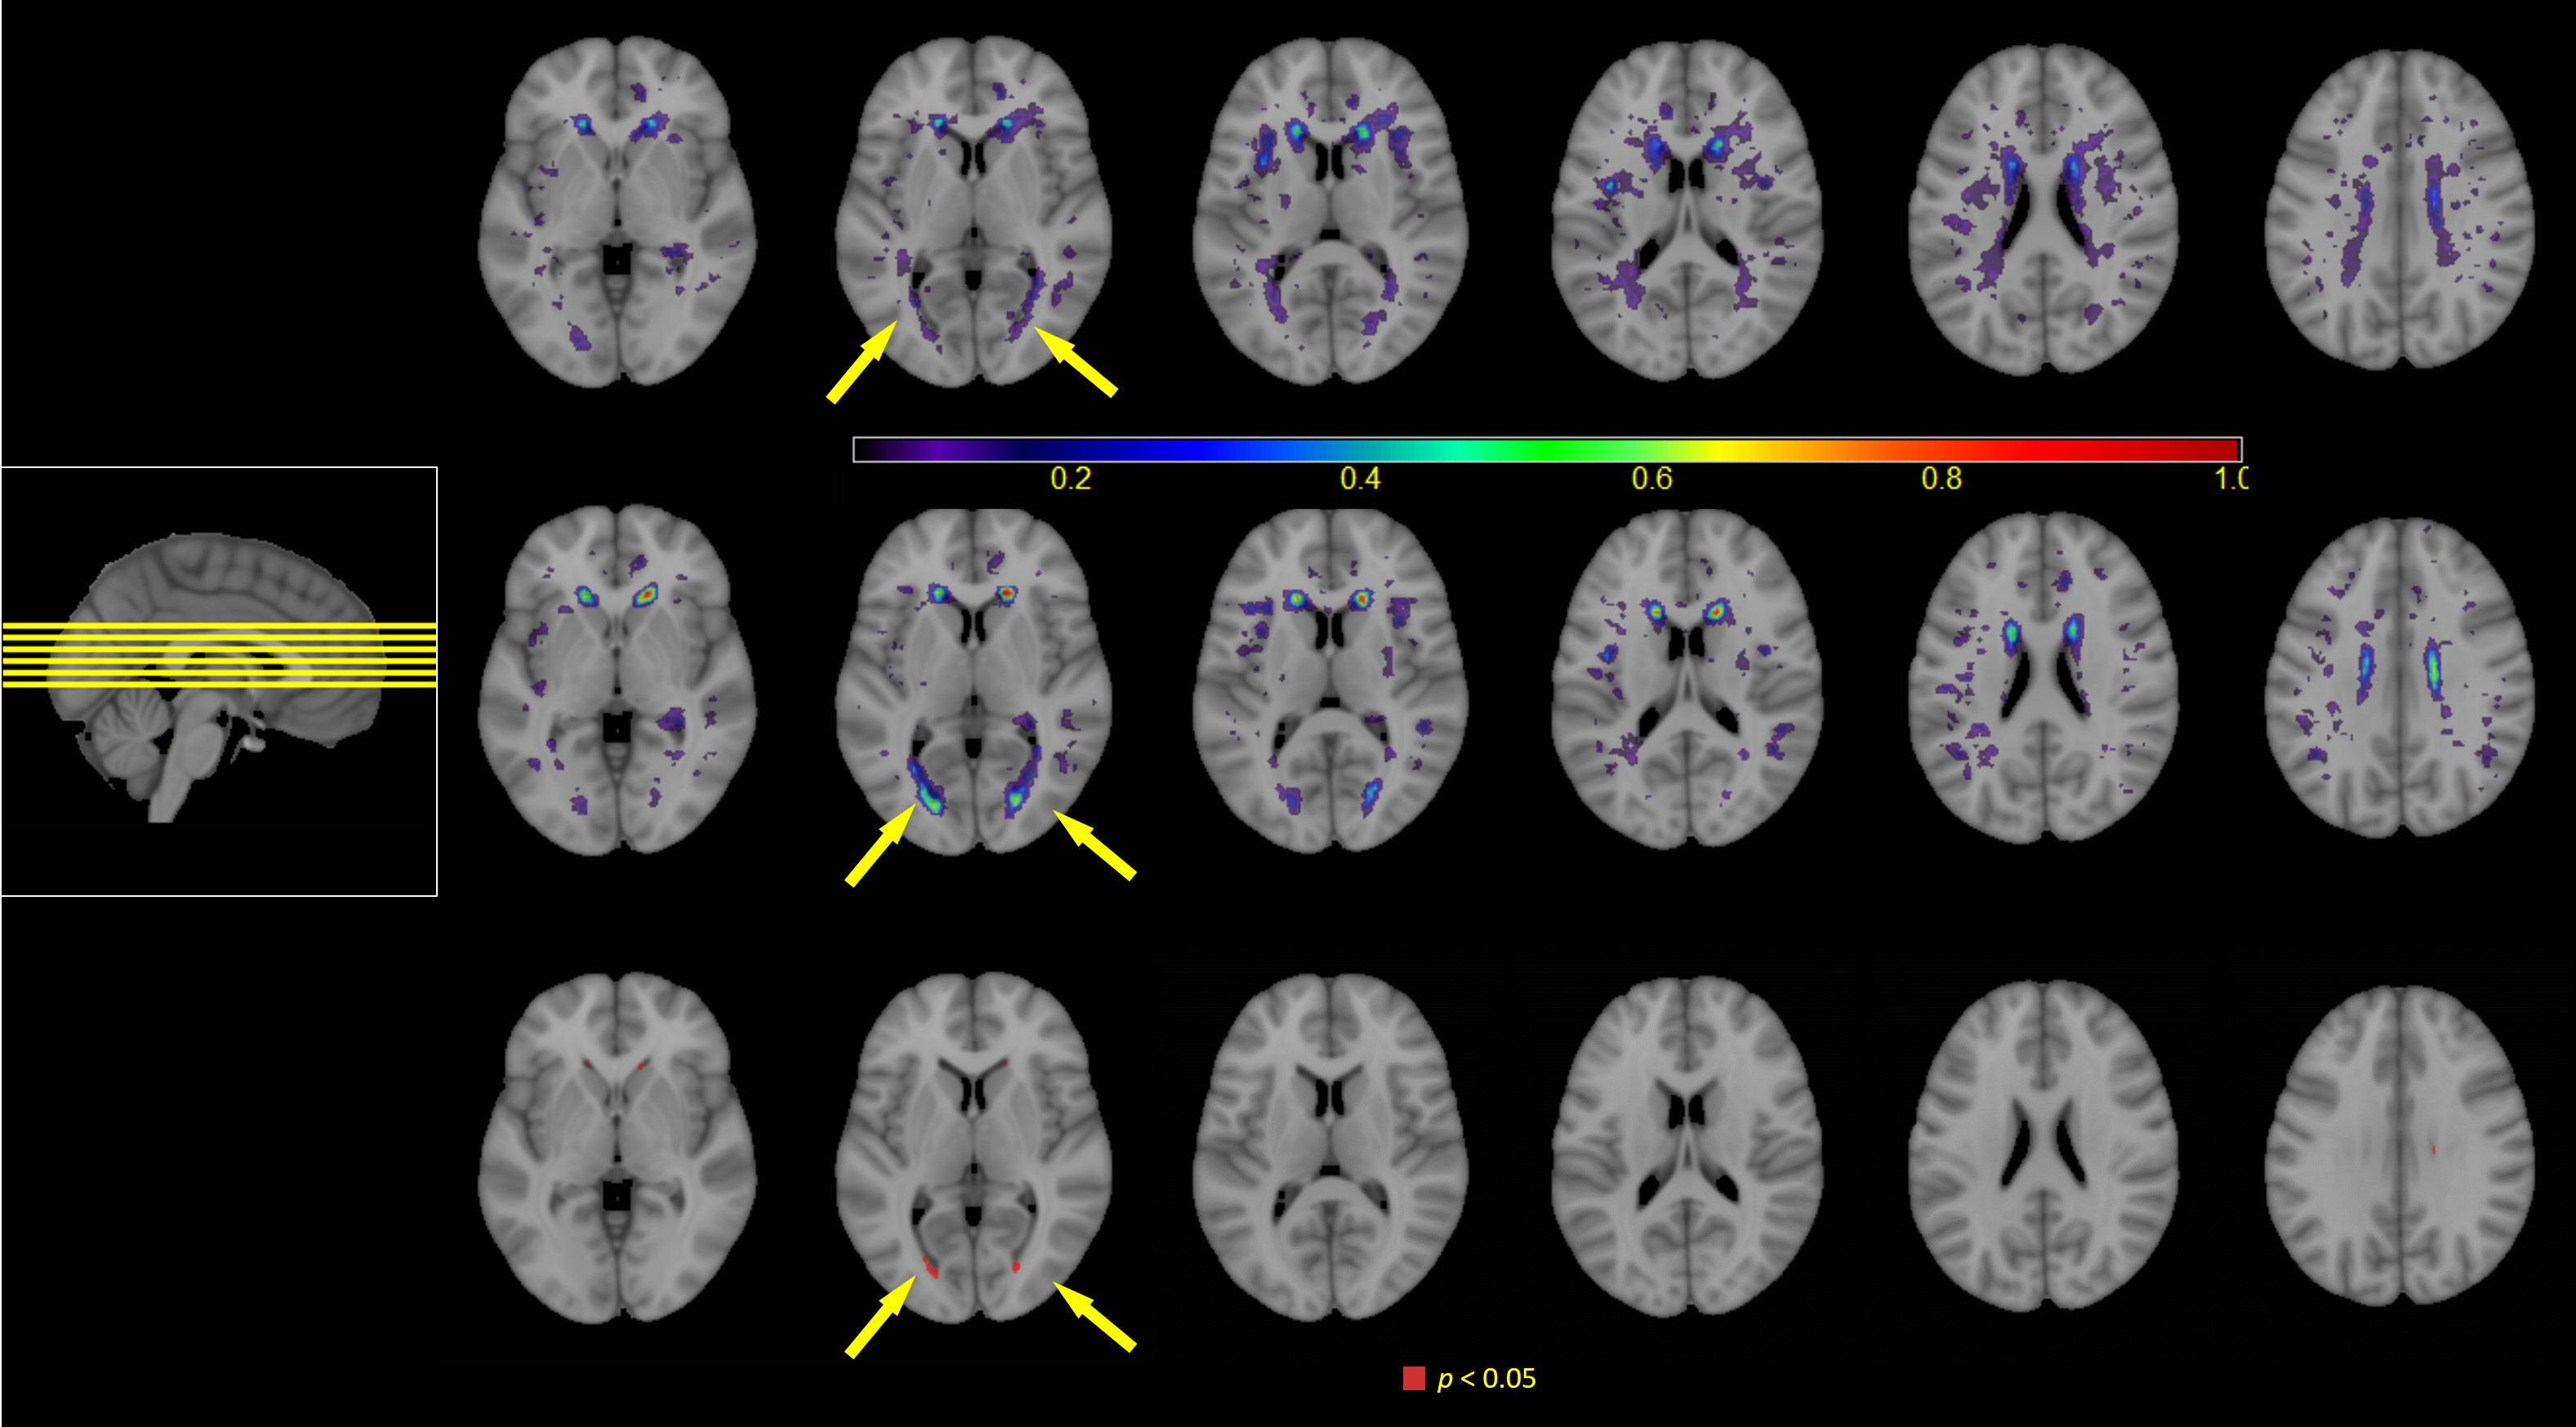
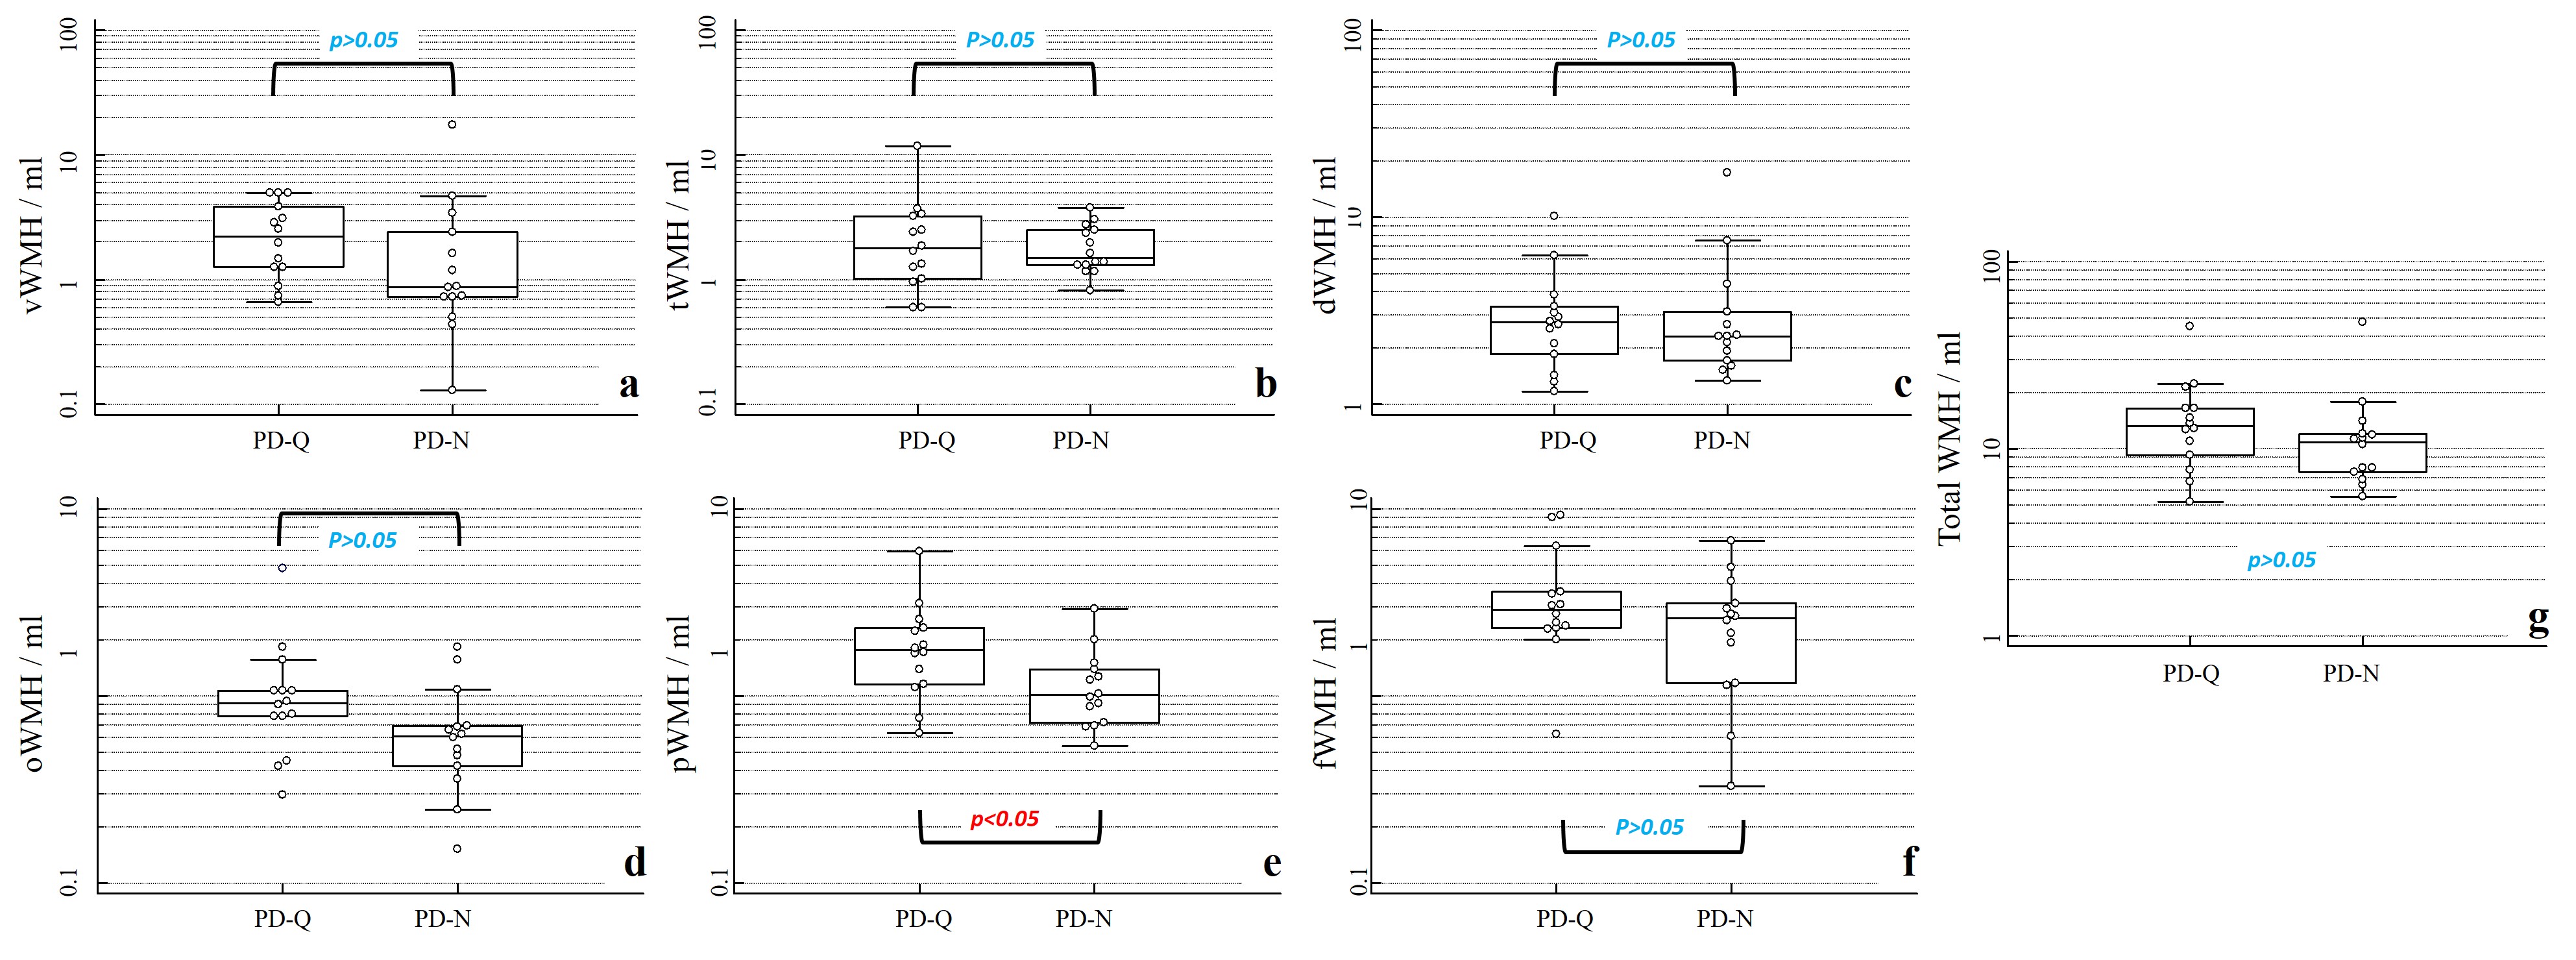
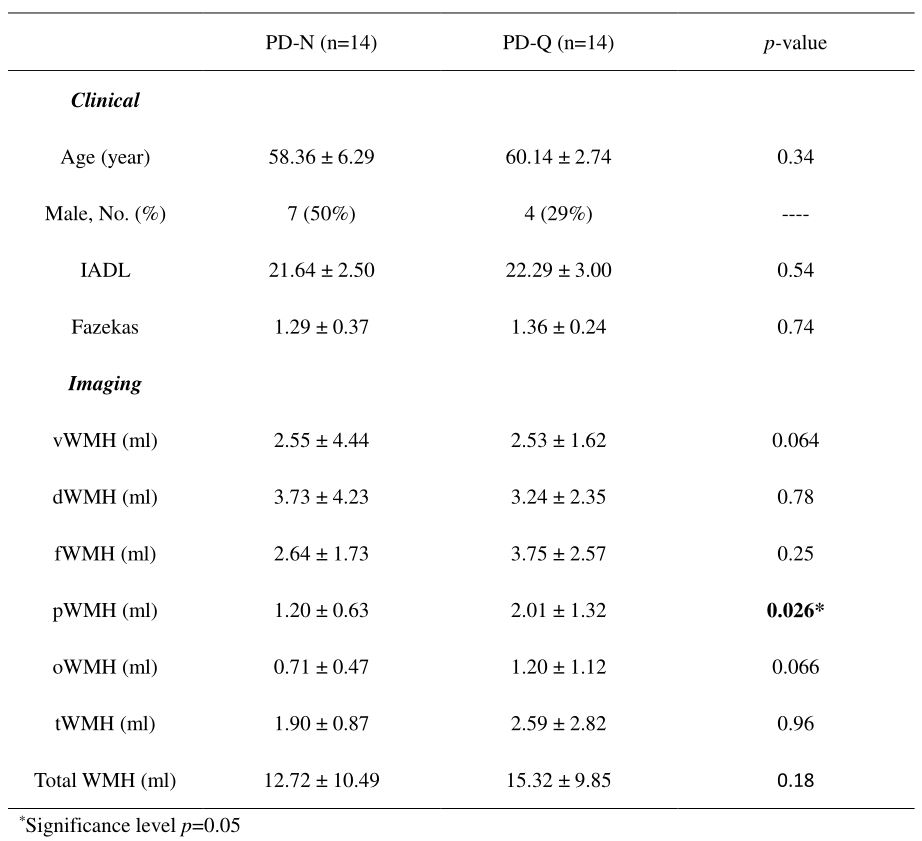
The global WMH distribution frequency map of PD-N and PD-Q were shown in Fig. 3. Majority of WMH were pWMH and dWMH in PD-Q and PD-N. Both PD-Q and PD-N patients had WMH on the cornu frontale bilaterally. However, the PD-Q had more centralized WMH distribution while PD-N had dispersed WMH distribution. PD-Q had significant more WMH on bilateral cornu occipital. For localized WMH burden, vWMH (p=0.064, Fig. 4a), tWMH (p=0.96, Fig. 4b), dWMH (p=0.78, Fig. 4c), oWMH (p=0.066, Fig. 4d), fWMH (p=25, Fig. 4f) showed no significant difference. Only pWMH (p=0.026, Fig. 4e) showed a significant difference. The total WMH burden showed no significant difference (p=0.18, Fig. 4g) from the Mann-Whitney test. All clinical and imaging characteristics can be found in Table. 1.Discussion
In this study, we compared the localized WMH burdens of PD-Q and PD-N patients. To compare the distribution of WMH, the difference between WMH in PD-Q and PD-N was most likely in the region of bilateral cornu occipitals. The voxel-wise Fisher’s exact tests initially supported this observation. Additionally, the localized pWMH burden was significantly different between PD-Q and PD-N. Noting that in PD-Q both the occipital lobe (p=0.066) and parietal lobe (p=0.026) had an increase in localized WMH burden comparing to PD-N, further indicating that WMH pattern was different between different CDR stages of PD-MCI. The CDR stage of questionable PD-MCI was initially proved to be associated with WMH characteristics. Nevertheless, this finding needs further validation with more samples, more accurate and robust automatic segmentation techniques.Conclusion
In conclusion, different CDR stage of questionable PD-MCI differentiates in WMH patterns, increasing WMH in the region of bilateral cornu occipital is associated with the increase of CDR global scores in none-to-questionable PD-MCI patients.Acknowledgements
The authors thank Dr. Zechen Zhou, Dr. Aiqi Sun, Dr. Yunduo Li, Jifan Li, Yichen Zheng, Ziling Jiao, Wenwen Chen, Mingzhu Fu, JInyu Li, Wei Qiu, Jiachen Ji and Haining Wei for their helpful support and suggestions in this work.References
1. Goldman JG, Vernaleo BA, Camicioli R, et al. Cognitive impairment in Parkinson’s disease: a report from a multidisciplinary symposium on unmet needs and future directions to maintain cognitive health. npj Parkinson's Disease 2018;4.
2. Prins ND, Scheltens P. White matter hyperintensities, cognitive impairment and dementia: an update. Nature Reviews Neurology 2015;11:157-165.
3. Park YW, Shin NY, Chung SJ, et al. Magnetic Resonance Imaging–Visible Perivascular Spaces in Basal Ganglia Predict Cognitive Decline in Parkinson's Disease. Movement Disorders 2019.
4. Mak E, Dwyer MG, Ramasamy DP, et al. White Matter Hyperintensities and Mild Cognitive Impairment in Parkinson's Disease. Journal of Neuroimaging 2015;25:754-760.
5. Dalaker TO, Larsen JP, Dwyer MG, et al. White matter hyperintensities do not impact cognitive function in patients with newly diagnosed Parkinson's disease. NeuroImage 2009;47:2083-2089.
6. Hanning U, Teuber A, Lang E, Trenkwalder C, Mollenhauer B, Minnerup H. White matter hyperintensities are not associated with cognitive decline in early Parkinson's disease – The DeNoPa cohort. Parkinsonism & Related Disorders 2019;69:61-67.
7. Wyman-Chick KA, Scott BJ. Development of Clinical Dementia Rating Scale Cut-off Scores for Patients With Parkinson's Disease. Movement Disorders Clinical Practice 2015;2:243-248.
8. Li H, Jiang G, Zhang J, et al. Fully convolutional network ensembles for white matter hyperintensities segmentation in MR images. NeuroImage 2018;183:650-665.
9. Smith SM, Jenkinson M, Woolrich MW, et al. Advances in functional and structural MR image analysis and implementation as FSL. NeuroImage 2004;23:S208-S219.
Figures