1474
A novel MRI biomarker for the characterization of early and later forms of Alzheimer’s disease
Marianna Inglese1, Haonan Lu2,3, Matthew Grech-Sollars1,4, and Eric O Aboagye1
1Surgery and Cancer, Imperial College, London, United Kingdom, 2Cancer Imaging Centre, Imperial College, London, United Kingdom, 3Ovarian Cancer Action Research Centre, Imperial College, London, United Kingdom, 4Department of Imaging, Imperial College Healthcare NHS Trust, London, United Kingdom
1Surgery and Cancer, Imperial College, London, United Kingdom, 2Cancer Imaging Centre, Imperial College, London, United Kingdom, 3Ovarian Cancer Action Research Centre, Imperial College, London, United Kingdom, 4Department of Imaging, Imperial College Healthcare NHS Trust, London, United Kingdom
Synopsis
Alzheimer’s disease(AD) is the most common form of dementia. In the past few decades, great advances have been made in the understanding of its pathophysiology due to the use of biomarkers. Imaging biomarkers, either based on structural brain changes and metabolic alterations alone, or in conjunction with cerebrospinal fluid(CSF) biomarkers, can be informative of the ongoing pathological processes occurring in a patient with AD. In our method, we propose a novel MRI biomarker that is based on the extraction of structural features from a T1-w MRI scan, and it provides biological characterization of early and later forms of AD.
Abstract
IntroductionAD is the most common cause of dementia and is a significant burden for affected patients, carers, and health systems [1]. Currently, the formation of amyloid plaques, neurofibrillary tangles, and the consequent atrophy of grey matter are the three main events extensively used for characterising the disease. These events can be present in the brain many years before the clinical manifestation of AD, and, for this reason, an early detection of any changes in the brain is crucial for preventing the progression of the disease. Numerous advances have been made in developing biomarkers for AD using neuroimaging approaches, in particular structural MRI [2]. The most consistent structural finding in AD is the reduced volume of hippocampus [3], but it is arguably not the most specific biomarker as reduced hippocampal volume has been found in many other neuropsychiatric conditions including schizophrenia [4] and depression [5]. In this study, we propose a simple method able to characterize early and later forms of AD based on the extraction and selection of structural features from a T1 MRI sequence.
Methods
Data used in this work was obtained from the Alzheimer’s Disease Neuroimaging Initiative (ADNI) database (www.loni.ucla.edu/ADNI). We included all subjects for whom baseline MRI data (T1-weighted MP-RAGE sequence at 1.5 and 3T), age, and cognitive scores (Mini-Mental stage examination (MMSE), Clinical Dementia Rating ‘sum-of-boxes’ (CDRSB), Delayed Recall Total (LDELTOT)), and CSF based biomarkers (Abeta, Tau and pTAU) were available. For the diagnostic classification at baseline (t0), 1570 subjects were available of which 924 were scanned on a 1.5T MRI scanner and 646 on a 3T scanner. In the former, the subjects were grouped as 216 healthy controls (CN), 217 Mild Cognitive Impairment (MCI), 191 AD, 140 patients with Frontotemporal disease (FTD), and 160 with Parkinson’s disease (PD); and in the latter, they were grouped as 296 CN, 151 MCI, 88 AD and 111 SCD. As pre-processing steps, all T1 images were (1) segmented to brain masks of 45 sub-regions (FreeSurfer’s recon-all), (2) registered to MNI space (FSL), and (3) age corrected [6]. In method 1, the multi-regional brain masks were post-processed for the extraction of 656 features for each region using an in-house written software (TexLAB2.0), which runs on Matlab. Feature selection was done using data from CN and AD with the grouped least absolute shrinkage and selection operator (LASSO). The weighted sum of the selected features gave the Alzheimer predictive Vector (ApV1). In method 2, we included 3 cognitive measurements (MMSE, CDRSB and LDELTOTAL) and 3 CSF based biomarkers (Abeta, Tau and pTAU) to assess whether the characterization of the diseases cold be improved; we obtained a second vector ApV2. For CN, MCI and AD, features were extracted also on a second scan (acquired at t1 (6/8 months after t0)) in order to run a test-retest analysis.
Results
Method 1 resulted with the selection of 10 features in 5 regions. ApV1’s reproducibility test resulted in an interclass coefficient (ICC) of 0.88. ROC analysis showed an AUCCN_AD=0.97 and an AUCCN_MCI=0.85(Fig.1). Method 2 resulted with the selection of 17 features (including cognitive scores) in 12 regions. ApV2’s ICC was 0.76. ROC analysis resulted in AUCCN_AD=0.99 and AUCCN_MCI=0.98 (Fig. 2). The two vectors were compared to the volume of the hippocampus, which showed an ICC of 0.96, an AUCCN_AD=0.86 and an AUCCN_MCI=0.71(Fig.1 and 2). Both methods were tested on 1.5T T1 images and validated on 3T showing no significant differences. ApV1 of FTD, PD and SCD patients resulted to be in a different range of AD (Fig. 3). In particular, the earliest form of the disease (SCD) is distinguishable from the CN with an accuracy of 97% (Fig. 3).
Discussion
Structural MRI measures of the hippocampus and medial temporal lobe are the most clinically validated biomarkers of AD, but remain typically qualitative[3]. For this reason, many algorithms have been developed in an attempt to classify and discriminate diagnostic groups based on these measurements [7]. Many authors focused on the discrimination between CN and AD and reached accuracies in the range of 83-88% (higher with the integration of cognitive scores) [8-12]. Our method shows an accuracy of 91% (99% with scores) in the discrimination between CN and AD and allows the detection of the earliest form of the disease (SCD) with an accuracy of 97%. The technique is stable and robust and sensitive to disease progression as shown in the longitudinal analysis. The two main critical aspects of the study are related to 1) age correction, which introduces distortion on the original T1 and 2) the integration of cognitive scores, which, alone, show good discriminating accuracies and can bias the final result.
Conclusion
AD is an irreversible condition and early biomarkers can help treatment to prevent or delay it. We discovered a novel MRI biomarker (ApV) for the biological characterization of AD. We extracted features on segmented and age corrected T1w MRI scans and provided a discriminating accuracy of 91%. We included patients at the earliest stage of the disease, and we were able to characterize them with a 97% accuracy.
Acknowledgements
This study has been funded by the Imperial Biomedical Research Centre (BRC).References
1. Hebert LE, Weuve J, Scherr PA, Evans DA (2013) Alzheimer disease in the United States (2010-2050) estimated using the 2010 census. Neurology 80 (19):1778-1783. doi:10.1212/WNL.0b013e31828726f5 2. Hua X, Lee S, Hibar DP, Yanovsky I, Leow AD, Toga AW, Jack CR, Bernstein MA, Reiman EM, Harvey DJ, Kornak J, Schuff N, Alexander GE, Weiner MW, Thompson PM (2010) Mapping Alzheimer's disease progression in 1309 MRI scans: Power estimates for different inter-scan intervals. NeuroImage 51 (1):63-75. doi:https://doi.org/10.1016/j.neuroimage.2010.01.104 3. Kehoe EG, McNulty JP, Mullins PG, Bokde ALW (2014) Advances in MRI biomarkers for the diagnosis of Alzheimer's disease. Biomarkers in Medicine 8 (9):1151-1169. doi:10.2217/bmm.14.42 4. Steen RG, Mull C, McClure R, Hamer RM, Lieberman JA (2018) Brain volume in first-episode schizophrenia: Systematic review and meta-analysis of magnetic resonance imaging studies. British Journal of Psychiatry 188 (6):510-518. doi:10.1192/bjp.188.6.510 5. Arnone D, McIntosh AM, Ebmeier KP, Munafò MR, Anderson IM (2012) Magnetic resonance imaging studies in unipolar depression: Systematic review and meta-regression analyses. European Neuropsychopharmacology 22 (1):1-16. doi:https://doi.org/10.1016/j.euroneuro.2011.05.003 6. Moradi E, Pepe A, Gaser C, Huttunen H, Tohka J (2015) Machine learning framework for early MRI-based Alzheimer's conversion prediction in MCI subjects. Neuroimage 104:398-412. doi:10.1016/j.neuroimage.2014.10.002 7. Long X, Chen L, Jiang C, Zhang L (2017) Prediction and classification of Alzheimer disease based on quantification of MRI deformation. PloS one 12 (3):e0173372. doi:10.1371/journal.pone.0173372 8. Plant C, Teipel SJ, Oswald A, Böhm C, Meindl T, Mourao-Miranda J, Bokde AW, Hampel H, Ewers M (2010) Automated detection of brain atrophy patterns based on MRI for the prediction of Alzheimer's disease. NeuroImage 50 (1):162-174. doi:https://doi.org/10.1016/j.neuroimage.2009.11.046 9. Teipel SJ, Born C, Ewers M, Bokde ALW, Reiser MF, Möller H-J, Hampel H (2007) Multivariate deformation-based analysis of brain atrophy to predict Alzheimer's disease in mild cognitive impairment. NeuroImage 38 (1):13-24. doi:https://doi.org/10.1016/j.neuroimage.2007.07.008 10. DeCarli C, Murphy DGM, McIntosh AR, Teichberg D, Schapiro MB, Horwitz B (1995) Discriminant analysis of MRI measures as a method to determine the presence of dementia of the Alzheimer type. Psychiatry Research 57 (2):119-130. doi:https://doi.org/10.1016/0165-1781(95)02651-C 11. Fan Y, Batmanghelich N, Clark CM, Davatzikos C (2008) Spatial patterns of brain atrophy in MCI patients, identified via high-dimensional pattern classification, predict subsequent cognitive decline. NeuroImage 39 (4):1731-1743. doi:https://doi.org/10.1016/j.neuroimage.2007.10.031 12. Zhang D, Wang Y, Zhou L, Yuan H, Shen D (2011) Multimodal classification of Alzheimer's disease and mild cognitive impairment. NeuroImage 55 (3):856-867. doi:https://doi.org/10.1016/j.neuroimage.2011.01.008Figures
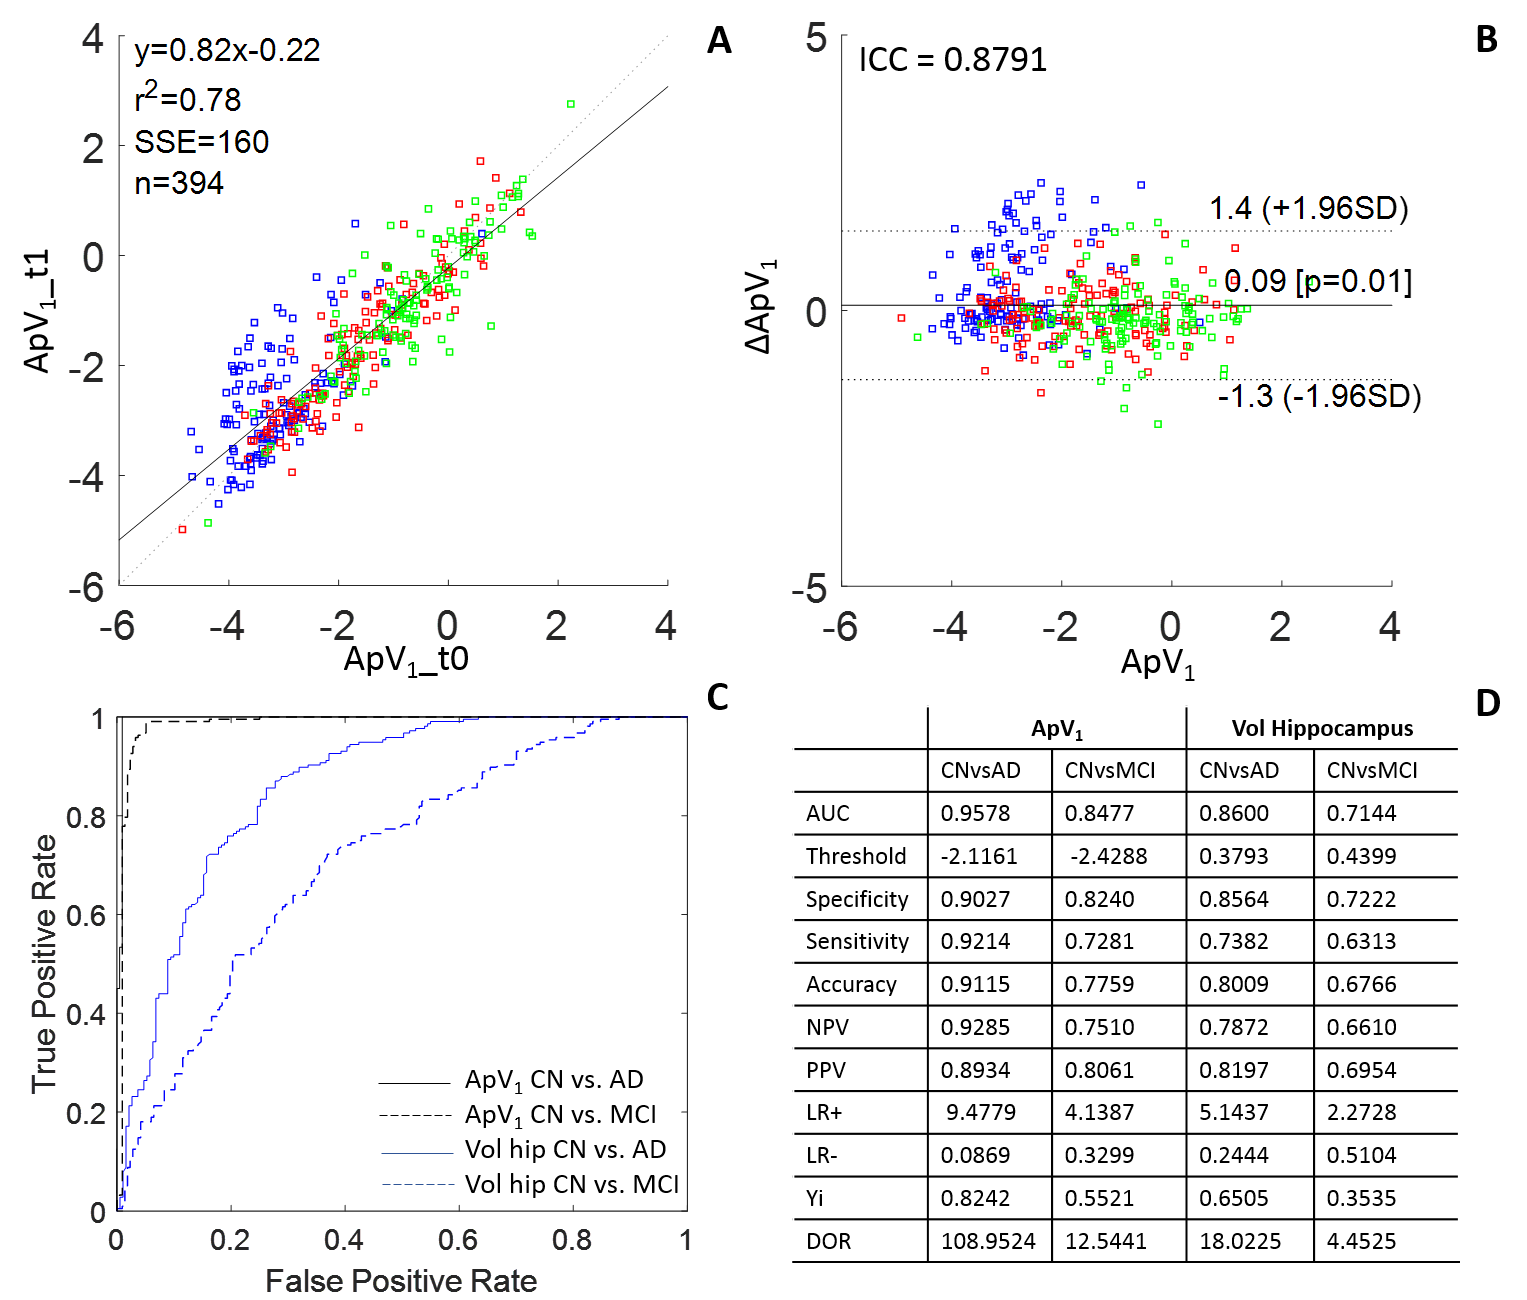
Method 1. Feature
extraction and selection resulted with the Alzheimer’s predictive vector ApV1.
A and B show the results of the test-retest analysis between ApV1 at
baseline (t0) and t1: in A we see a correlation between the two vectors, in B
an ICC of 0.88. ROC analysis shows the comparison with the gold standard MRI
biomarker: the hippocampal volume (C). The analysis resulted with an accuracy
of 91% in distinguishing between healthy controls and AD patients (D).
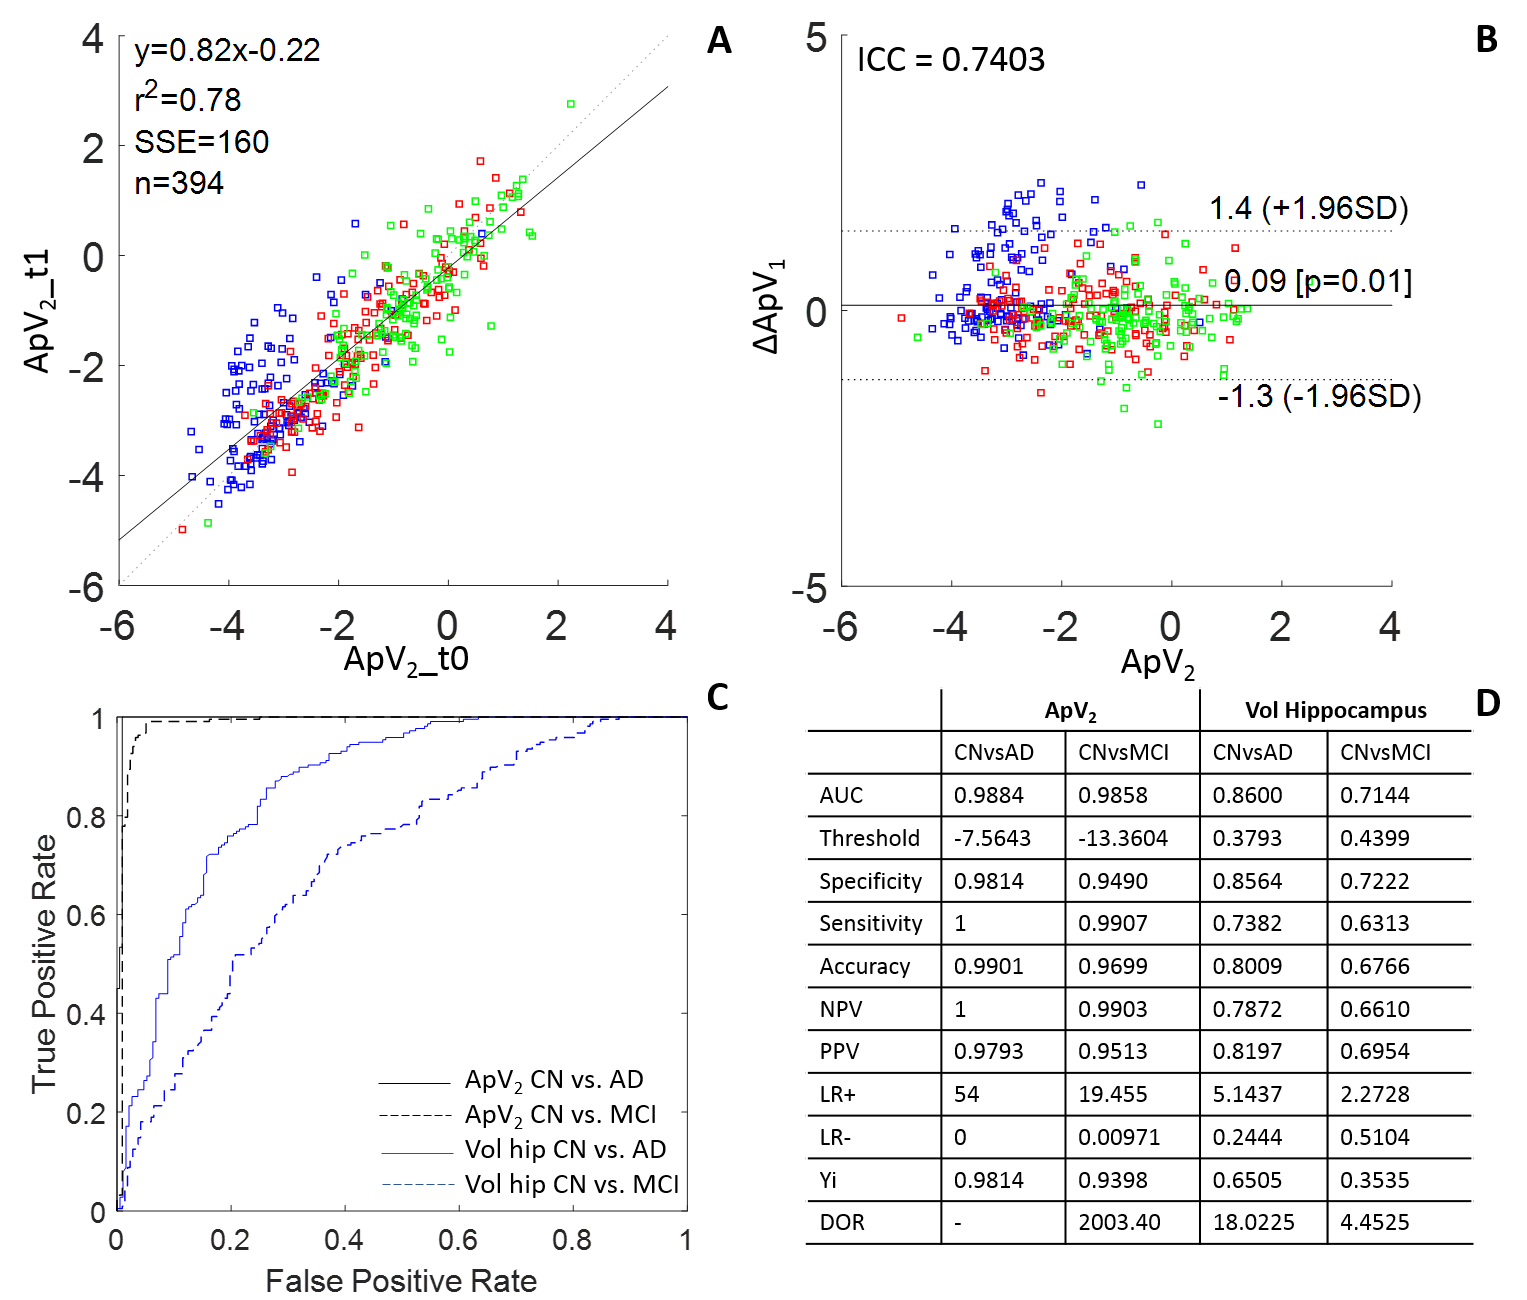
Method
2. Feature extraction and selection resulted with the Alzheimer’s predictive
vector ApV2, a combination of structural features and cognitive
parameters. A and B show the
results of the test-retest analysis between ApV2 at baseline (t0)
and t1: in A we see a correlation between the two vectors, in B an ICC of 0.74.
ROC analysis shows the comparison with the gold standard MRI biomarker: the
hippocampal volume (C). The analysis resulted with an accuracy of 99% in
distinguishing between healthy controls and AD patients (D).
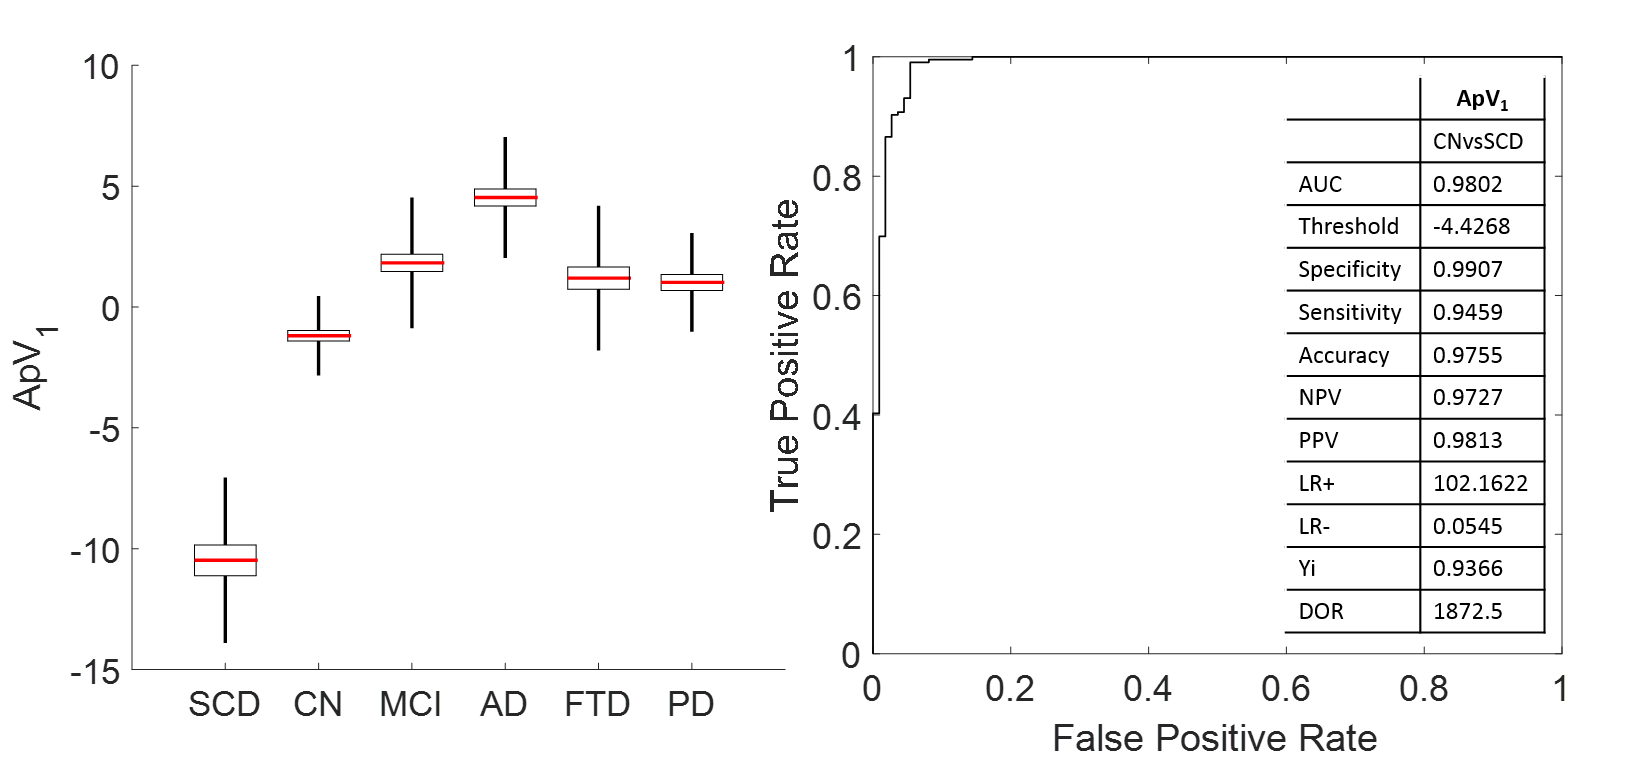
Method
1. The method was also applied to different form of dementia (frontotemporal
dementia and Parkinson’s disease) and to the earliest form of AD (SCD). Both
FTD and PD are not in the range of AD. In particular, patients with subjective
cognitive decline are distinguishable from healthy controls with an accuracy of
97%.