1473
Dynamic longitudinal evolving patterns of functional cortical networks in progression of Alzheimer's disease1Radiology, Union Hospital, Tongji Medical College, Huazhong University of Science and Technology, Wuhan, China, 2Philips Healthcare, Beijing, China
Synopsis
The dynamic longitudinal change of brain in progression of AD is still unknown. We analyzed the brain networks of AD patients at different stages. We found in global network properties, most differences only existed between healthy people and patients, and few were discovered between patients at different stages. However, nearly all subnetwork properties showed significant differences between patients at different stages. Moreover, we found two different functional evolving patterns of cortical networks in progression of AD, named ‘Temperature inversion’ and “Monotonous decline”, but not the same monotonous decline trend as the external functional assessment observed in disease progression.
Purpose and Introduction
Alzheimer’s disease (AD) is the most common chronic progressive neurodegenerative disorder, which was pathologically characterized as the aggregation of abnormal amyloid-βand hyperphosphorylated tau proteins, with neuropsychiatric symptoms such as progressive memory impairment, cognitive decline, executive dysfunction, and language deficits 1-2. The pathogenesis of AD is concealed, and affecting both brain structure and function connections.According to the progression of disease, it can be divided into three main phases: preclinical, mild cognitive impairment (MCI) and dementia. We analyzed the brain networks of healthy people and patients at different disease stages (EMCI, LMCI, and AD) by the graph theory based on resting state fMRI. It focused on the difference between groups not only in the global attributes but also in local changes of brain network. By seeking to discover the significant brain functional connectivity features, we tried to explore the dynamical longitudinal evolving patterns of brain functional network in the course of AD progression to make us a better understanding of the disease pathogenesis.Methods
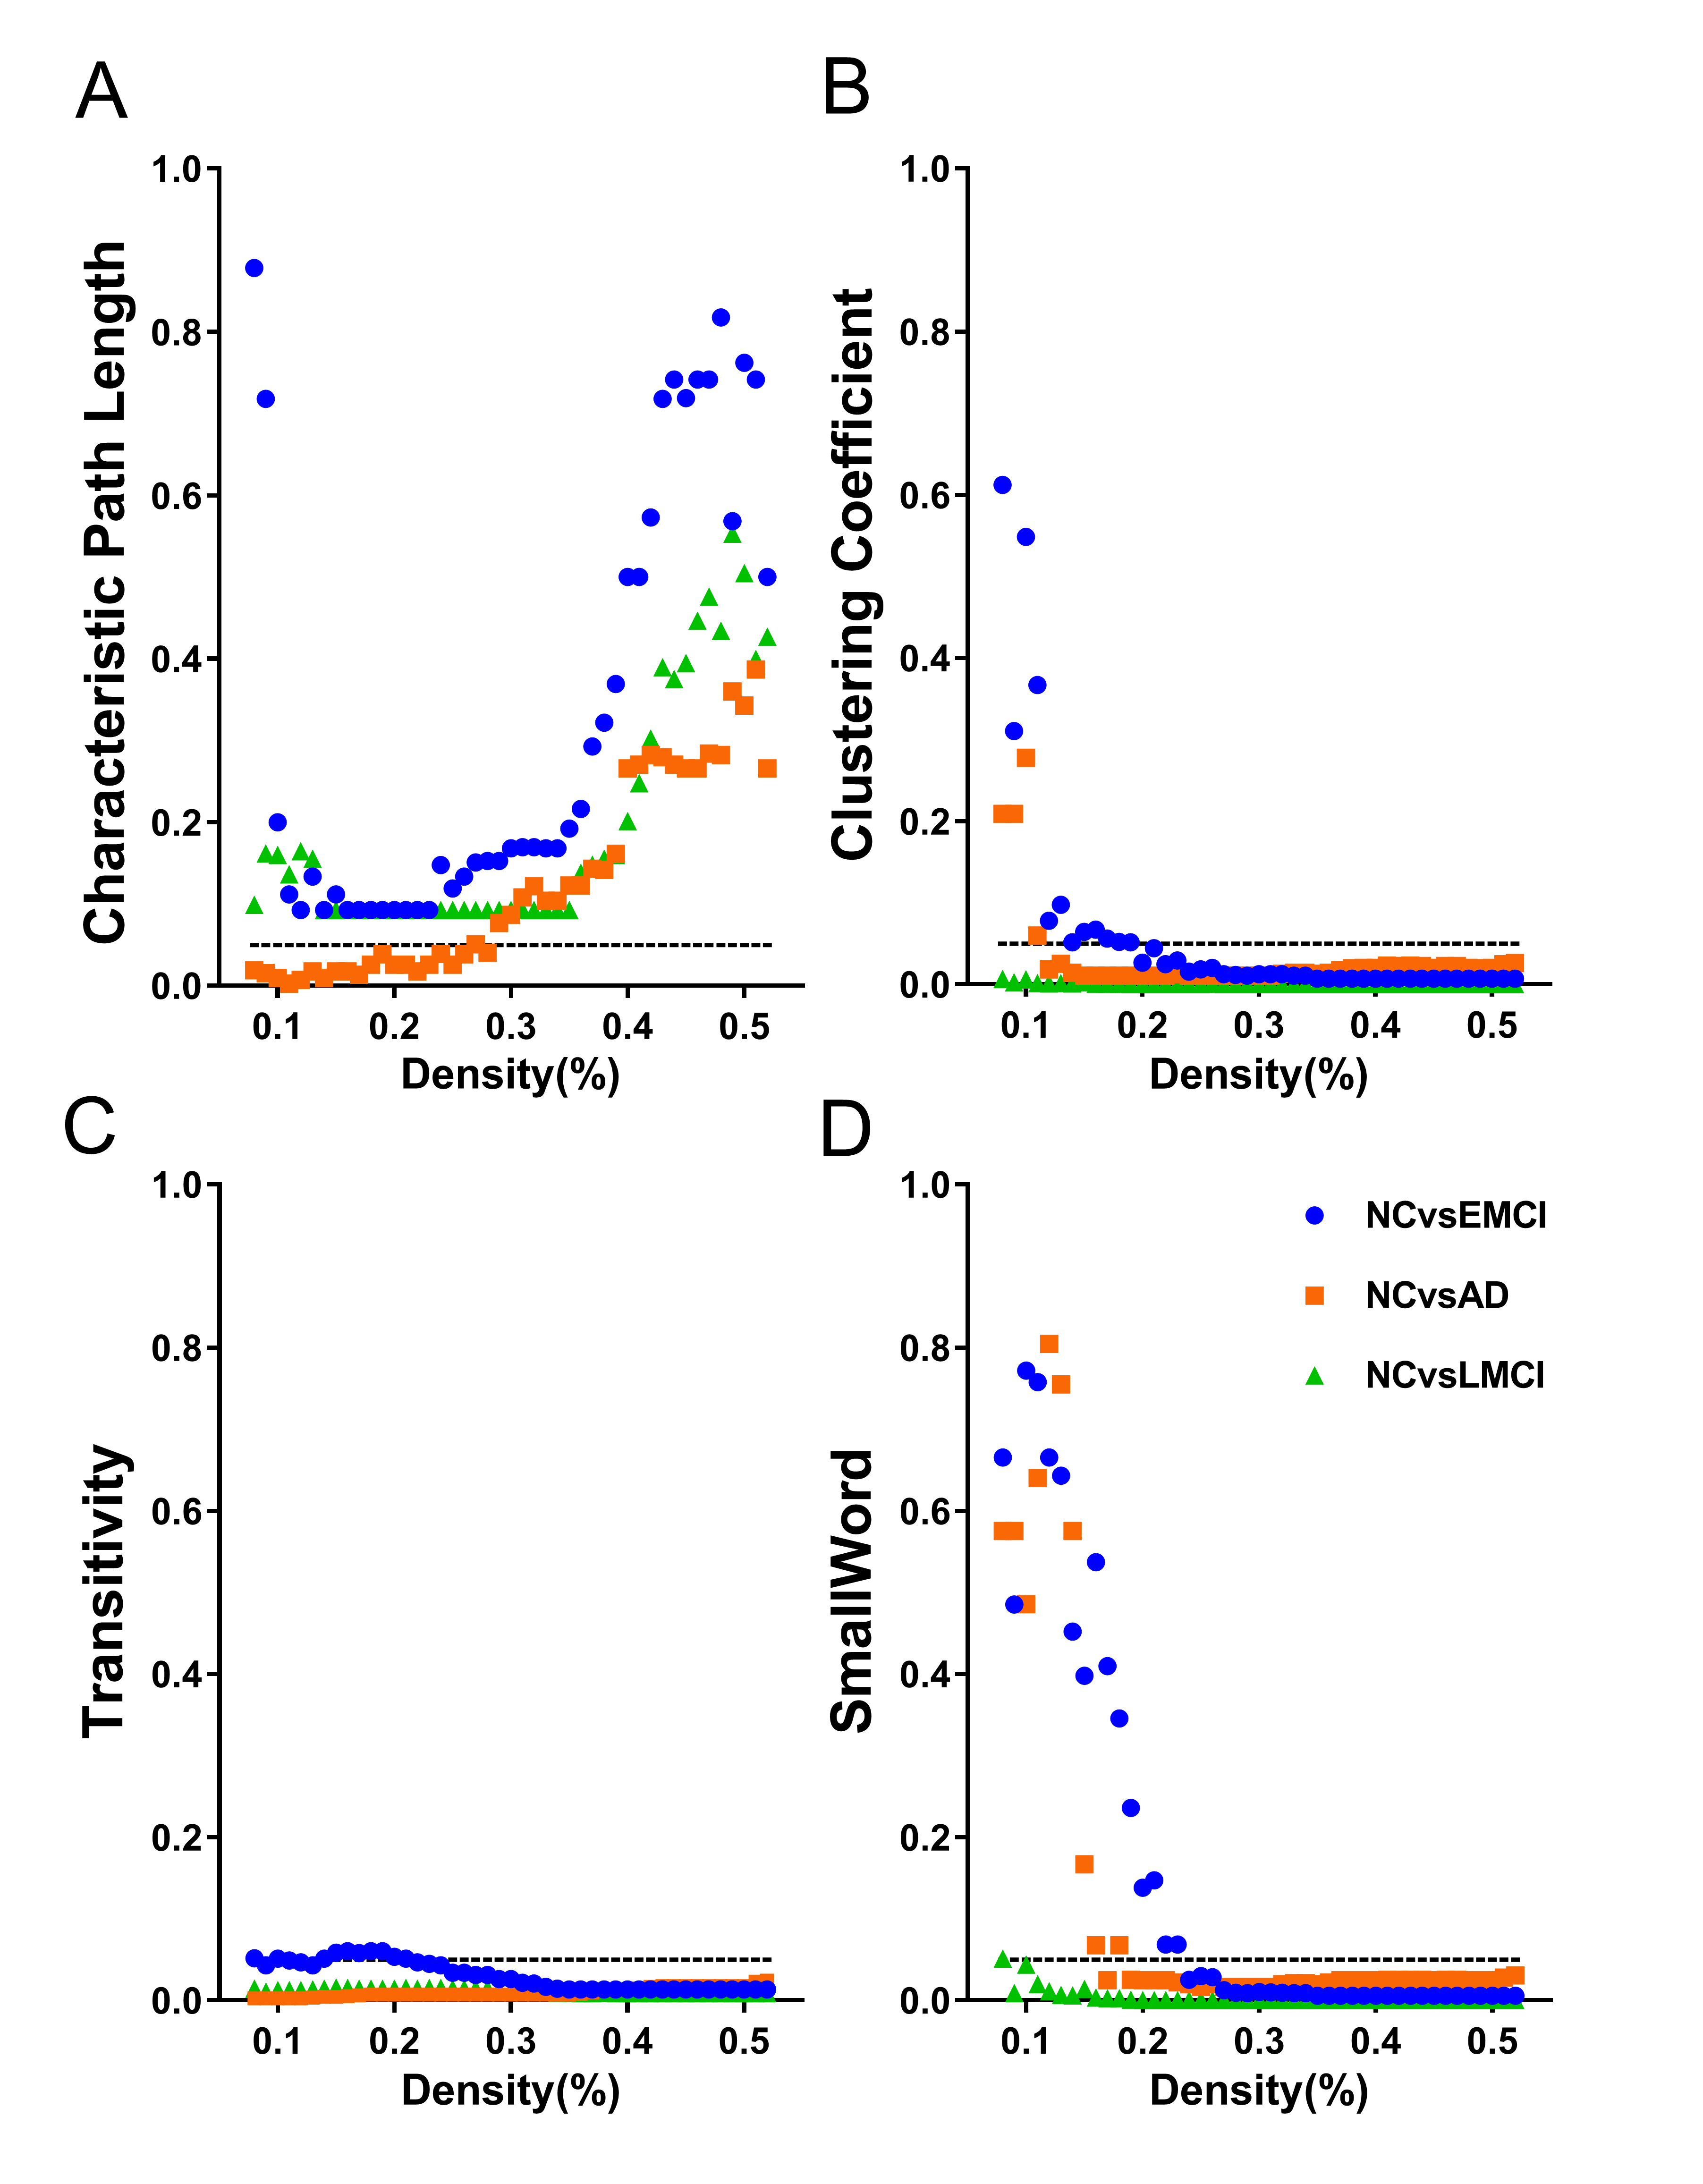
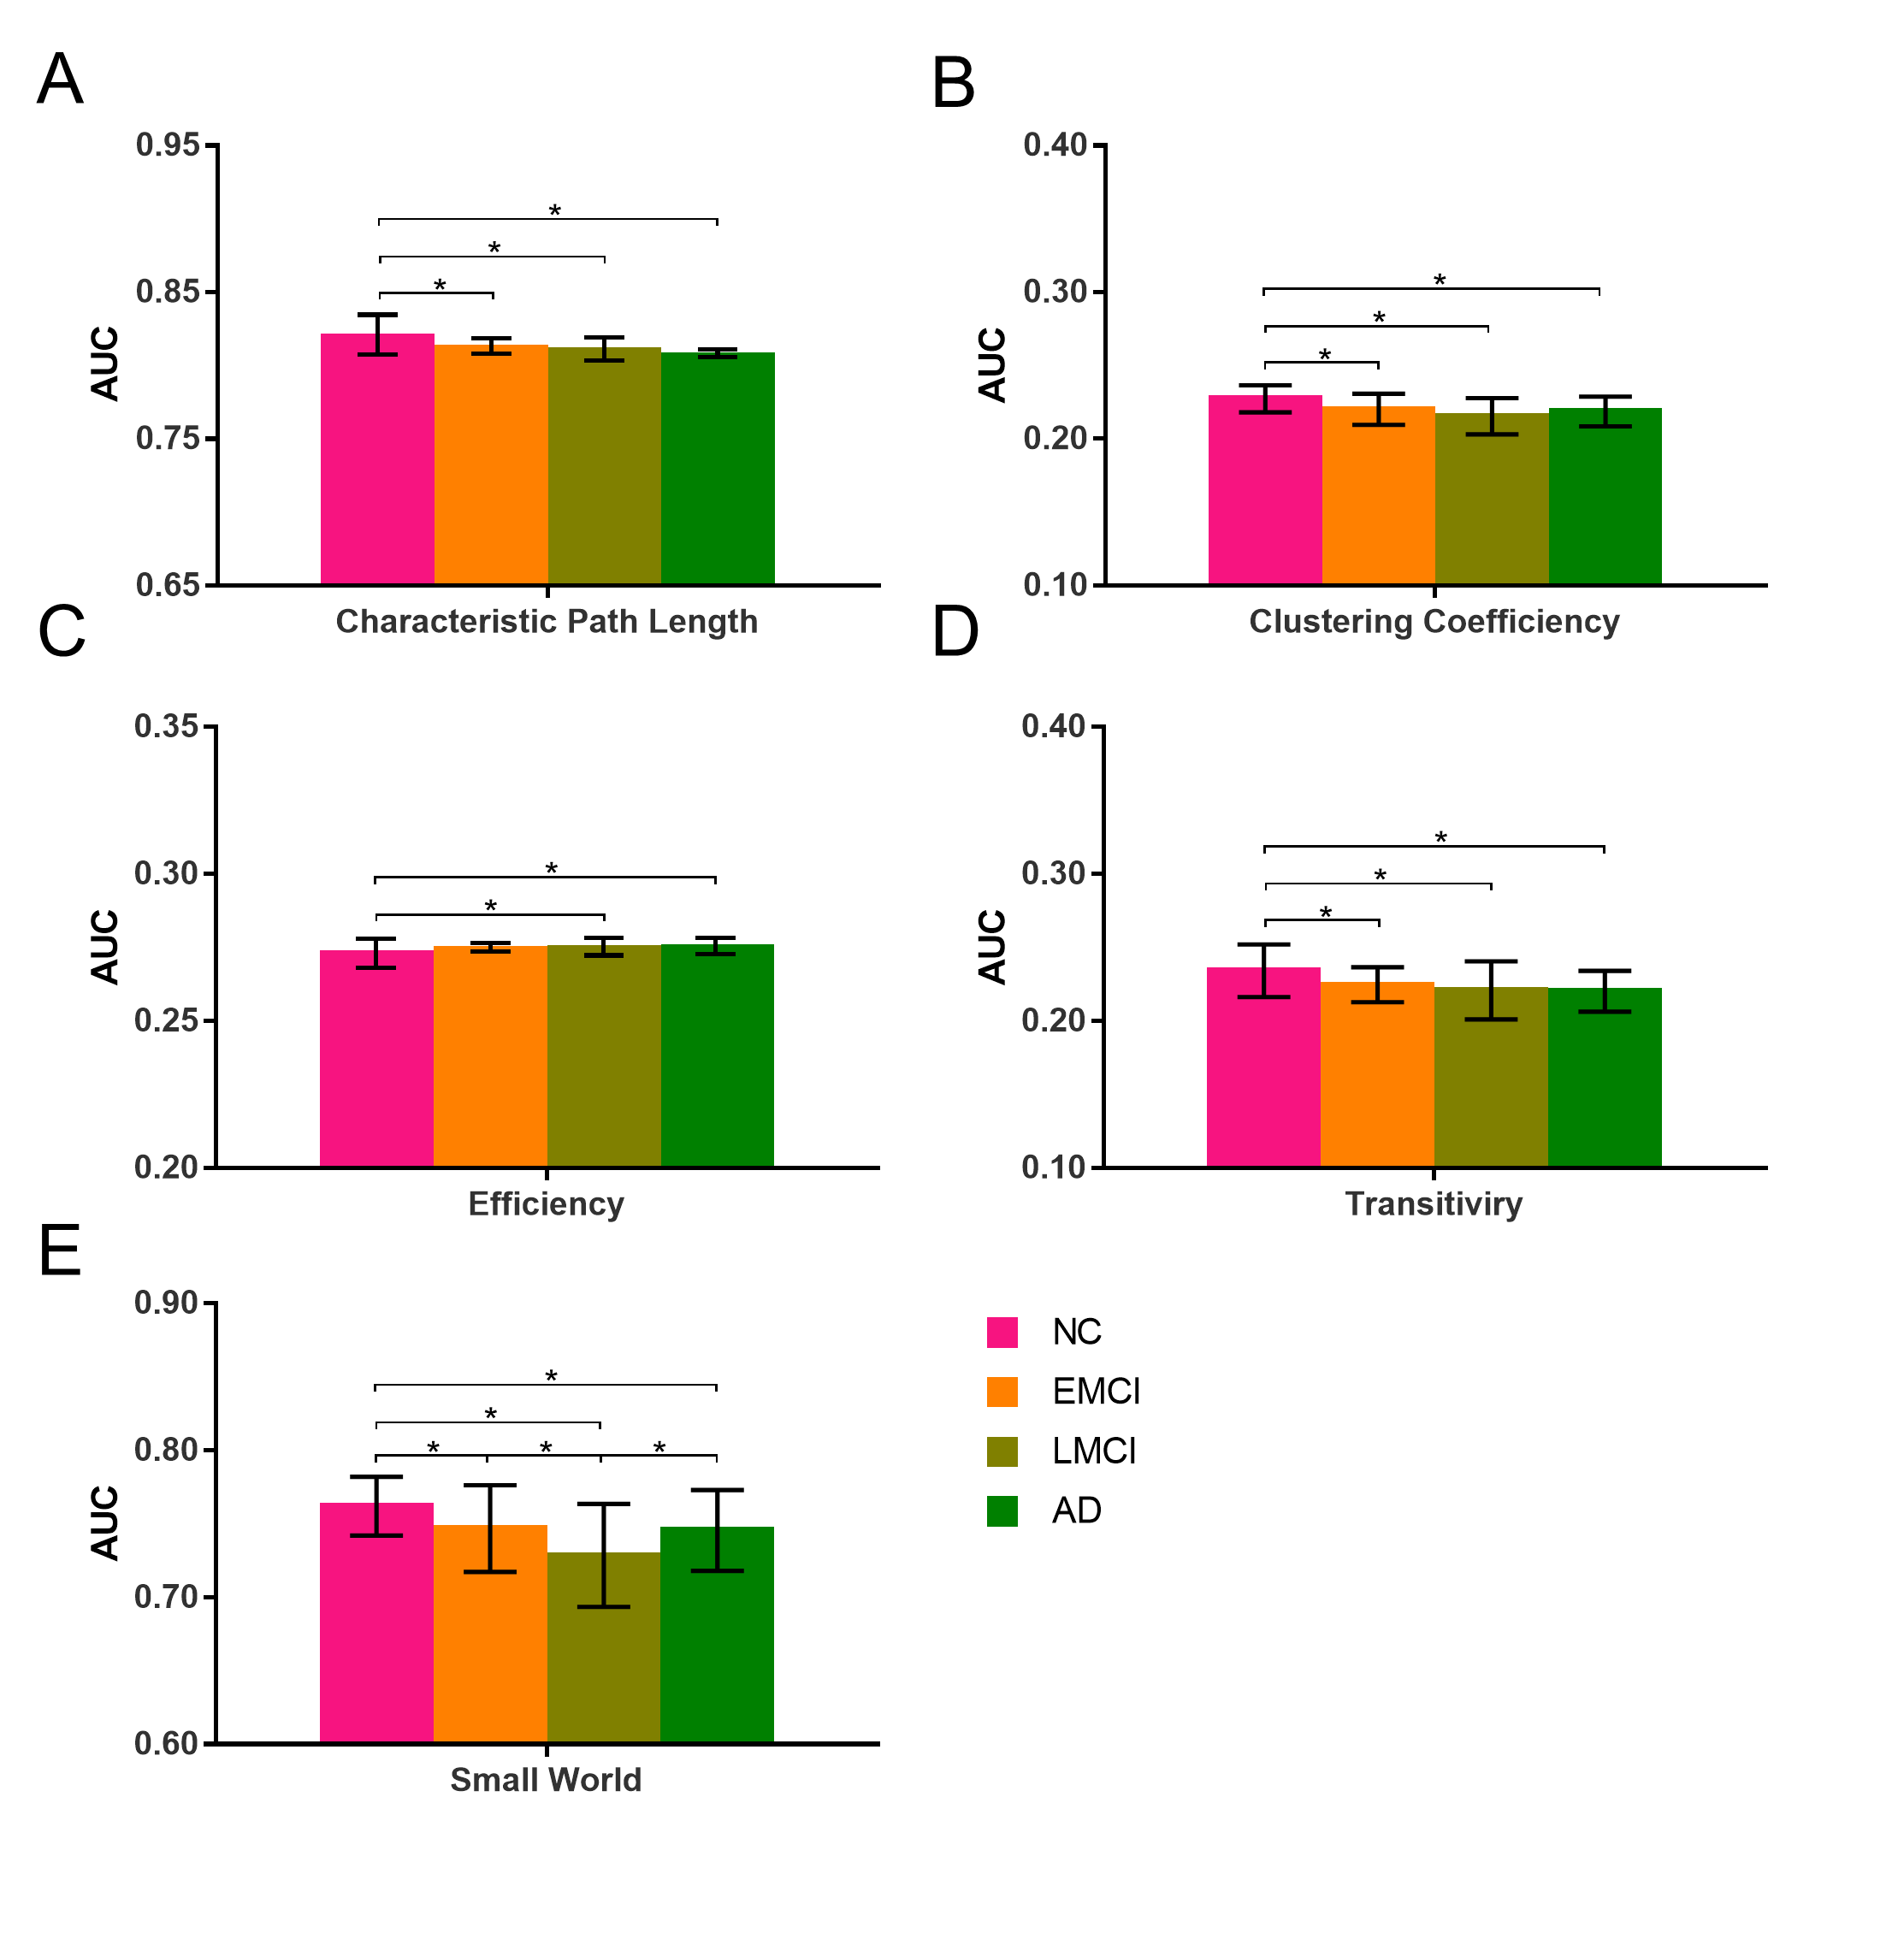
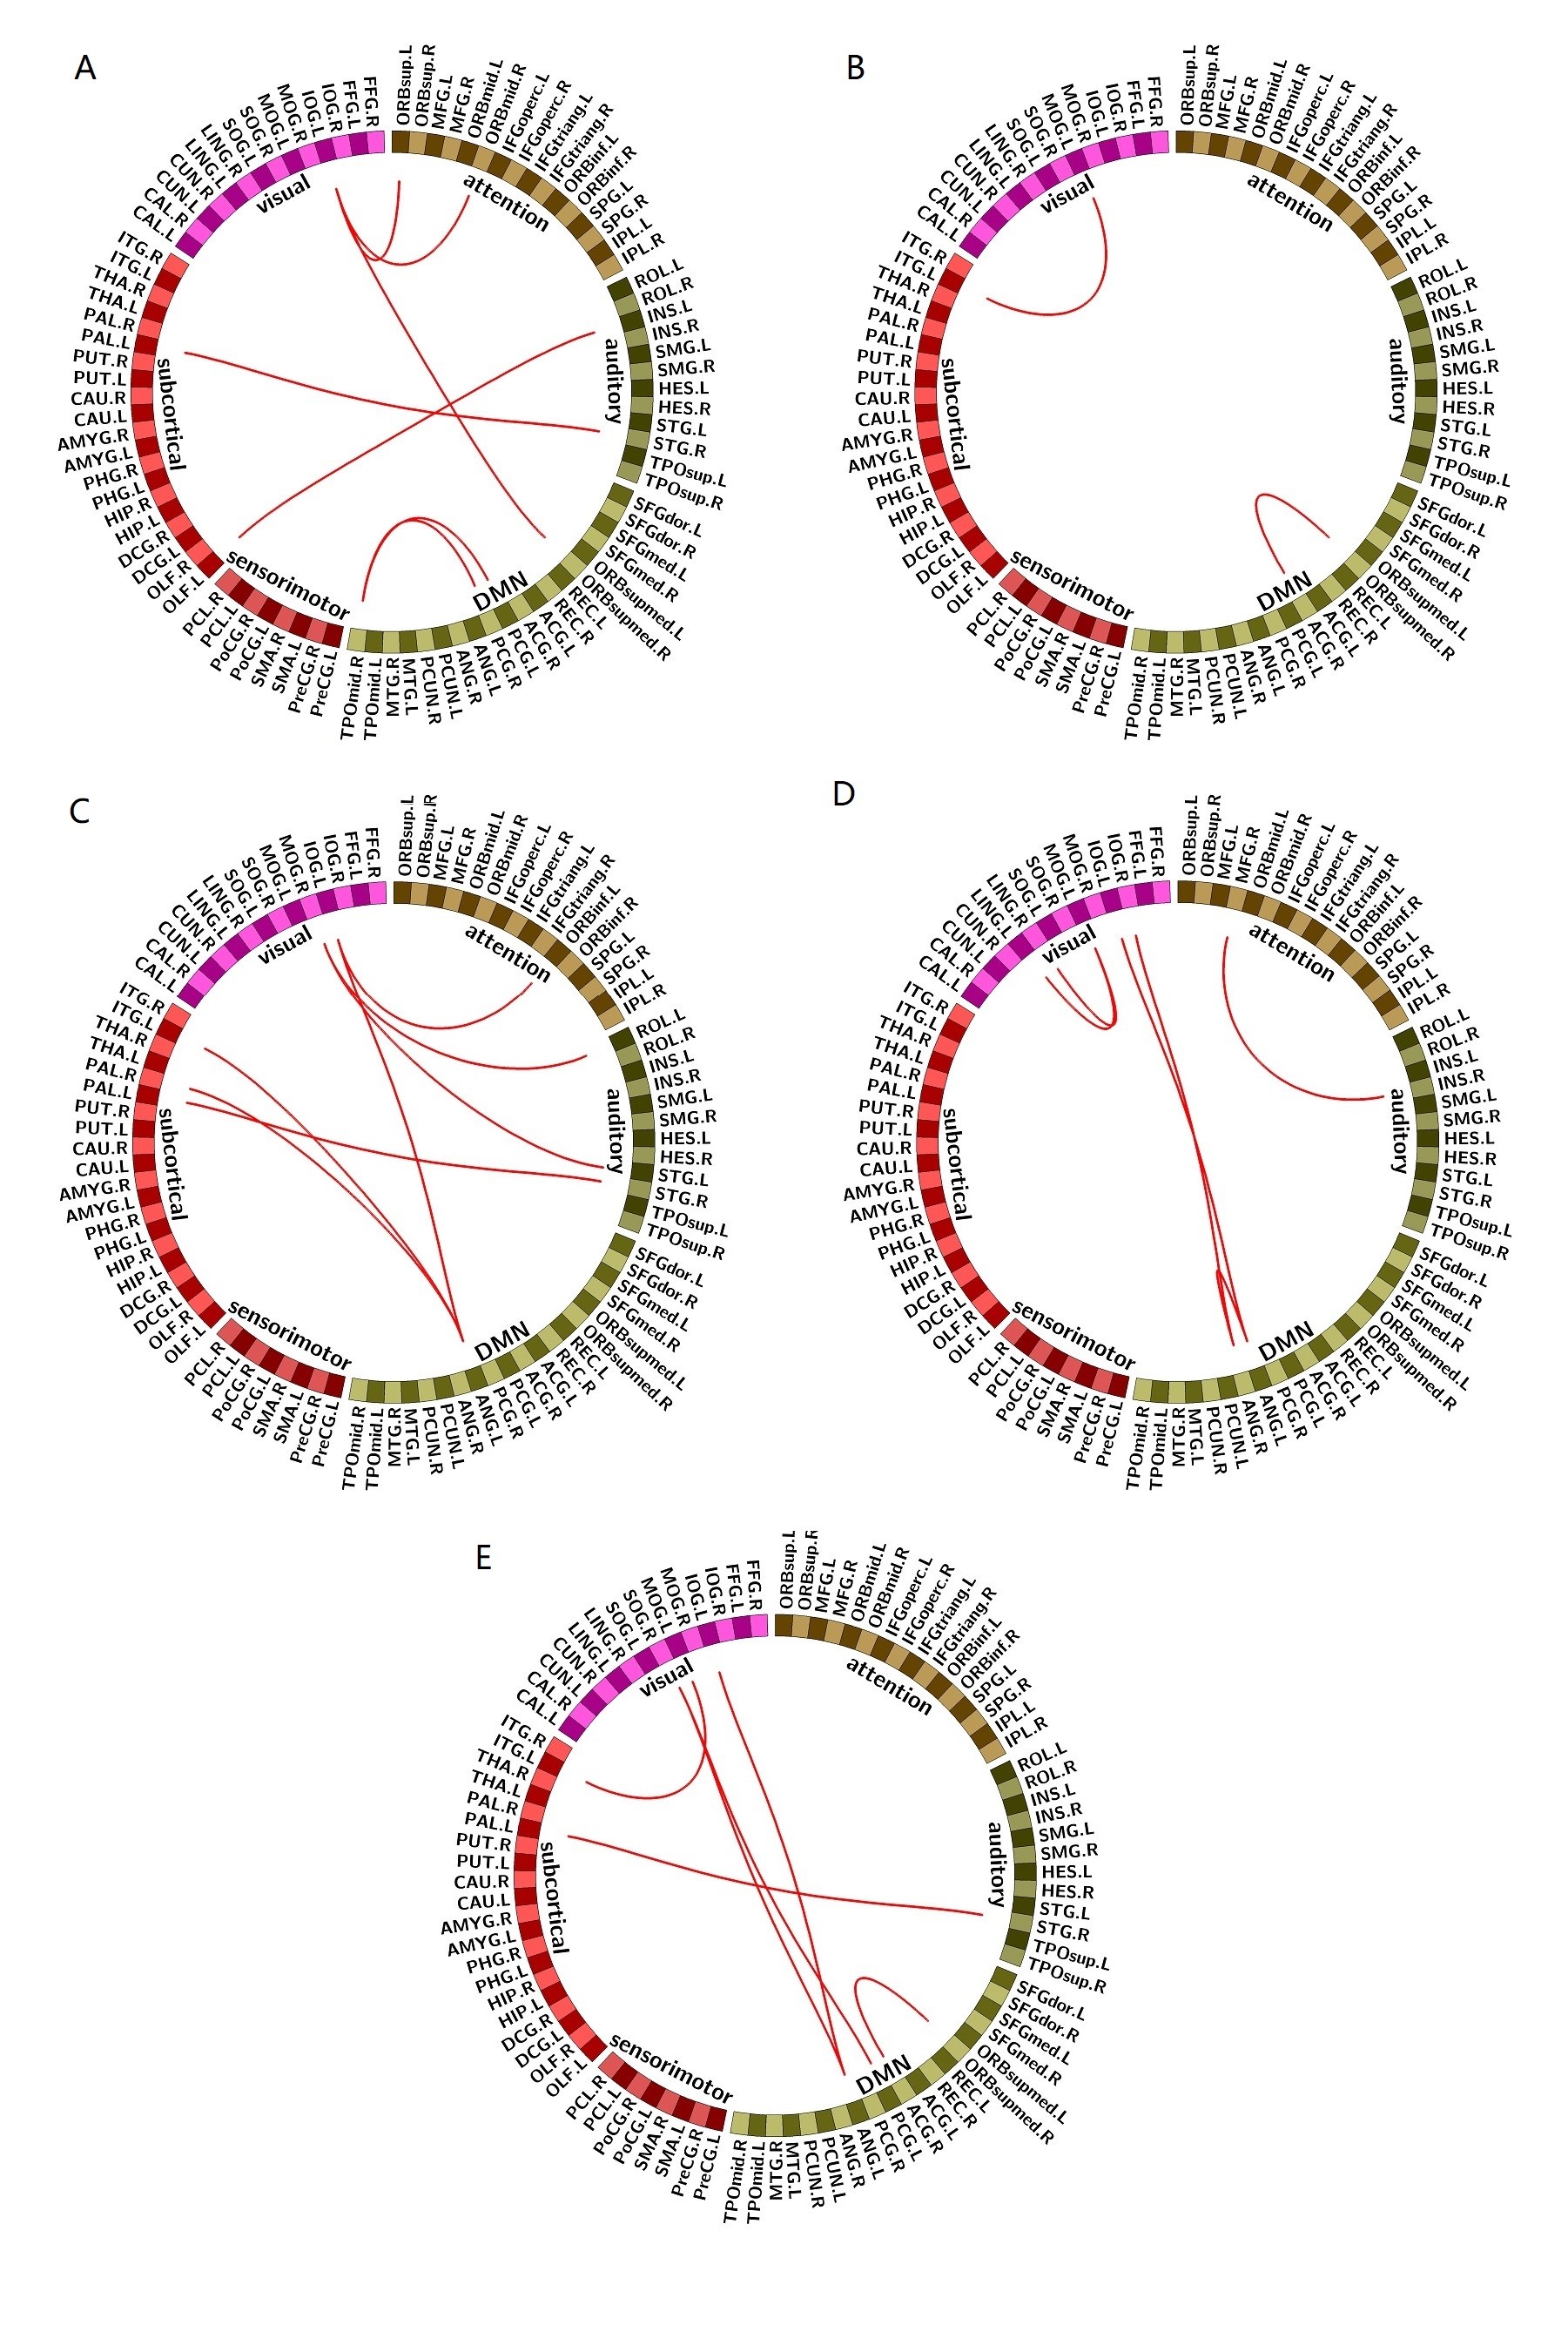
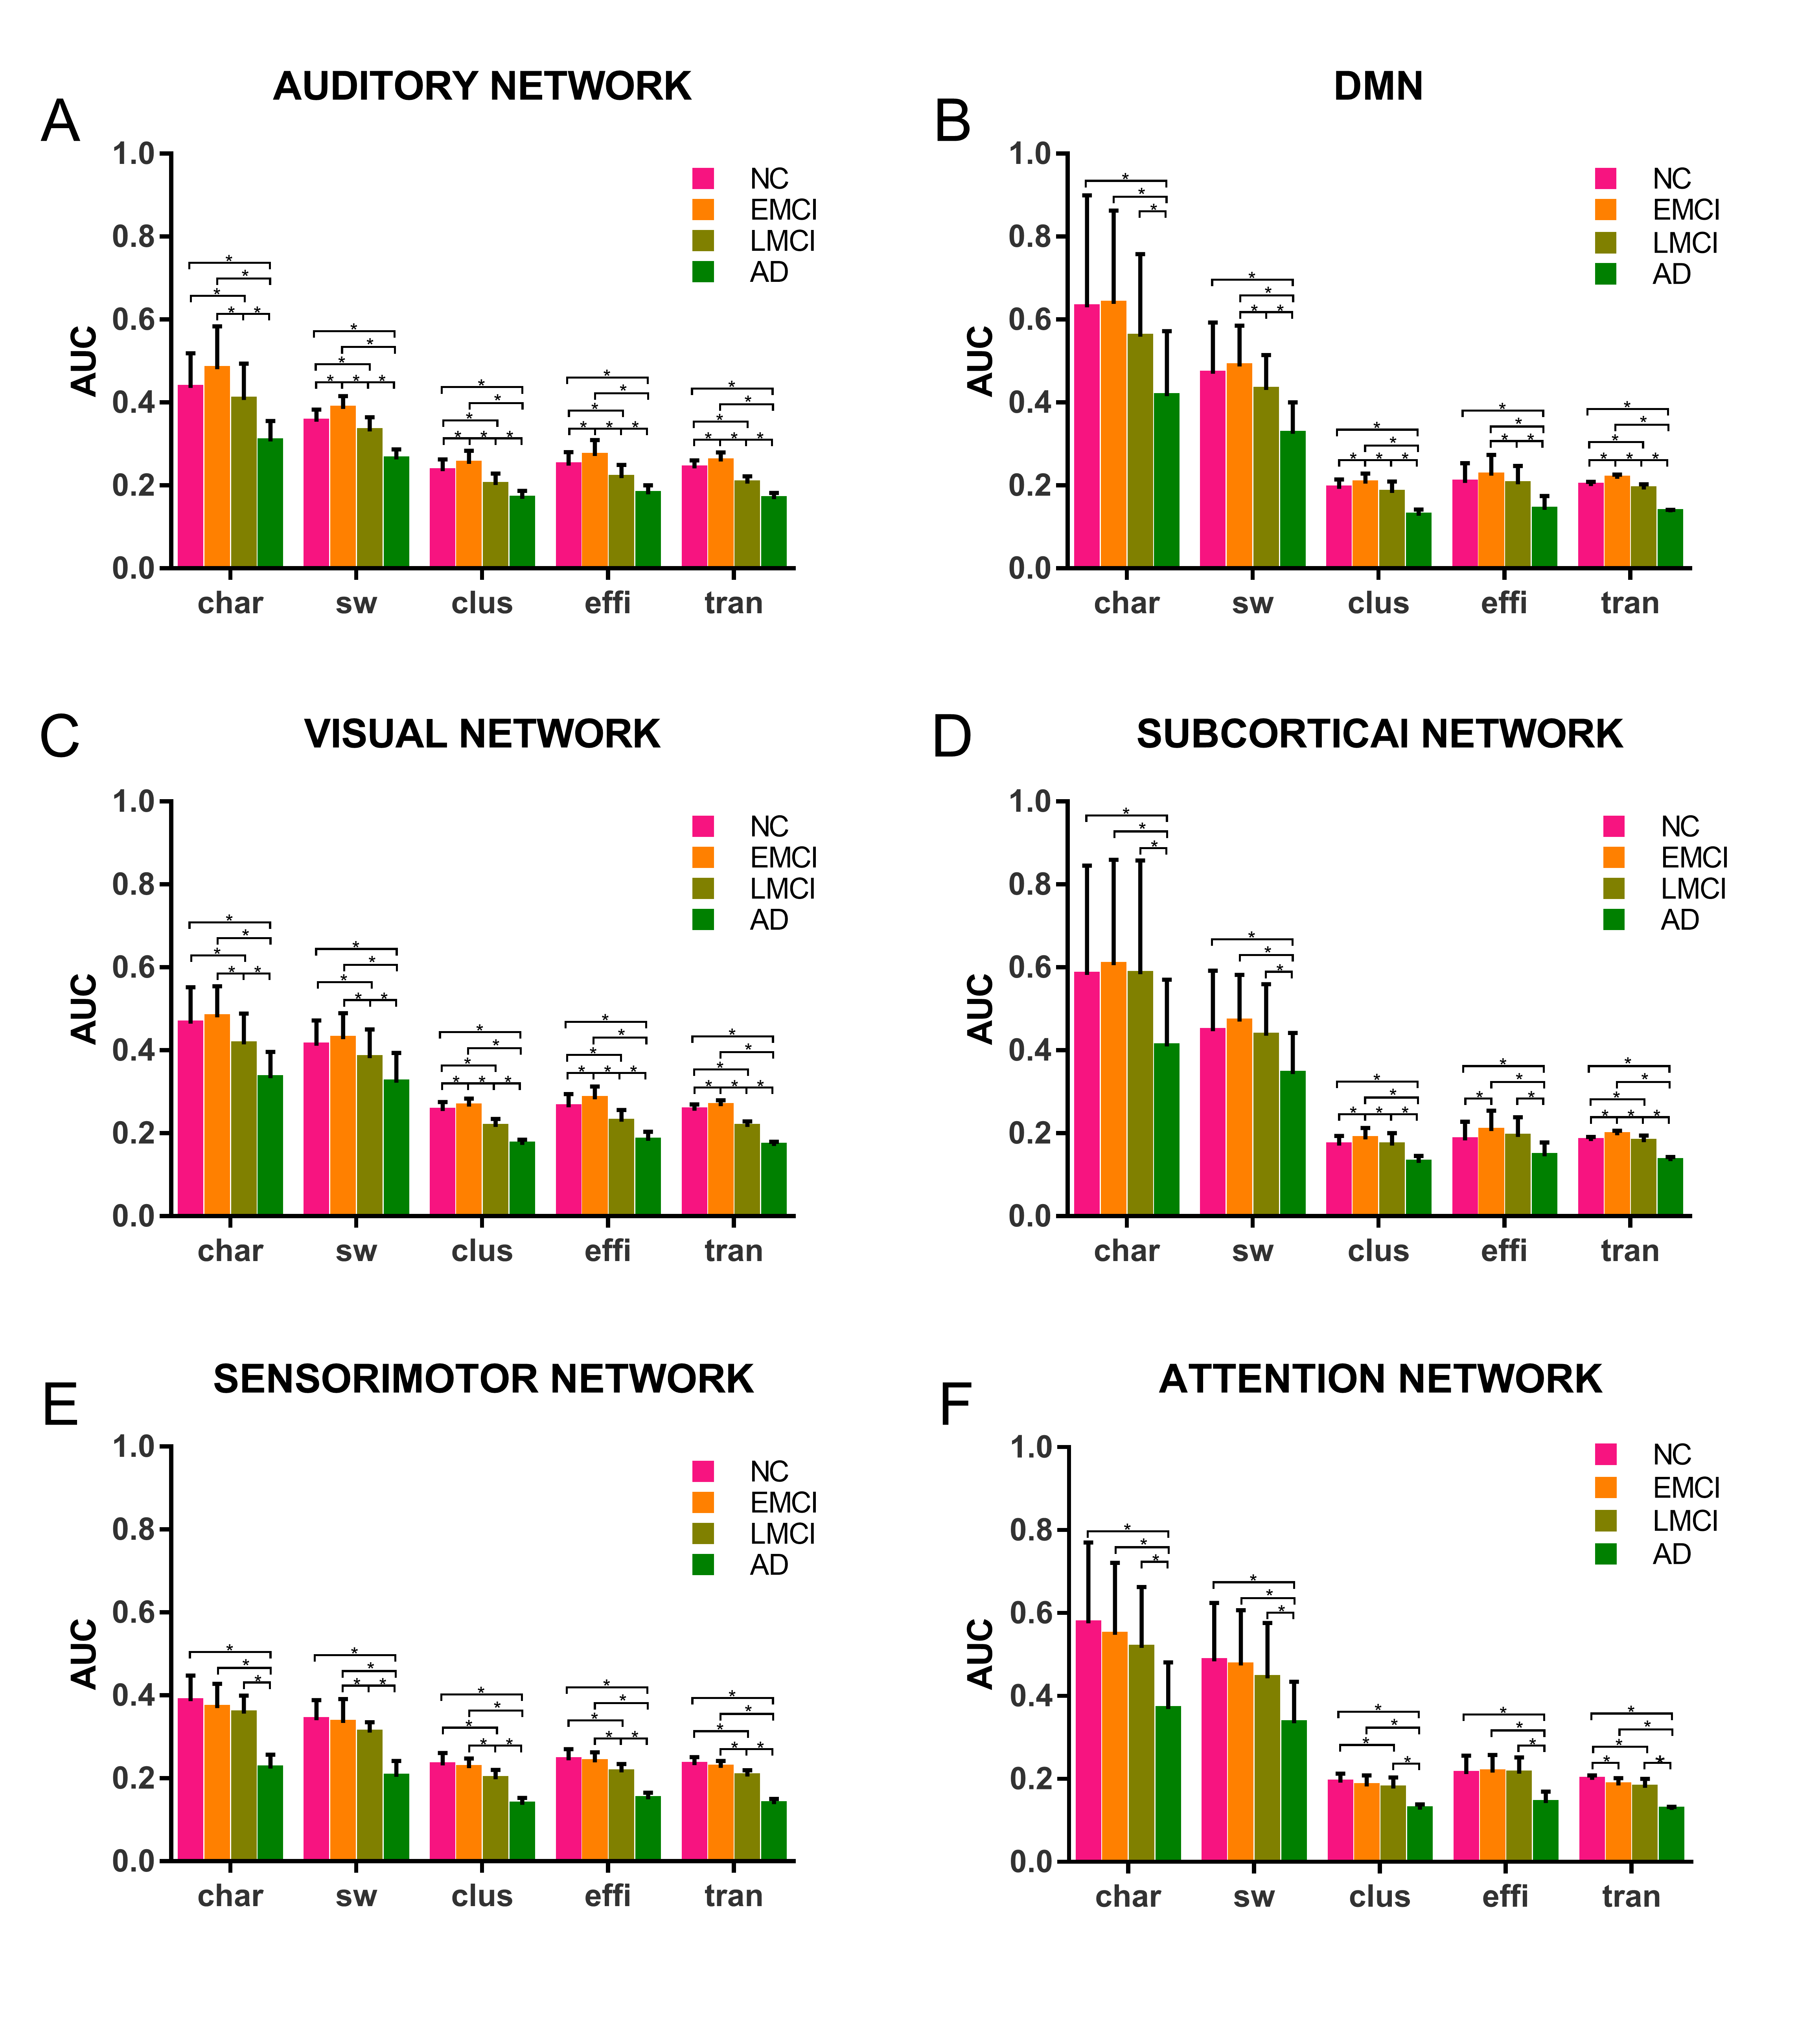
Twenty five patients with AD (Age: 75.17±4.08), thirty-three patients with LMCI (Age: 74.03±4.65), thirty seven patients with EMCI (Age: 72.96±4.55) and thirty five age-matched NCs (Age: 73.80±5.06) were scanned on a 3.0T MR scanner (Ingenia CX, Philips Healthcare, the Netherlands). Statistical Parametric Mapping and Data Processing Assistant for Resting-State fMRI (DPARSF) toolbox were used to preprocess the resting state functional MRI images. The construction of brain network was performed by the brain connectivity toolbox. Pearson correlation coefficient was calculated to obtain correlation matrix. The clustering coefficient, the efficiency, the transitivity, the characteristic path length and the small worldness were used to characterize the attributes of the brain networks. Correspondingly, we divided 90 regions into five RSN which included default mode network (DMN), attention network (ATT), subcortical network (SUB), auditory network (AUD), visual network (VIS), and sensorimotor network (SEN). We also calculated the global attributes of the RSNs whose connectivity matrix were the functional connectivity of paired regions belonging to the RSNs. Intra and Inter network analysis was performed by an in-house matlab toolbox.Results
Compared with LMCI, NC group has a significant difference at most brain network densities on characteristic path length, clustering coefficient, transitivity and small-world attribute. In efficiency, only NC group compared with LMCI and AD were different, while groups from other stages have no difference for each other. In the small world attribute, all group combinations showed significant differences except EMCI vs AD. It can be found that in the progression from NC to AD via EMCI and LMCI, the small-world attribute showed a U-shaped change curve. There was no difference in other attributes except the small-world attribute in EMCI vs LMCI, which may be due to the difference of these attributes between the two groups was too small to reach a significant level. For EMCI vs LMCI, LMCI vs AD, only the small-world attribute was significantly different and there was no difference on other attributes. In addition to the small world attribute and clustering coefficient which showed U-shaped changes in the disease progression, the other three attributes matched continuous monotonous decreasing trend. For each subnetwork, we found that the changing trends of properties of these subnetworks showed two distinct patterns as the disease progressing from NC to AD, via EMCI and LMCI. The properties of the four subnetworks, auditory network, default mode network, visual network and subcortical network appeared a first increasing and then decreasing pattern, which is an inverted U-shaped curve as the disease progressed to AD. In the NC – EMCI process, the properties rose, and peaked in EMCI. While in the EMCI-LMCI-AD process, all the properties turned to decline, down to the minimum in AD. On the other hand, the properties of sensorimotor network and attention network all showed a continuous decline, which we called as “monotonous decline”, in line with our common understanding of this disease, that is as the disease gets worse, brain areas continue to be attacked, and brain function declines in a monotonous decreasing pattern. The MMSE scores were observed to be related to the properties of the DMN in the LMCI stage.Discussion and Conclusion
For whole brain network analysis, the significant difference was found only between NC and patient groups, while between different patient groups in AD progression we discovered little significant difference. For subnetwork analysis, two distinct longitudinal evolving patterns of brain networks, named ”Temperature inversion” and “Monotonous decline”, were observed. It was totally different from the monotonous decline trend which we generally observed in the external functional assessment as AD progressed. We supposed that the work mechanisms of subnetworks with same evolving pattern may have something same in nature, and furthermore the interactions of the two types of subnetworks with different evolving patterns finally result in the topological performance of the whole brain network. In addition, the attributes of each subnetwork (the intra- and inter- subnetwork functional connectivity) for each disease stage have varying degrees of dynamically changing, mainly involving DMN and visual networks. These results may shed lights on the pathophysiological mechanism of AD progression.Acknowledgements
National Natural Science Foundation of China (81701673).References
1,Sorg C, Riedl V, Muhlau M, Calhoun VD, Eichele T, Laer L, Drzezga A, Forstl H, Kurz A, Zimmer C, Wohlschlager AM. 2007. Selective changes of resting-state networks in individuals at risk for Alzheimer's disease. Proc Natl Acad Sci USA 104: 18760-18765.
2,Petersen RC, Thomas RG, Grundman M, Bennett D, Doody R, Ferris S, Galasko D, Jin S, Kaye J, Levey A, Pfeiffer E, Sano M, van Dyck CH, Thal LJ. 2005. Vitamin E and donepezil for the treatment of mild cognitive impairment. N Engl J Med 352: 2379-2388.
Figures