1471
Comparison of locus coeruleus volume by using a high spatial-resolution MRI template among AD, MCI, and healthy controls1Health IT Research Center, Gil Medical Center, Gachon University College of Medicine, Incheon, Korea, Republic of, 2Center for Parkinson's Disease and Dementia, Neuroscience Research Institute, Gachon University, Incheon, Korea, Republic of, 3Department of Neurology, Gil Medical Center, Gachon University of College of Medicine, Incheon, Korea, Republic of, 4Department of Radiology, Gil Medical Center, Gachon University of College of Medicine, Incheon, Korea, Republic of
Synopsis
Locus coeruleus (LC) is involved in regulating working memory, learning, attention, and arousal/wakefulness in the brain and accumulating evidence suggest that the LC is the initial brain region that the earliest pathological changes occur in Alzheimer’s disease (AD). We employed neuromelanin-sensitive MRI to detect the changes of LC volumes in AD. Automatic segmentation of the LC revealed profound reductions in LC volumes in AD dementia as compared to prodromal AD and/or healthy controls. Our finding suggests that volumetric reduction of the LC would be a non-invasive biomarker for detecting early pathological changes in AD.
Introduction
The locus coeruleus (LC), a nucleus in the pons of the brainstem, is the principal site in the regulation of arousal and autonomic function via its widespread projections. It has also been implicated in attention, emotion, cognitive control, and memory [1]. Recent advances in imaging technique allow us to quantify the integrity of LC in vivo in early pathological changes such as Parkinson’s disease (PD) [2] and Alzheimer’s disease (AD)3. In the AD, tau aggregates are observed first in the LC, prior to their presence in the entorhinal cortex and neocortex [3], suggesting LC is the initial site of pathology. In vivo quantitative measurement of LC would therefore assist with not only the early diagnosis of AD, but also monitoring therapeutic response. Neuromelanin-sensitive MRI (NM-MRI) can detect signal alteration or morphometric changes in the LC, which might reflect the loss of neuromelanin-containing neurons. In this work, we aimed to compare LC volumes among AD dementia, prodromal AD stage (e.g, mild cognitive impairment), and healthy controls using 3D T1 TSE NM-MRI with clinically reasonable scan time (approximately 5 minutes).Methods
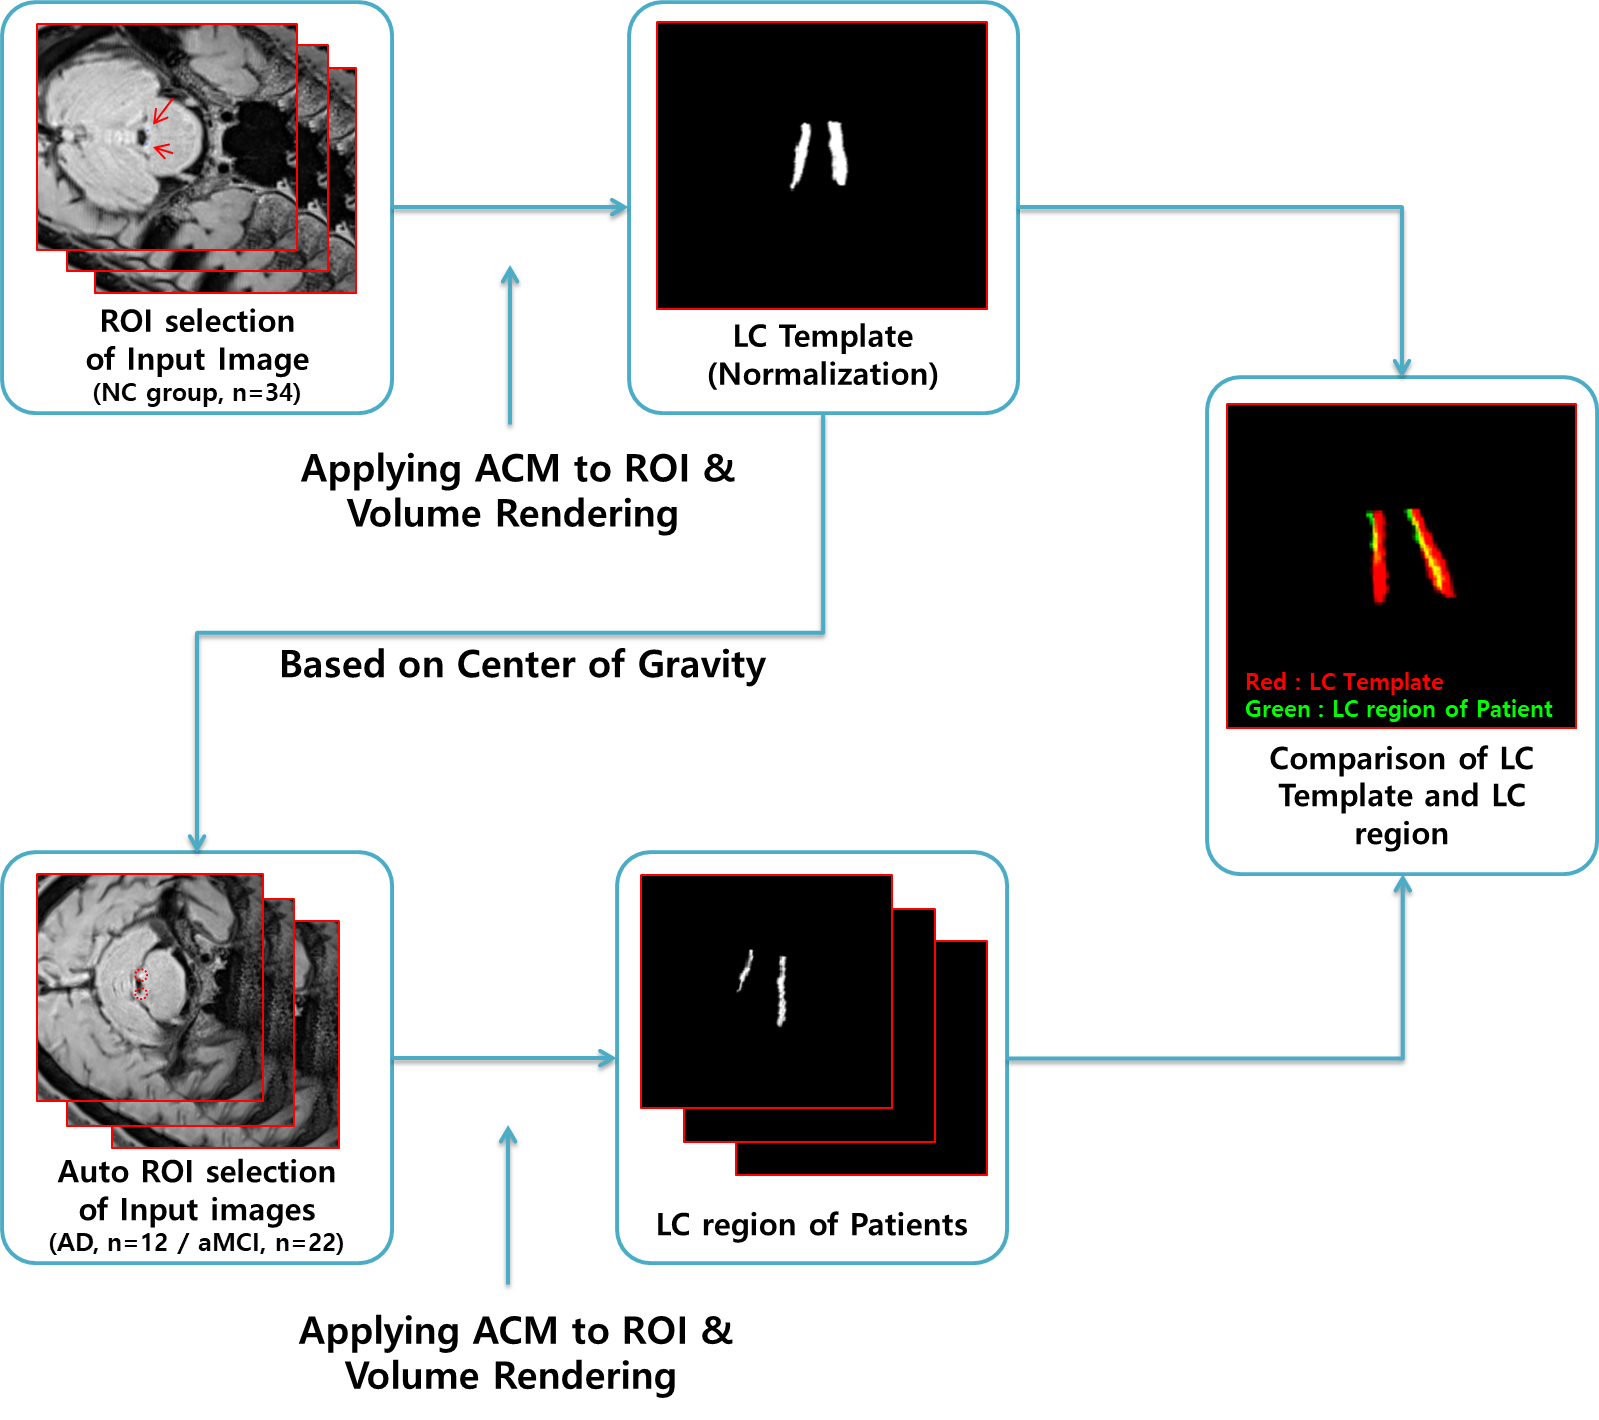
Sixty-eight participants who had been clinically diagnosed with AD dementia (n=22), amnestic mild cognitive impairment (aMCI, n=12), or normal control (NC, n=34) were included in this study. The patients with AD dementia met the probable AD criteria as proposed by the National Institute of Neurological and Communicative Disorders and Stroke and the AD and Related Disorders Association [4], while the patients with aMCI were classified according to Petersen’s criteria [5]. All healthy volunteers had no neurological or psychiatric illnesses, and no abnormalities detected on neurologic examination. All subjects underwent 3.0 T MRI scans and [18F]-Flutemetamol (FLUTE) PET scans. 18F-FLUTE PET scans were acquired using a Siemens Biograph 6 Truepoint PET/computed tomography scanner (Siemens, Germany) with a list-mode emission acquisition. All MR images were obtained at 3 T Siemens Skyra MR scanner. For NM-MRI, we used 3D T1-weighted TSE SPACE (Sampling Perfection with Application optimized Contrasts using different flip angle Evolution) with DANTE (Delay alternating with nutation for tailored excitation) preparation pulse sequence with following parameters: TR/TE=900/4.8 ms, matrix size: 288 × 288, slice thickness: 0.8 mm, in-plane resolution: 0.8 × 0.8 mm2, number of slices: 208, Echo train length: 70, pixel bandwidth: 425, CAIPIRINHA factor: 2, scan time: 5 min 12 sec. In order to produce the LC templates and quantify them, first we proposed a method to effectively extract LC regions from MR image data using Active Contour Model (ACM) [6,7]. The region of interest (ROI) required for initial region detection was manually specified and normalized to generate one representative LC template. Then, to extract the LC regions of AD dementia and aMCI patients, the center point of the template object was automatically entered into the ROI region. The ACM detected the boundary at the point where the sum of internal and external energy was minimized, and calculated the optimal LC boundary using morphological filtering [8]. The LC data were extracted in the form of 3D voxel data through volume rendering [9]. Comparisons of demographic and clinical data between AD dementia, aMCI, and NC group were conducted using Kruskal-Wallis test. Categorical variables were evaluated using the χ2 test or Fisher’s exact test. The p value less than 0.05 was considered as statistically significant.Results
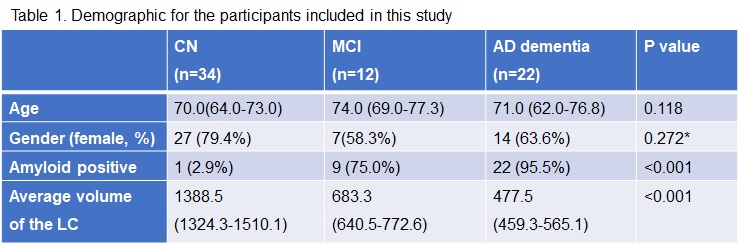
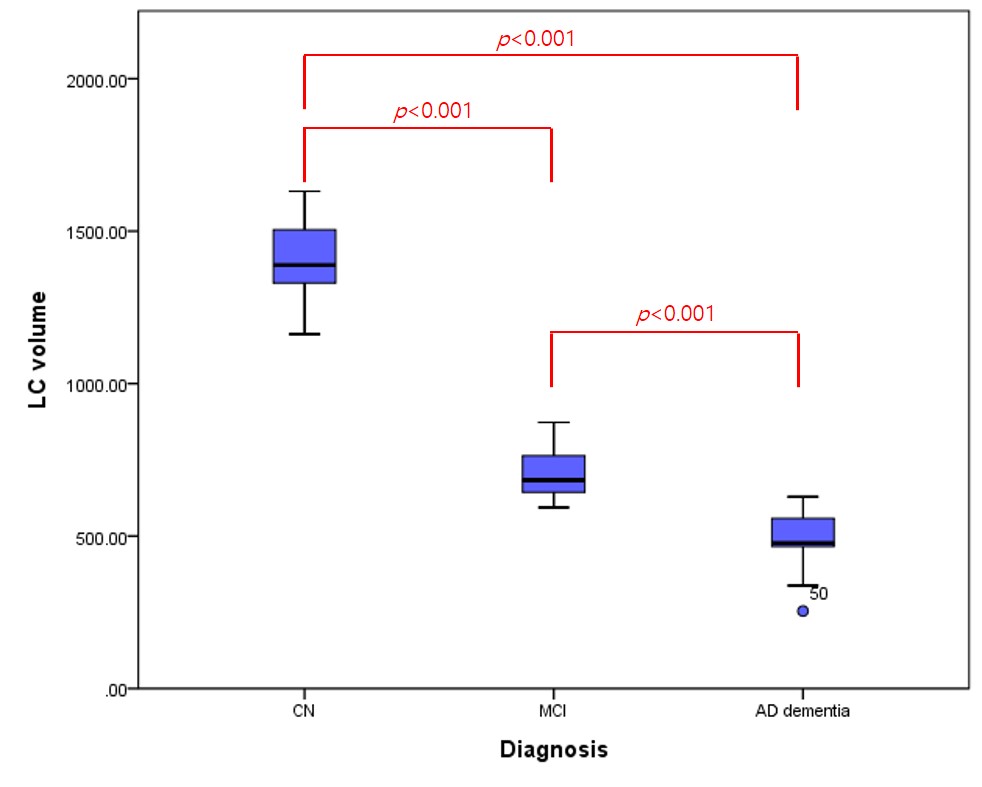
The information for demographic, amyloid positivity, and average volumes of LC for each group are shown in Table 1. There were no significant differences in age and gender among the three groups (p > 0.05). The overview of registration and segmentation protocol is provided in Figure 1. Significantly lower LC volumes were observed in AD dementia as compared to aMCI and/or NC group (Figure 2). In addition, the LC volumes were significantly lower in aMCI as compared to those in NC group (Figure 2).Discussion and Conclusion
In this work, we demonstrated that LC volume decreased progressively with the disease progression (e.g., prodromal to probable AD), which might suggest that the degree of loss of neuromelanin-containing neurons be dependent on the disease severity. Strikingly, the LC volumes in AD dementia decreased by 50.8 % and 65.6 % as compared to those in aMCI and NC group, respectively. A recent study has shown that the average LC volume was reduced by 8.4 % for each unit increment of the Braak staging [10]. Another study revealed a 22 % LC volume difference between five AD patients and five control subjects [11]. Our finding is in line with previous reports. The strength of our study includes fully-automatic segmentation of LC, which can avoid time-consuming manual drawing of the LC as well as operator-dependent bias. However, there is a limitation that should be noted. As the sample size of aMCI group is relatively small, caution should be exercised for the interpretation of our finding. Given that maintaining the neural density of the LC prevents cognitive decline in aging [12], further study to investigate the association between LC volume and cognitive function in vivo would be of great interests in AD research. In conclusion, our findings suggest that volumetric reduction of the LC would be a non-invasive biomarker for detecting early pathological changes in the AD.Acknowledgements
This study was supported by a grant of the Korea Healthcare Technology R&D Project through the Korea Health Industry Development Institute (KHIDI), funded by the Ministry of Health & Welfare, Republic of Korea (grant No: HI14C1135).References
1. Benarroch EE. The locus ceruleus norepinephrine system: functional organization and potential clinical significance. Neurology 2009;73:1699-1704.
2. Braak et al., Staging of brain pathology related to sporadic Parkinson’s disease. Neurobiol Aging 2003;24:197-211.
3. Braak et al. Stages of the pathologic process in Alzheimer disease: age categories from 1 to 100 years. J Neuropathol Exp Neurol 2011;70:960-969.
4. McKhann G et al., Clinical diagnosis of Alzheimer’s disease: report of the NINCDS-ADRDA Work Group under the auspices of Department of Health and Human Services Task Force on Alzheimer’s Disease. Neurology 1984;34:939-944.
5. Petersen RC. Clinical practice. Mild cognitive impairment. N Engl J Med 2011;364:2227-2234.
6. Chan, Tony; Vese, Luminita. An active contour model without edges. In: International Conference on Scale-Space Theories in Computer Vision. Springer, Berlin, Heidelberg, 1999:141-151.
7. Xu, Juan, Opas Chutatape, and Paul Chew. Automated optic disk boundary detection by modified active contour model. IEEE transactions on biomedical engineering, 2007; 54(3):473-482.
8. Serra, Jean; VINCENT, Luc. An overview of morphological filtering. Circuits, Systems and Signal Processing, 1992;11(1): 47-108.
9. Stegmaier, Simon, et al. A simple and flexible volume rendering framework for graphics-hardware-based raycasting. In: Fourth International Workshop on Volume Graphics, 2005. IEEE, 2005:187-241.
10. Theofilas P et al., Locus coeruleus volume and cell population changes during Alzheimer’s disease progression: A stereological study in human postmortem brains with potential implication for early-stage biomarker discovery. Alzheimers Dement 2017;13:236-246.
11. Hoogendijk WJ et al. Image analyser-assisted morphometry of the locus coeruleus in Alzheimer’s disease, Parkinson’s disease and amyotrophic lateral sclerosis. Brain 1995;118:131-143.
12. Wilson RS et al., Neural reserve, neuronal density in the locus ceruleus, and cognitive decline. Neurolgy 2013;80:1202-1208.
Figures