1469
fMRI complexity is associated with tau-PET and cognitive decline in Alzheimer’s disease1USC Stevens Neuroimaging and Informatics Institute, Keck School of Medicine at USC, Los Angeles, CA, United States, 2http://adni.loni.usc.edu/wp-content/uploads/how_to_apply/ADNI_Acknowledgement_List.pdf, Los Angeles, CA, United States
Synopsis
Recently entropy measures have been explored as indices of the complexity of rs-fMRI time-series which decrease in aging and dementia. Here, we compared multi-scale entropy (MSE) of rs-fMRI with tau PET measures of neurofibrillary tangles in a cohort of 50 aged subjects in the ADRC database, through correlational and machine learning approaches. We show that the complexity of BOLD signals provides an index of the information processing capacity of regional neuron populations, and is associated with tau-related neuronal injury and cognitive decline in the AD processes.
INTRODUCTION
Amyloid-PET is considered an early marker for the preclinical stage of AD, while the neurofibrillary tangle pathology detected with tau-PET imaging correlates more closely with neuronal injury and cognitive decline [1]. However, PET scans are expensive and involve radioactive tracers. Recently entropy measures have been explored as indices of the complexity of rs-fMRI time-series. Reduced entropy values were associated with aging, APOE ɛ4 genotype and cognitive decline in autosomal dominant Alzheimer’s disease (ADAD) and late-onset AD (LOAD) [2-4]. Here we hypothesize that the complexity of BOLD signals provides an index of the information processing capacity of regional neuron populations, and is sensitive to tau-related neuronal injury and cognitive decline in the AD processes.METHODS
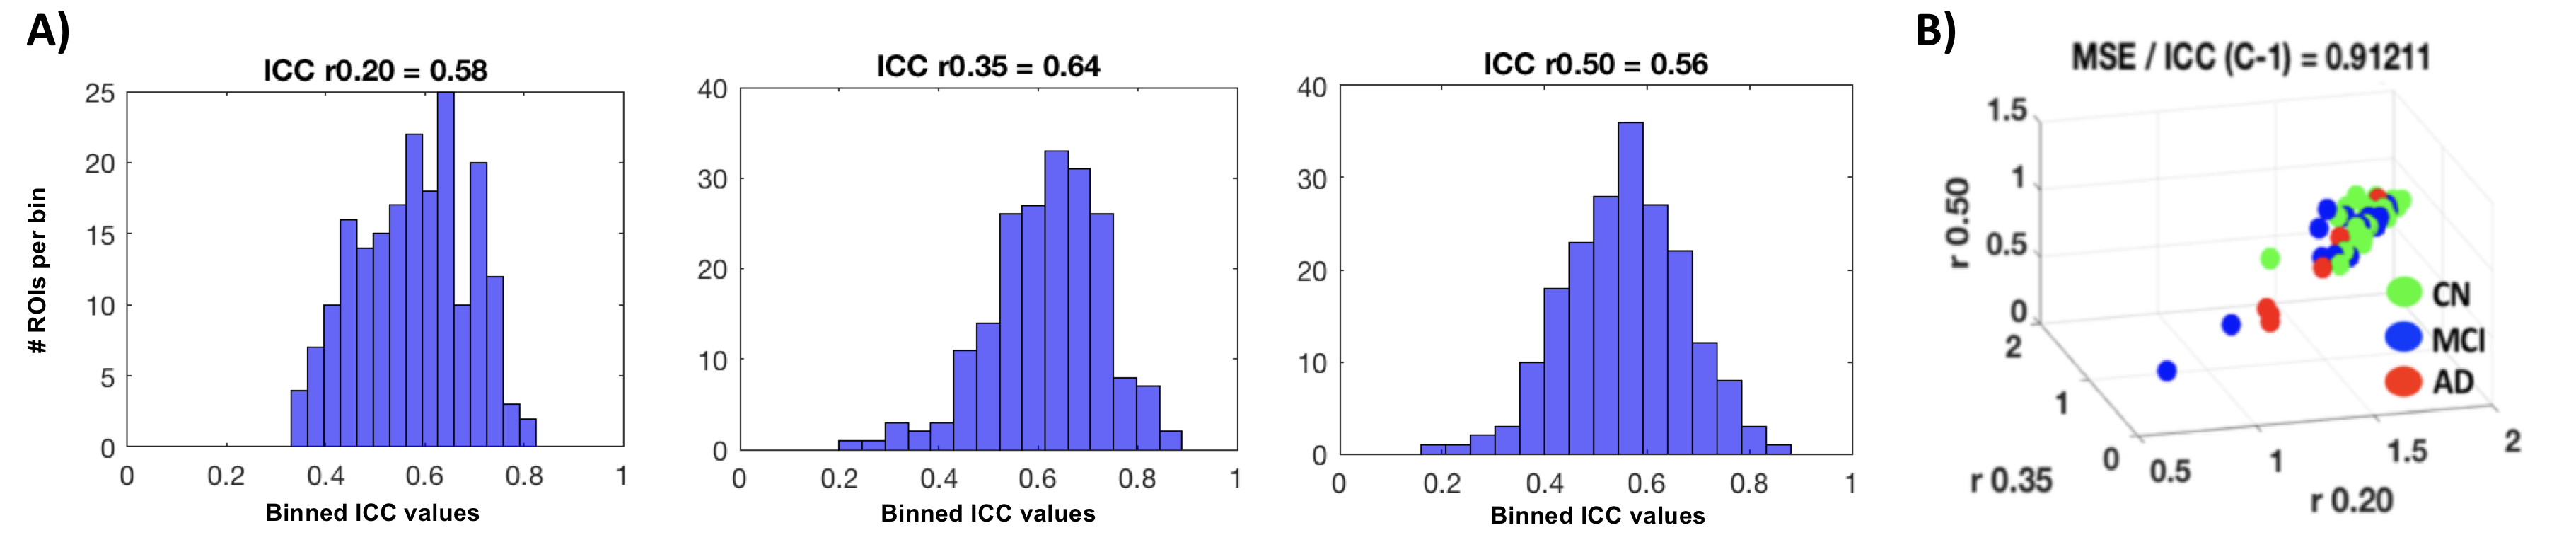
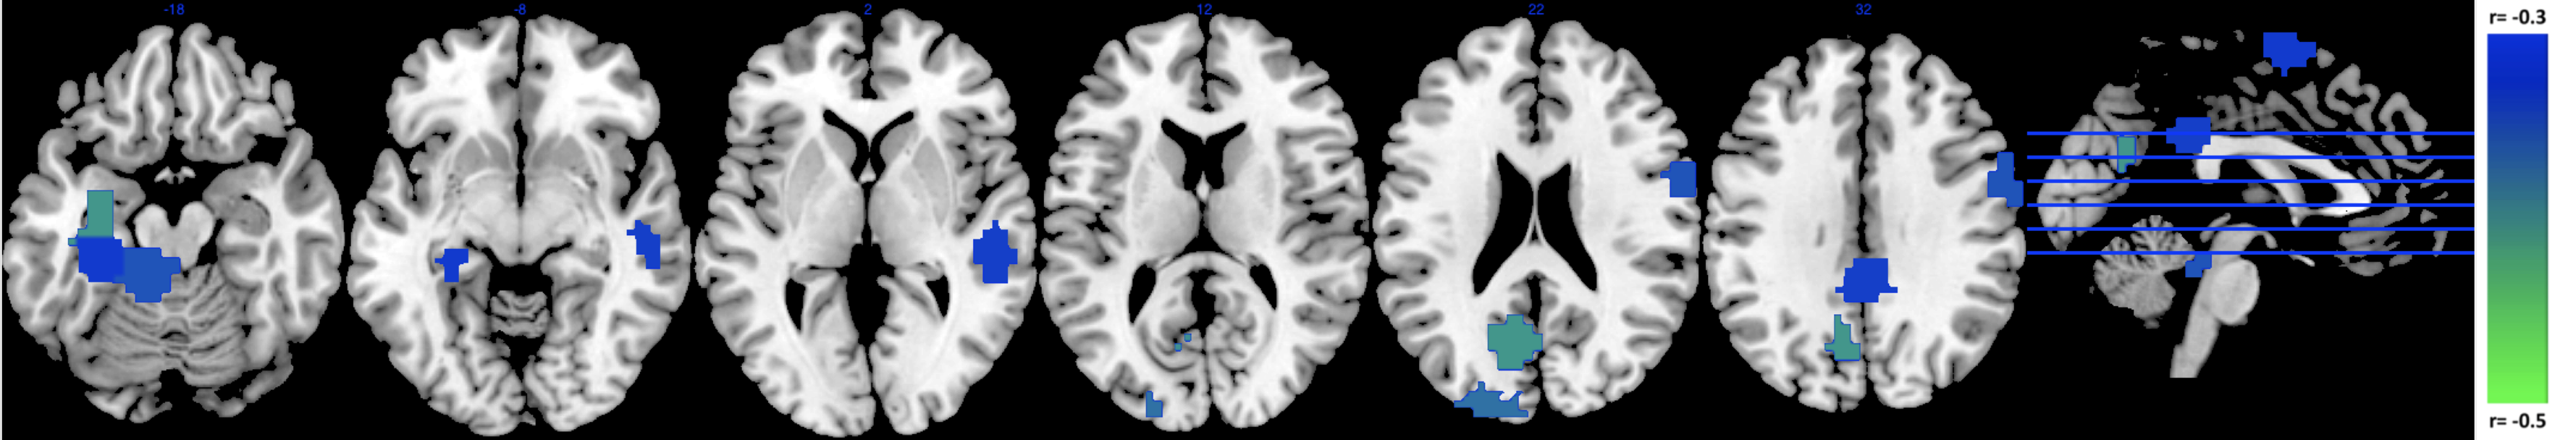
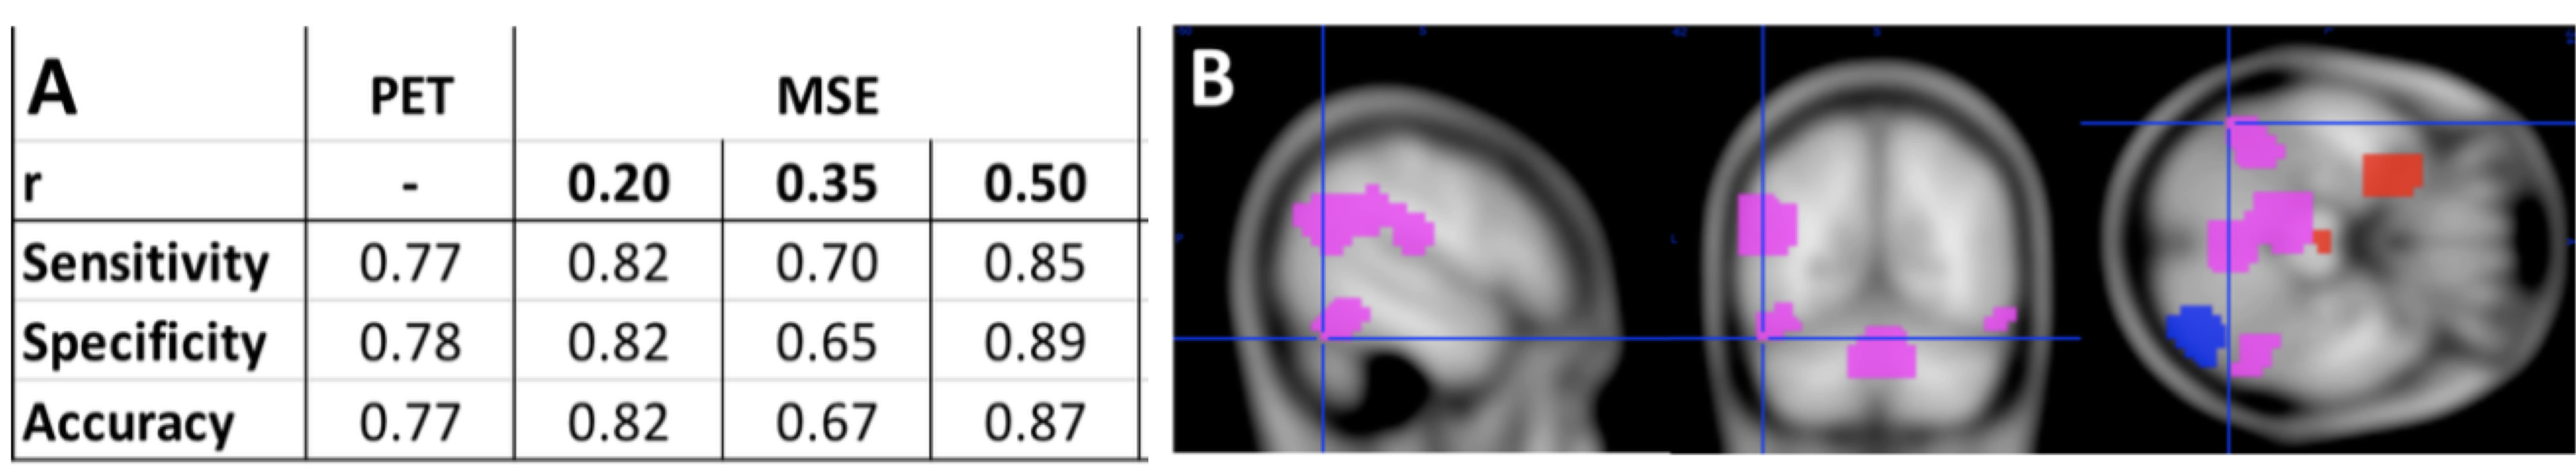
Data used in this study were obtained from the Alzheimer’s Disease Neuroimaging Initiative (ADNI) database (adni.loni.usc.edu). Our cohort consisted of a randomly selected sample of 50 subjects from ADNI-3 (age=72.4±8.2, 19M/31F, 25CN, 19MCI, 6AD). All participants had a T1 structural scan, a tau PET (tracer: 18F-AV1451) scan and two fMRI sessions with ADNI basic protocol (isotropic 3.4mm, TR/TE=3000/30ms, ~10min with 197 acquisitions). FMRI data were motion-corrected, normalized to MNI space and smoothed with an 8mm Gaussian kernel. Physiological and motion related signal fluctuations were regressed based on eroded WM and CSF masks from probabilistic tissue segmentation and 12 motion parameters (x,y,z translation and rotation plus first derivatives), respectively. Multi-Scale Entropy (MSE) was computed for 6 scales. Different scales are calculated by coarse-sampling the original BOLD time-series. Frequency is calculated by 1/(scale*TR), thus low-scales represent higher frequency complexity (scale 1 is at the original temporal resolution) while higher scales capture complexity of low frequency signal fluctuations. We used pattern matching length m = 2 and three different pattern matching thresholds r = 0.20, 0.35, 0.50 to estimate entropy at each scale. To estimate the effect of r we calculated ICC values between the MSE results from both fMRI sessions. Tau-PET data were normalized into MNI space and smoothed with an 8mm Gaussian kernel. Cerebellar segmentation was performed with SUIT (http://www.diedrichsenlab.org/imaging/suit.htm), and dorsal regions were removed from the cerebellar ROI [5]. Average PET signal was extracted for reference regions in inferior cerebellar gray matter in native PET space. Parametric SUVR images were created by dividing PET signal in each voxel by the average signal in the cerebellar reference region. Partial correlations between SUVR tau-PET and MSE at different scales were calculated for 195 cortical and subcortical ROIs based on Craddock atlas parcellation [6] including age, gender and regional gray matter volume as covariates. To evaluate if MSE and PET can be used to classify AD from CN we trained and tested a random-forest classifier as a prediction model via 10-fold cross-validation. Sensitivity, specificity and accuracy are reported.RESULTS
ICC values for MSE at different pattern matching thresholds revealed moderate to good test-retest reliability [7] at a given r-value (ICC r0.50=0.56 r0.35=0.64 r0.20=0.58; Fig1A) and excellent repeatability across r-values (ICC=0.91; Fig1B). For the correlation analysis we found significant negative correlations between low frequency MSE (0.056Hz) and standard uptake value ratios (SUVR) tau-PET measures in areas of hippocampus, parahippocampal gyrus and posterior cingulate cortex (Fig2; (average across all significant ROIs -0.38±0.05, p<0.05). Finally, the random-forest prediction model revealed that MSE and PET have similar prediction accuracy and sensitivity with MSE at r=0.50 showing even better performance (Table Fig3A). The most informative features (ROIs) for the prediction (ranked using GINI index [8]) revealed a large degree of overlap between MSE at r=0.50 and tau-PET specifically in bilateral inferior temporal gyrus, left inferior parietal lobe and ROIs in right frontal lobe (Fig3B).DISCUSSION
The areas that showed negative correlations between tau-PET and low-frequency MSE align with areas reported to be associated with Alzheimer’s pathology. Specifically, the PCC, lateral parietal and temporal areas have been demonstrated to be the most prominent loci of tau-pathology [9]. Furthermore, tau pathology has been found to be more closely linked to cognitive decline than amyloid-beta and complexity of time-series have been associated with information processing capacity [10-11]. Additionally, MSE and PET demonstrated similar classification capability to distinguish cognitive normal subjects from AD patients. The most informative ROI for the classifier were again areas that have pathophysiological relation to AD namely the inferior temporal gyrus and lateral parietal lobes. Hence, these overlapping findings from correlational and classification analyses support our hypothesis that the complexity of rs-fMRI is negatively correlated with regional tau protein accumulation measured by PET and could provide a marker for information processing capacity of regional neuron populations and prediction of cognitive decline in the AD processes.Acknowledgements
HK is funded by a BrightFocus Foundation grant (A2019052S).
Data collection and sharing for this project was funded by the Alzheimer's Disease Neuroimaging Initiative (ADNI) (National Institutes of Health Grant U01 AG024904) and DOD ADNI (Department of Defense award number W81XWH-12-2-0012). ADNI is funded by the National Institute on Aging, the National Institute of Biomedical Imaging and Bioengineering, and through generous contributions from the following: AbbVie, Alzheimer’s Association; Alzheimer’s Drug Discovery Foundation; Araclon Biotech; BioClinica, Inc.; Biogen; Bristol-Myers Squibb Company; CereSpir, Inc.; Cogstate; Eisai Inc.; Elan Pharmaceuticals, Inc.; Eli Lilly and Company; EuroImmun; F. Hoffmann-La Roche Ltd and its affiliated company Genentech, Inc.; Fujirebio; GE Healthcare; IXICO Ltd.; Janssen Alzheimer Immunotherapy Research & Development, LLC.; Johnson & Johnson Pharmaceutical Research & Development LLC.; Lumosity; Lundbeck; Merck & Co., Inc.; Meso Scale Diagnostics, LLC.; NeuroRx Research; Neurotrack Technologies; Novartis Pharmaceuticals Corporation; Pfizer Inc.; Piramal Imaging; Servier; Takeda Pharmaceutical Company; and Transition Therapeutics. The Canadian Institutes of Health Research is providing funds to support ADNI clinical sites in Canada. Private sector contributions are facilitated by the Foundation for the National Institutes of Health (www.fnih.org). The grantee organization is the Northern California Institute for Research and Education, and the study is coordinated by the Alzheimer’s Therapeutic Research Institute at the University of Southern California. ADNI data are disseminated by the Laboratory for Neuro Imaging at the University of Southern California.
References
[1] Villemagne VL, Dore V, Burnham SC, Masters CL, Rowe CC. Imaging tau and amyloid-beta proteinopathies in Alzheimer disease and other conditions. Nat Rev Neurol 2018;14:225-236.
[2] Grieder M, Wang DJ, Dierks T, Wahlund L-O, Jann K. Local signal complexity and dynamic functional connectivity associated with Alzheimer’s severity. Front Neurosci 2018; 12:770.
[3] Yang AC, Huang CC, Liu ME, et al. The APOE varepsilon4 allele affects complexity and functional connectivity of resting brain activity in healthy adults. Hum Brain Mapp 2014;35:3238-3248.
[4] Wang B, Niu Y, Miao L, et al. Decreased Complexity in Alzheimer's Disease: Resting-State fMRI Evidence of Brain Entropy Mapping. Front Aging Neurosci 2017;9:378.
[5] Baker SL, Maass A, Jagust WJ. Considerations and code for partial volume correcting. Data Brief 2017; 15: 648-57. [6] Craddock RC, James GA, Holtzheimer PE, 3rd, Hu XP, Mayberg HS. A whole brain fMRI atlas generated via spatially constrained spectral clustering. Hum Brain Mapp 2012;33:1914-1928.
[7] Koo TK, Li MY. A Guideline of Selecting and Reporting Intraclass Correlation Coefficients for Reliability Research J Chiropr Med. 2016 ;15(2):155-63.
[8] Quadrianto N, Ghahramani Z. A Very Simple Safe-Bayesian Random Forest. IEEE Transactions on Pattern Analysis and Machine Intelligence; 2015: 1297-1303.
[9] Gordon BA, Blazey TM, Christensen J, et al. Tau PET in autosomal dominant Alzheimer's disease: relationship with cognition, dementia and other biomarkers. Brain 2019;142:1063-1076.
[10] McDonough IM, Nashiro K. Network complexity as a measure of information processing across resting-state networks: evidence from the Human Connectome Project. Front Hum Neurosci 2014;8:409.
[11] Wang DJ, Jann K, Fan C, et al. Neurophysiological Basis of Multi-Scale Entropy Analysis of Brain Complexity and Its Relationship with Functional Connectivity. Front Neurosci. 2018;12:352.
Figures