1465
Identifying Alzheimer's Disease Brain Atrophy Subtypes by Deep Learning1Australian eHealth Research Center, CSIRO, Brisbane, Australia, 2Australian eHealth Research Center, CSIRO, Melbourne, Australia
Synopsis
Understanding the heterogeneity in atrophy changes from Alzheimer's disease (AD) can be an important factor to develop effective drugs and improve patients' outcomes [7]. In this study, we propose a deep learning approach to identify AD subtypes based on T1w magnetic resonance images (MRI). Experimental results show that the proposed method can accurately identify four AD subtypes exhibiting a distinctive cortical atrophy pattern.
Abstract
Objective: To investigate the heterogeneity in cortical atrophy associated with Alzheimer's disease (AD) using a novel unsupervised deep learning method.Method: FreeSurfer was used to extract the cortical thickness from the baseline T1w-MPRage magnetic resonance images (MRI) of 352 subjects recruited into the Alzheimer’s Disease Neuroimaging Initiative (ADNI). A deep neural network clustering (DNC) approach is applied to identify AD subtypes based on cortical thickness.
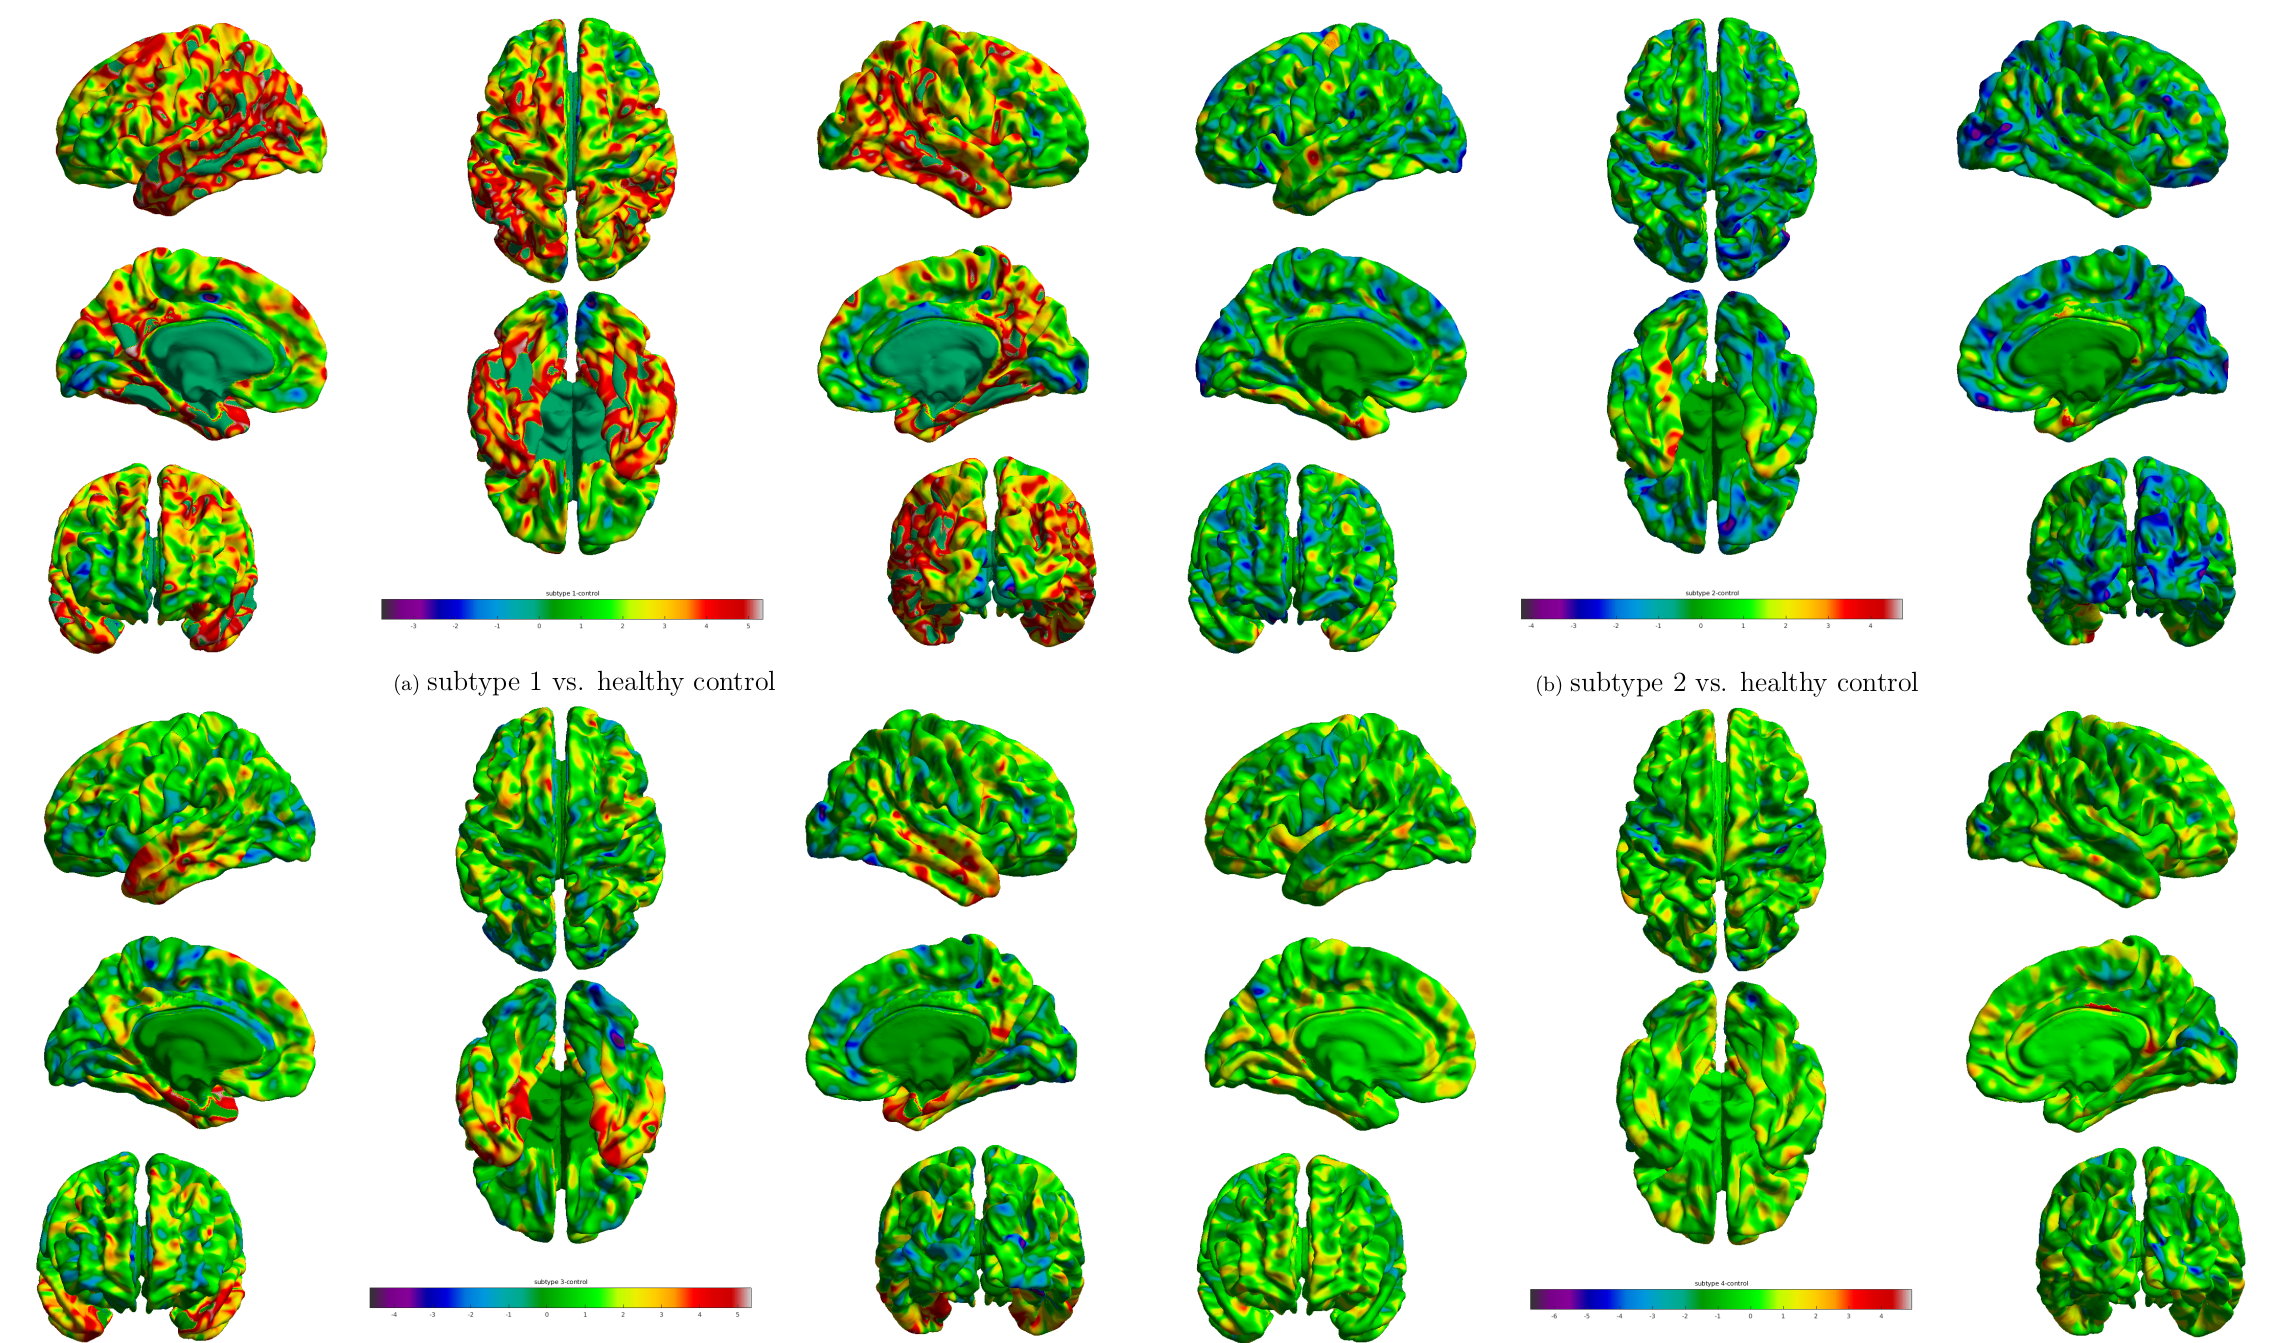
Results: We identified 4 AD subtypes based on brain atrophy patterns. Subtype 1 shows widespread diffuse pattern, mainly involving hippocampus and frontal gyrus. Subtype 2 and 3 shows similar localized patterns, mainly involving hippocapal gyrus and entorhinal cortex. Subtype 3 exhibits severe atrophy in temporal lobe. Subtype 4 shows the least atrophy, localized in lingual gyrus.
Conclusions: The proposed DNC approach can identify AD subtypes in heterogeneous AD with distinct cortical atrophy patterns.
Introduction
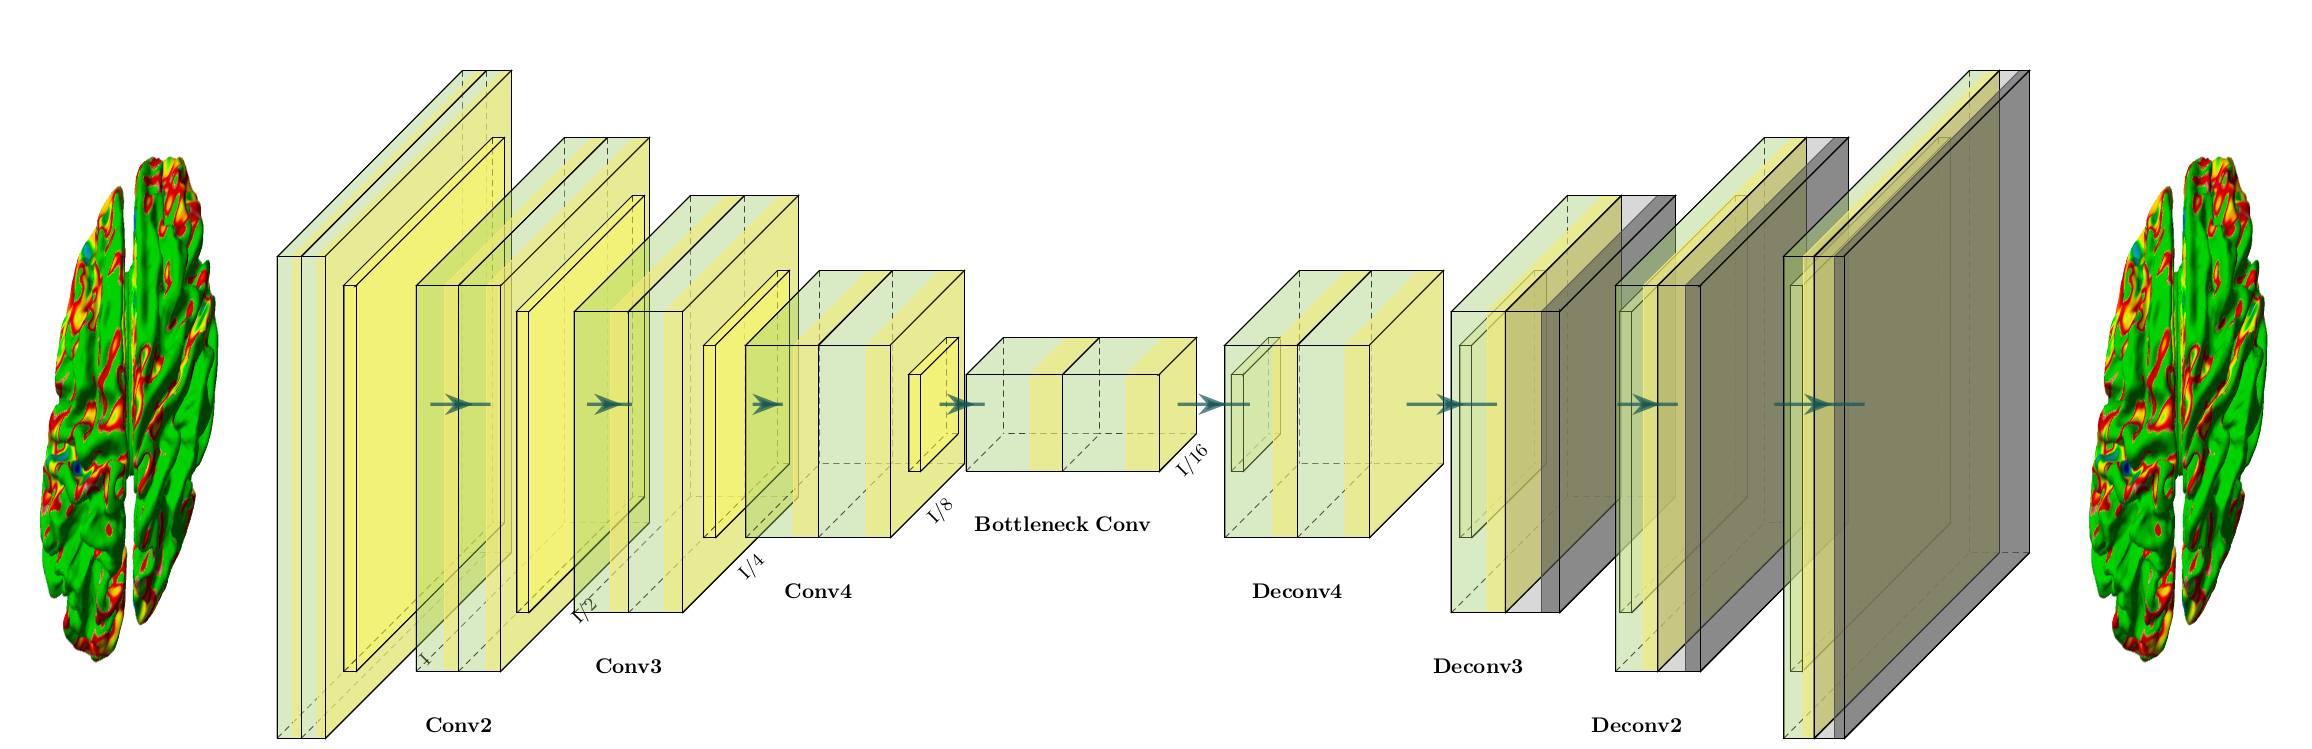
Alzheimer’s disease (AD) is a heterogeneous disease with multiple different clinical and pathological characteristics. Characterising the heterogeneous nature of AD could allow clinicians to provide more precise diagnosis and tailored treatments. Existing approaches fall into two categories. One class relies on the prior diagnosis of disease subtypes, where accurate and reliable clinical labels are difficult to acquire [8,9]. Another class puts emphasis on the voxel-based similarity between subjects, which suffers from low statistical power [5,4]. In order to tackle the aforementioned limitations, it is necessary to develop a data-driven approach that can automatically identify distinct pathological patterns and separate the samples into different groups. Therefore, we propose a data driven deep neural network clustering (DNC) approach used to identify AD subtypes based on cortical thickness (Fig.1).Methods
DataWe include 352 subjects from the ADNI dataset with baseline 3T T1w MRI scans (http://adni.loni.usc.edu/), including 216 AD and 136 amyloid-negative healthy control (HC). All MRI scans have been run through using FreeSurfer-v6 in cross-sectional processing to get cortical thickness. Details of ADNI scans processing can be found elsewhere (http://adni.loni.usc.edu/).
Proposed Model
In order to identify AD subtypes from cortical thickness, we propose a DNC method. Specifically, we choose a variational autoencoder (VAE) to transform cortical thickness data from the original data space $$$X$$$ to feature space $$$Z$$$, $$$f_{\theta}: X \rightarrow Z$$$. Then, these extracted features are fed into the k-means clustering algorithm. $$$K$$$ was chosen as 4 based on the cluster stability analysis and estimated clusters from existing methods. Dataset has been split into training/testing using 10-fold cross validation. The proposed model can cluster data by simultaneously learning a set of k cluster centers $$$\{u_j \in Z\}_{j=1}^k$$$ in the feature space $$$Z$$$ and the parameters $$$\theta$$$ of VAE that maps MRI data into feature space $$$Z$$$. Samples are grouped into different subtypes based on the best fit of their latent data on the identified clusters.
Given an initial estimate of the non-linear mapping $$$f_{\theta}$$$ and the initial cluster centroids $$$\{\mu_j\}^k_{j=1}$$$, clustering samples are performed using an unsupervised algorithm by computing a soft assignment between the sample features and the cluster centroids.
We use the student’s t-distribution as a kernel to measure the similarity between latent point $$$z_i$$$ and centroid $$$\mu_j$$$:
$$q_{i,j} = \frac{(1+ ||{z_i - \mu_j}||^2)^{-1}}{\sum_{j'}(1+ ||{z_i - \mu_j'}||^2)^{-1}}$$
where $$$z_i = f_{\theta}(x_i) \in Z$$$ corresponds to $$$x_i \in X$$$, $$$q_{i,j}$$$ can be interpreted as the probability of assigning sample $$$i$$$ into cluster $$$j$$$.
Results
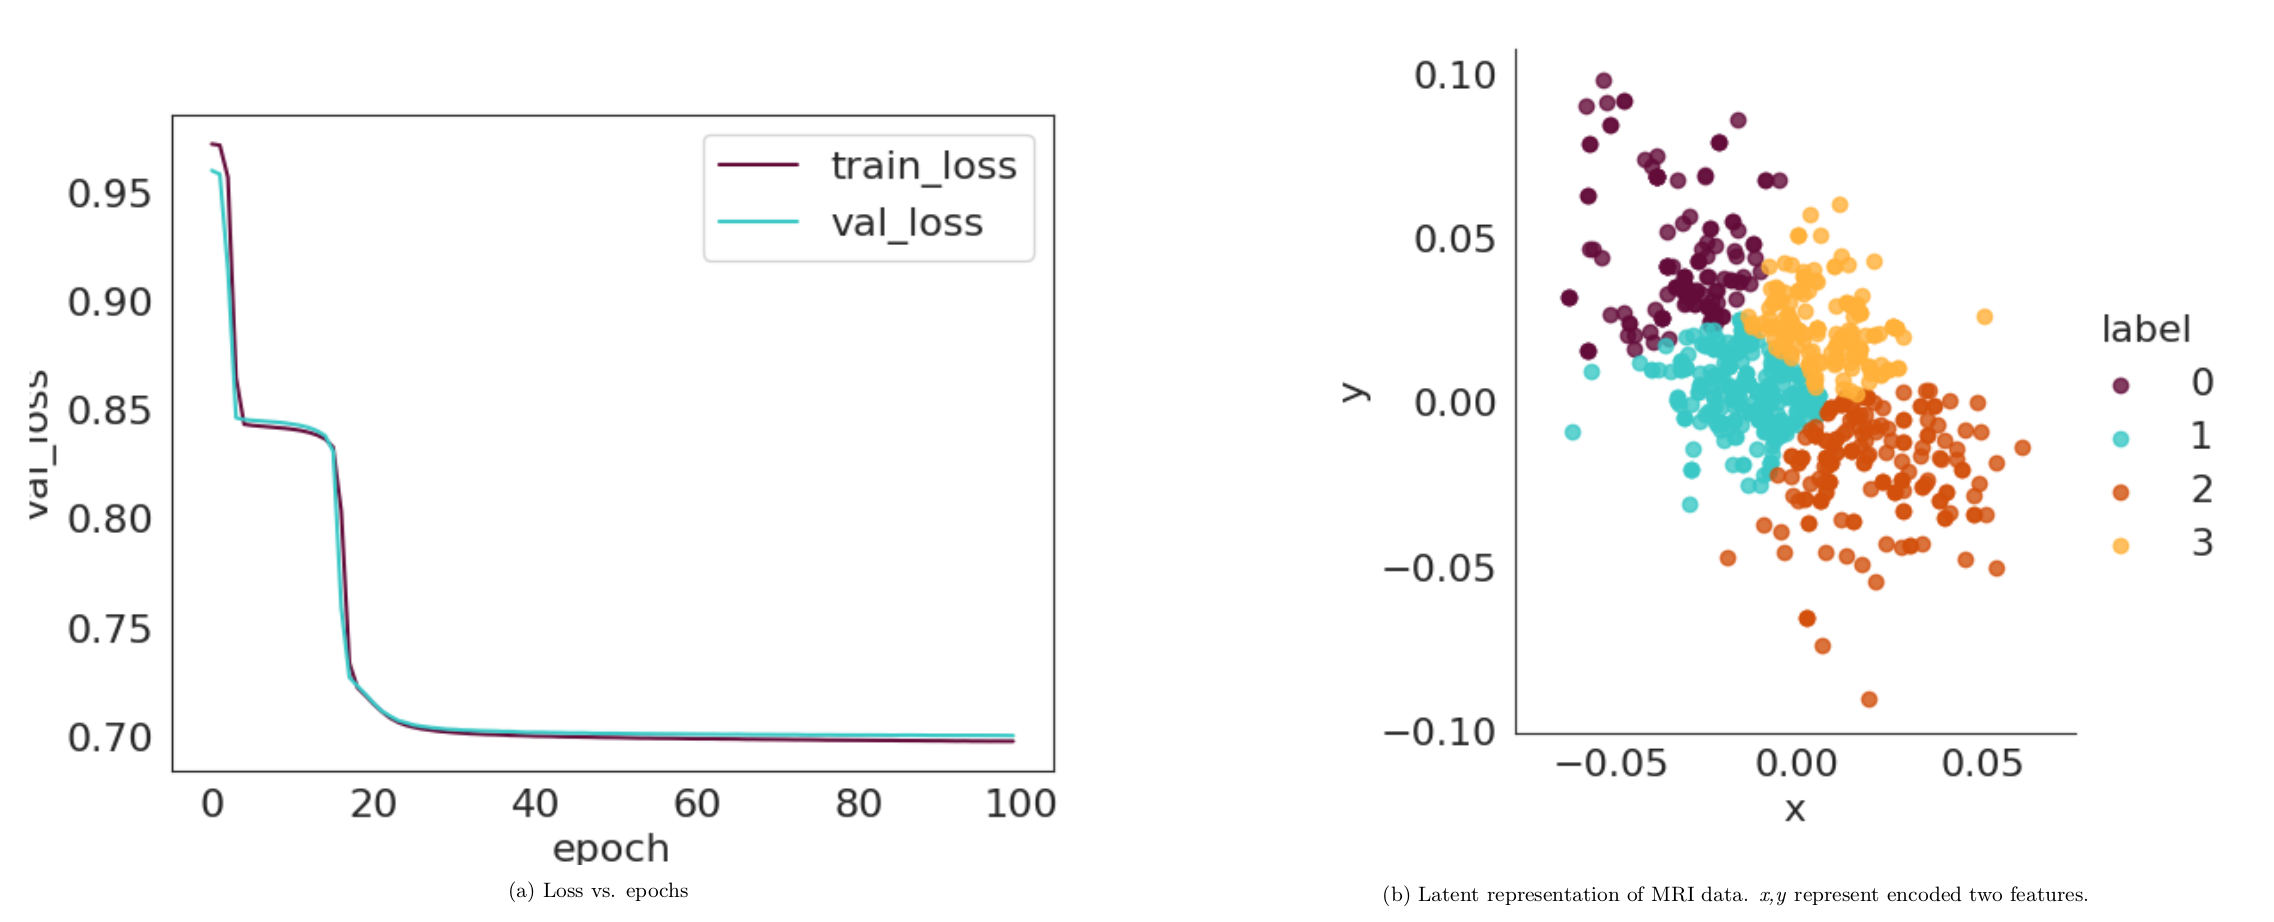
Encoded featuresWe visualise the progression of the latent representation of the test data after training. Fig. 2 (a) shows that loss reduces over stochastic gradient descent (SGD) epochs. Fig. 2 (b) shows latent features $$$z_i$$$. It is clear that the clusters are becoming increasingly well separated.
Identified Alzheimer's subtypes
Fig. 3 shows identified subtypes. The main effect of group has been tested using the linear mixed effects model within SurfStat, controlling for age (http://www.math.mcgill.ca/keith/surfstat/#F). The statistical map are presented, thresholded by p-value at level of 0.05. Subtype 1 shows widespread diffuse pattern, mainly involving hippocampus and frontal gyrus. Subtype 2 and 3 shows similar localized patterns, mainly involving hippocapal gyrus and entorhinal cortex. Subtype 3 exhibits severe atrophy in temporal lobe. Subtype 4 shows the least atrophy, localized in lingual gyrus.
Comparison with other methods
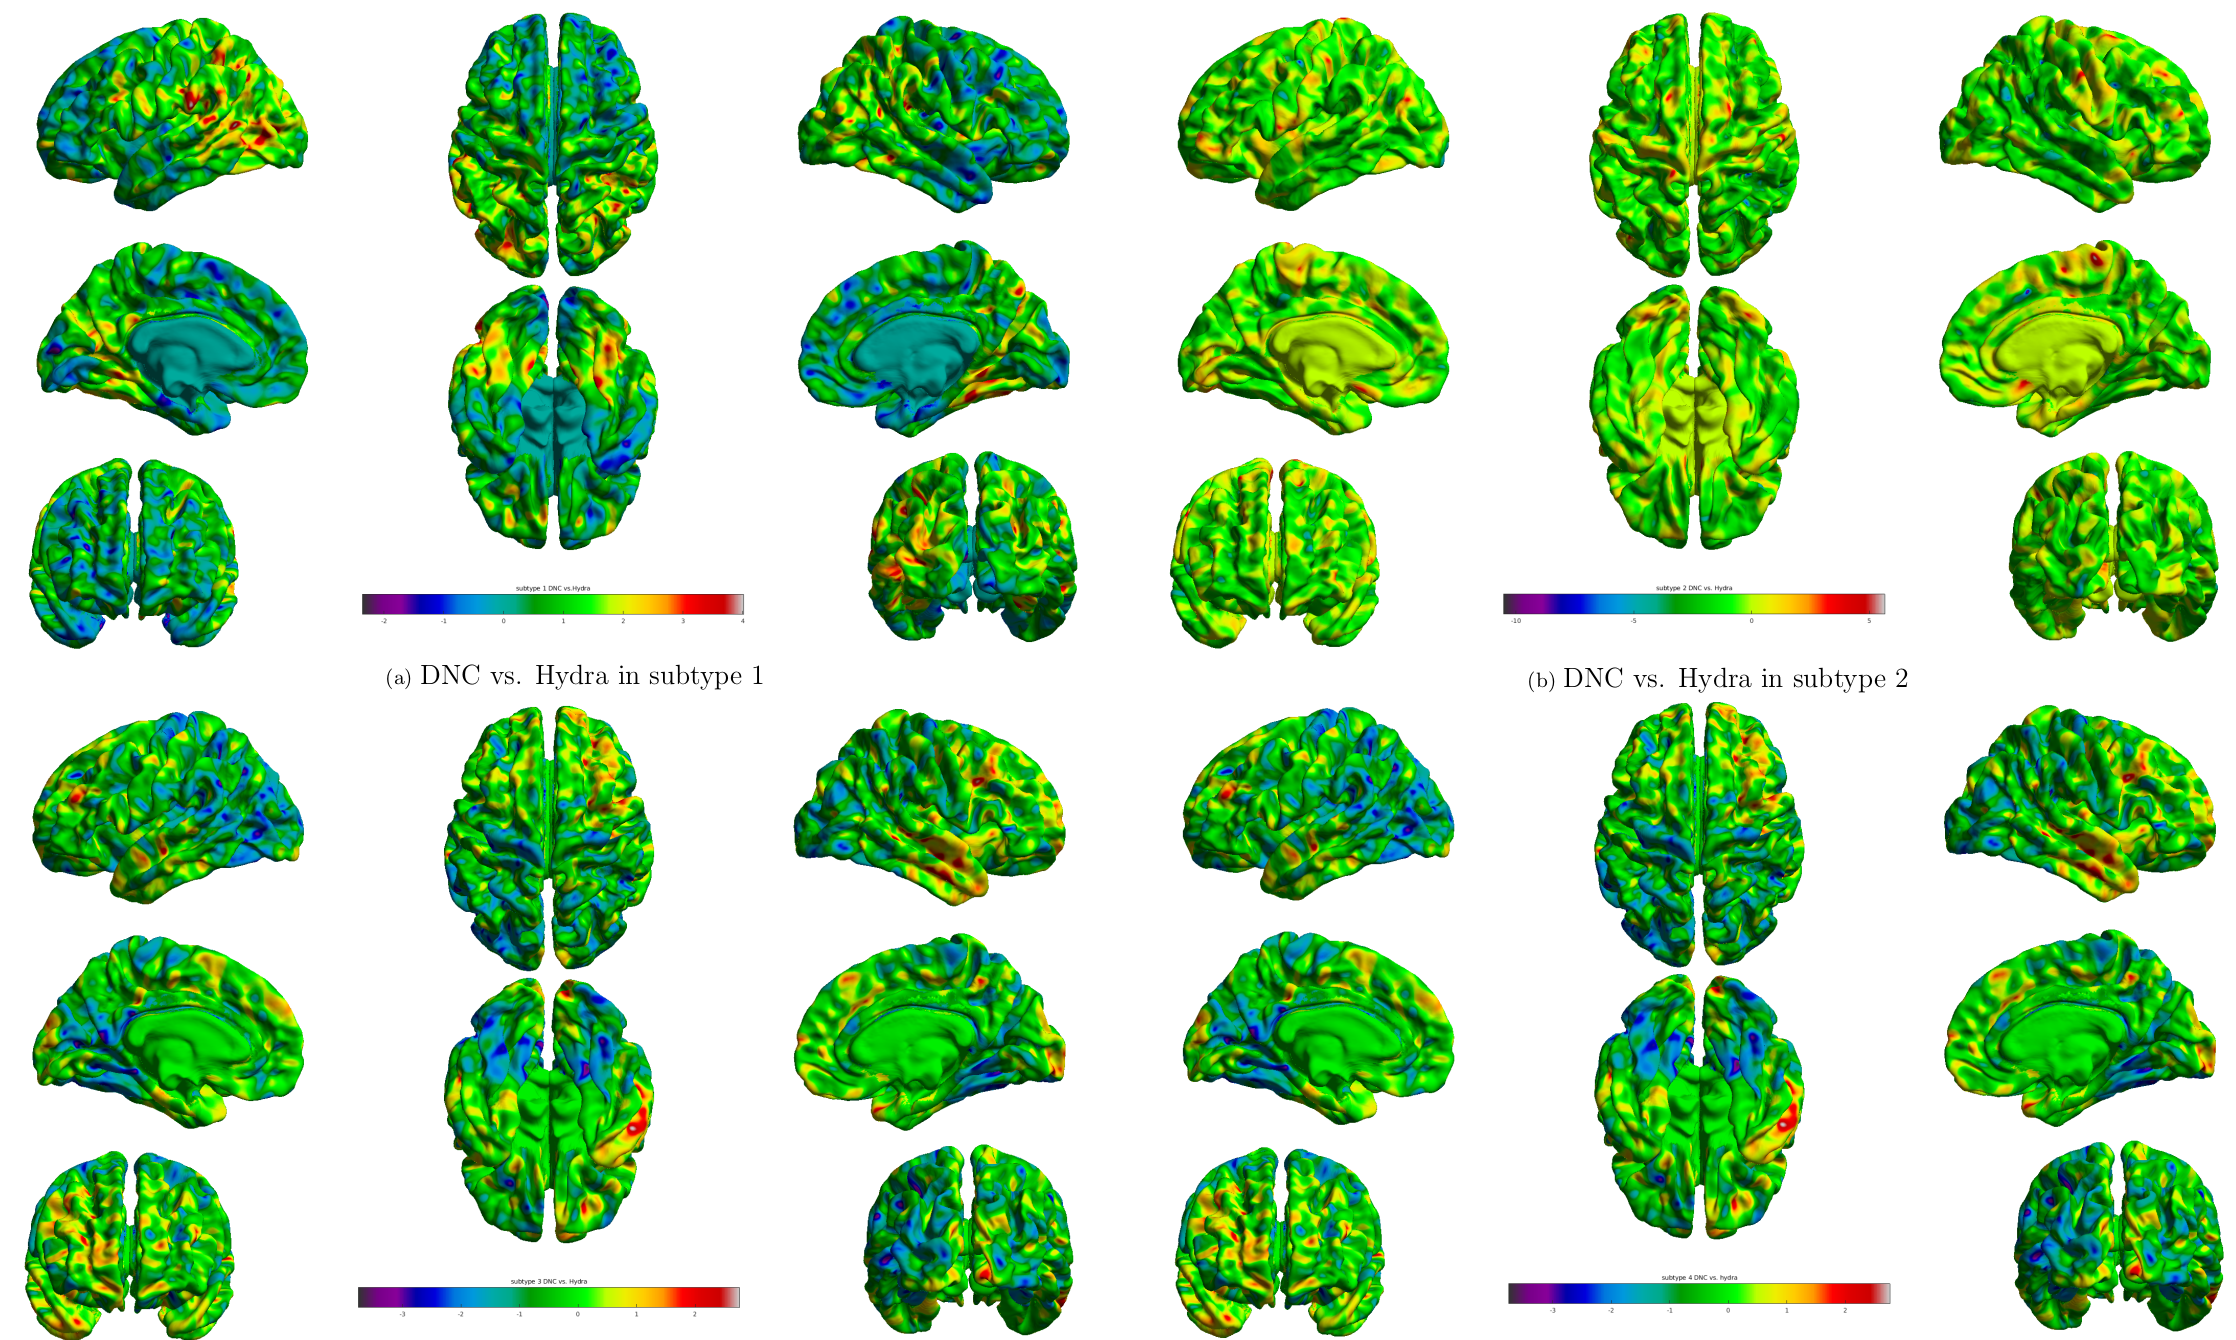
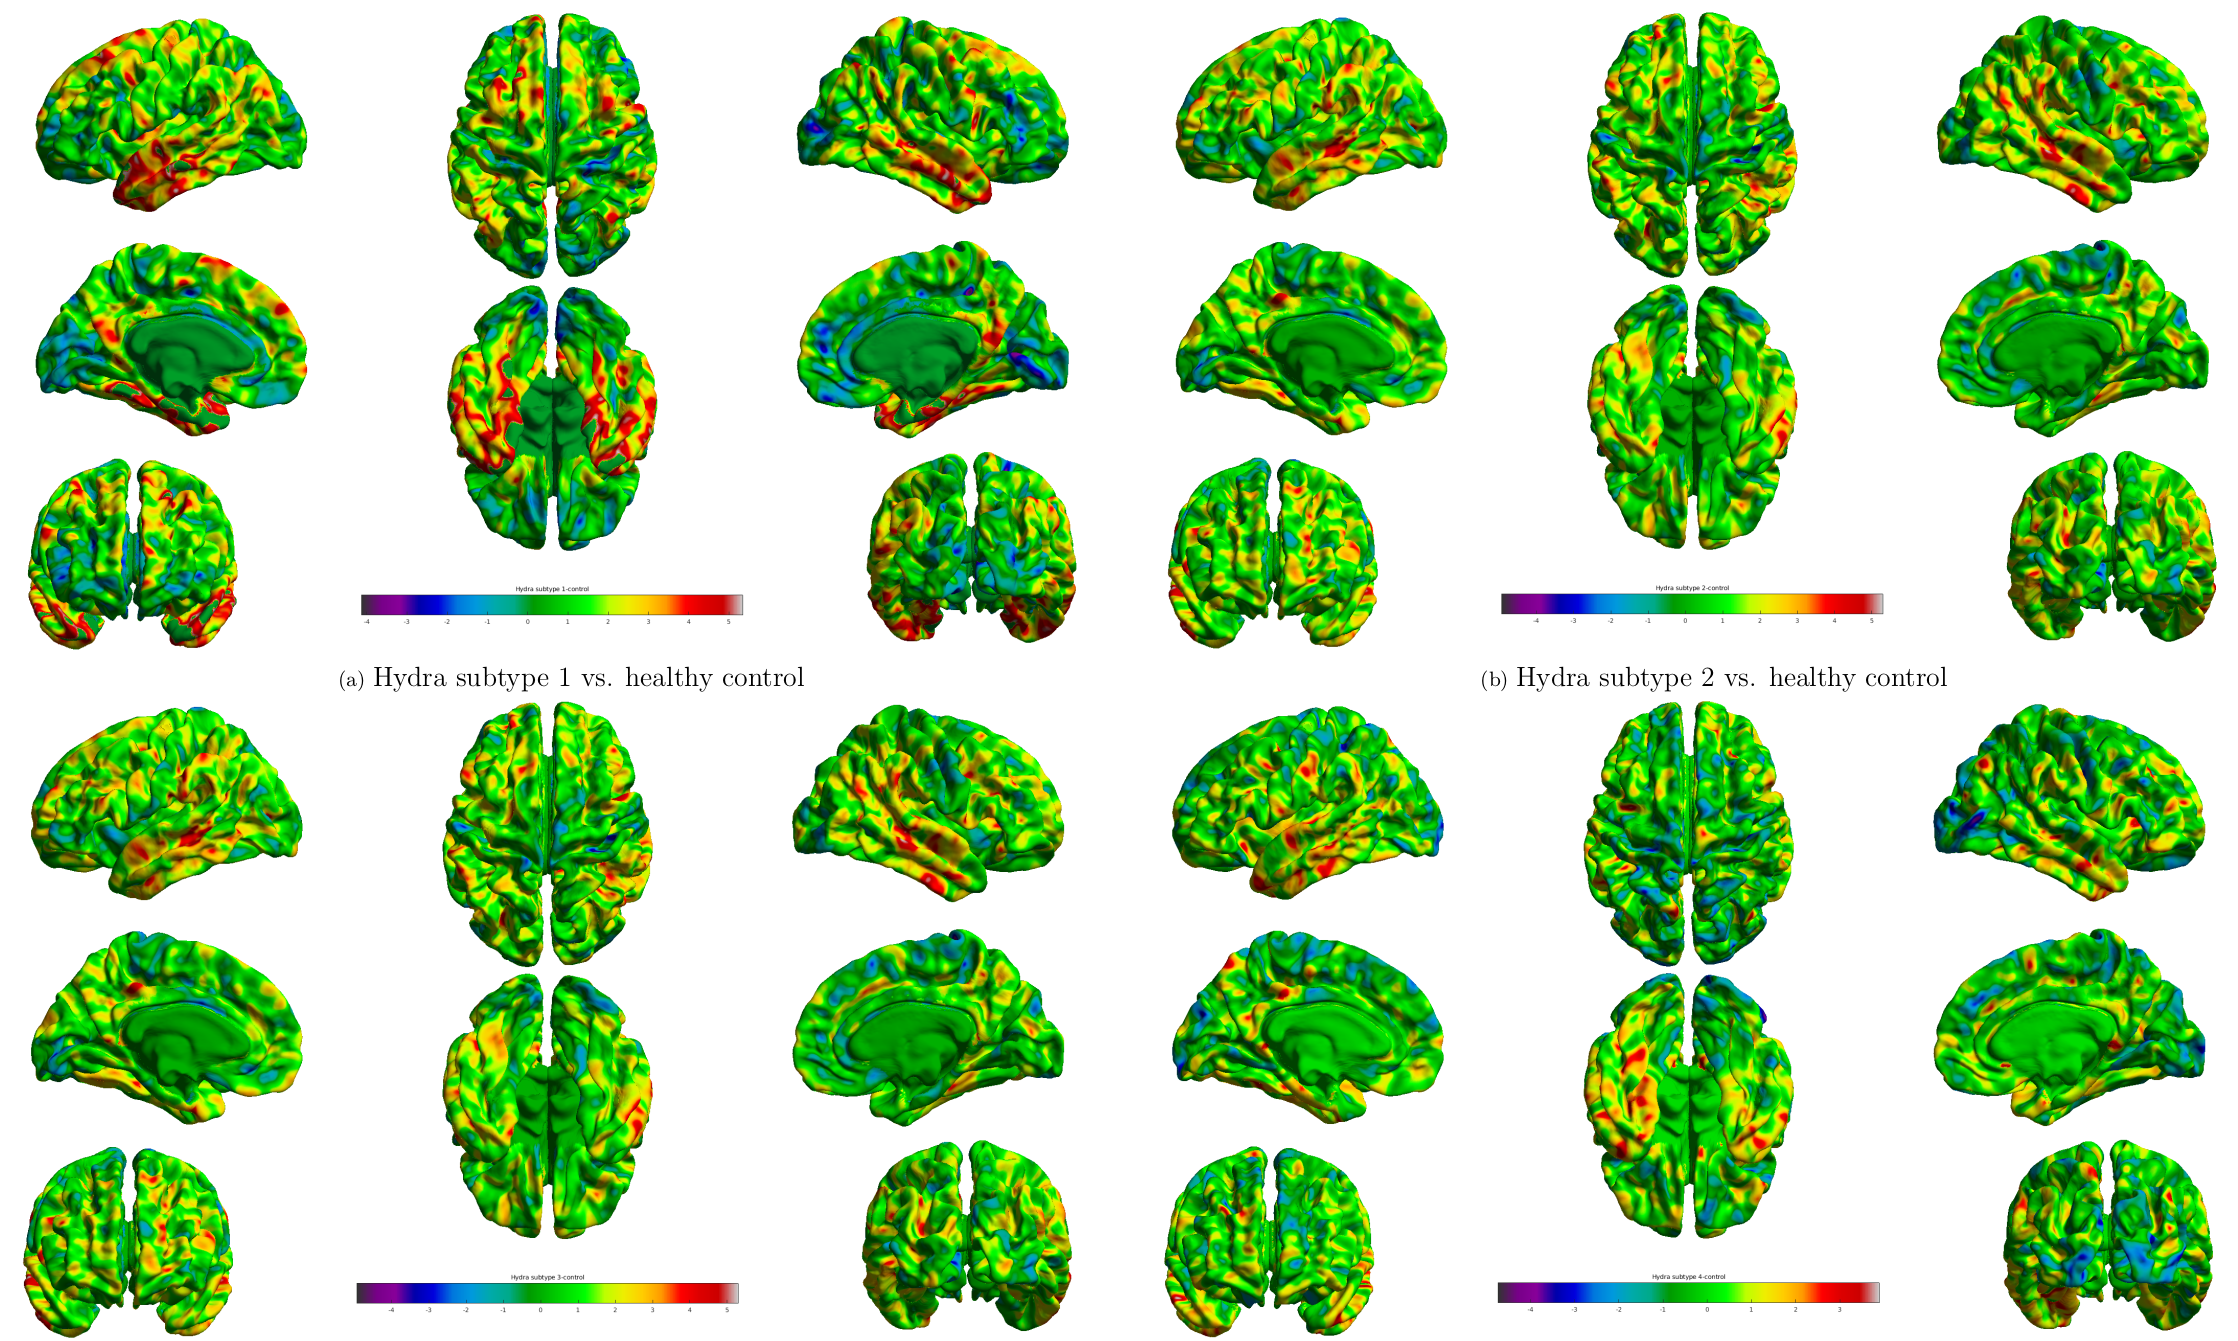
We compare our method with the Hydra [2,6] using same samples (Fig. 4 and Fig. 5). As shown in Fig. 4, we observe localized difference in subtypes identified by these two methods, especially in occipital lobe, inferior parietal cortex. As a reference, we plot subtypes detected by Hydra in Fig. 5. Although subtypes from two methods show different atrophy scale, the overall patterns are quite similar to each other.
Discussion and Conclusion
In this paper, we propose an unsupervised DNC to detect AD subtypes using cortical thickness measured by MRI. The proposed method successfully identify clinically distinct anatomical subtypes. Compared to other approaches, our approach can jointly identify distinct features for each sample and cluster the samples into different subtypes without any prior information. However, it remains to be determined in future studies whether this subtyping approach can be applied at earlier stages. In future, this study will contribute and be used to aid the earlier identification of AD subtypes in asymptomatic individuals.Acknowledgements
No acknowledgement found.References
[1] Risacher, Shannon L., et al. Alzheimer disease brain atrophy subtypes are associated with cognition and rate of decline. Neurology 89(21): 2176-2186,2017.
[2] Varol, Erdem, et al. HYDRA: Revealing heterogeneity of imaging and genetic patterns through a multiple max-margin discriminative analysis framework. Neuroimage 145: 346-364, 2017.
[3] Dong, Aoyan, et al. CHIMERA: clustering of heterogeneous disease effects via distribution matching of imaging patterns. IEEE transactions on medical imaging 35(2): 612-621, 2015.
[4] Park, Jong-Yun, et al. Robust identification of Alzheimer's disease subtypes based on cortical atrophy patterns. Scientific reports 7: 43270, 2017.
[5] ten Kate, Mara, et al. Atrophy subtypes in prodromal Alzheimer's disease are associated with cognitive decline. Brain 141(12): 3443-3456, 2018.
[6] Dong, Aoyan, et al. Heterogeneity of neuroanatomical patterns in prodromal Alzheimer's disease: links to cognition, progression and biomarkers. Brain140(3): 735-747, 2016.
[7] Devi, Gayatri, and Philip Scheltens. Heterogeneity of Alzheimer's disease:consequence for drug trials?. Alzheimer’s research & therapy 10(1): 122,2018.
[8] Ferreira, Daniel, et al. Distinct subtypes of Alzheimer's disease based on patterns of brain atrophy: longitudinal trajectories and clinical applications. Scientific reports 7: 46263, 2017.
[9] Whitwell, Jennifer L., et al. Neuroimaging correlates of pathologically defined subtypes of Alzheimer’s disease: a case-control study. The Lancet Neurology11(10): 868-877, 2012.
Figures