1463
Functional connectivity of white matter as a biomarker of cognitive decline in Alzheimer’s disease1Vanderbilt University Institute of Imaging Science, Vanderbilt University Medical Center, Nashville, TN, United States, 2Biomedical Engineering, Vanderbilt University, Nashville, TN, United States, 3Radiology and Radiological Sciences, Vanderbilt University Medical Center, Nashville, TN, United States, 4Electrical Engineering and Computer Science, Vanderbilt University, Nashville, TN, United States
Synopsis
Pathological alterations of white matter (WM) have been reported during the development of Alzheimer’s disease (AD). This study extended our previous rsfMRI analyses of WM tract BOLD correlations to evaluate WM functional connectivity (FC) in 383 subjects at different stages of cognitive impairment and found that WM FCs 1) decline regionally in late AD groups relative to a control group, 2) are related to cognitive behavioral scores, and 3) are well-performing features for distinguishing AD patients from controls. These findings suggest the potential of WM FC, which has been overlooked, as a novel neuroimaging biomarker to assess AD progression.
Introduction
Alzheimer’s disease (AD) is a progressive neurodegenerative disorder. Pathological alterations of white matter (WM) post mortem have been reported not only in late stages of AD1-3, but also in pre-clinical stages4. Potentially, therefore, appropriate measures of changes within WM in vivo may be valuable biomarkers of neurodegeneration in AD.Methods
3T rsfMRI/T1w images and neuropsychological scores were obtained from the ADNI database, including 383 participants from six groups: cognitive normal (CN, n=136), significant memory concerns (SMC, n=46), early mild cognitive impairments (EMCI, n=83), mild cognitive impairments (MCI, n=37), late MCI (LMCI, n=46) and AD dementia (ADD, n=35)5.MRI preprocessing
FMRI preprocessing included correcting for slice timing and head motion, regressing-out motion6 and CSF signal, filtering (passband=0.0-0.1Hz), co-registering to the MNI space7, detrending, and normalizing time-courses. T1w preprocessing included segmenting WM, GM, and CSF8 and registering them to the MNI space.
Calculation of the Functional Correlation Matrix (FCM)
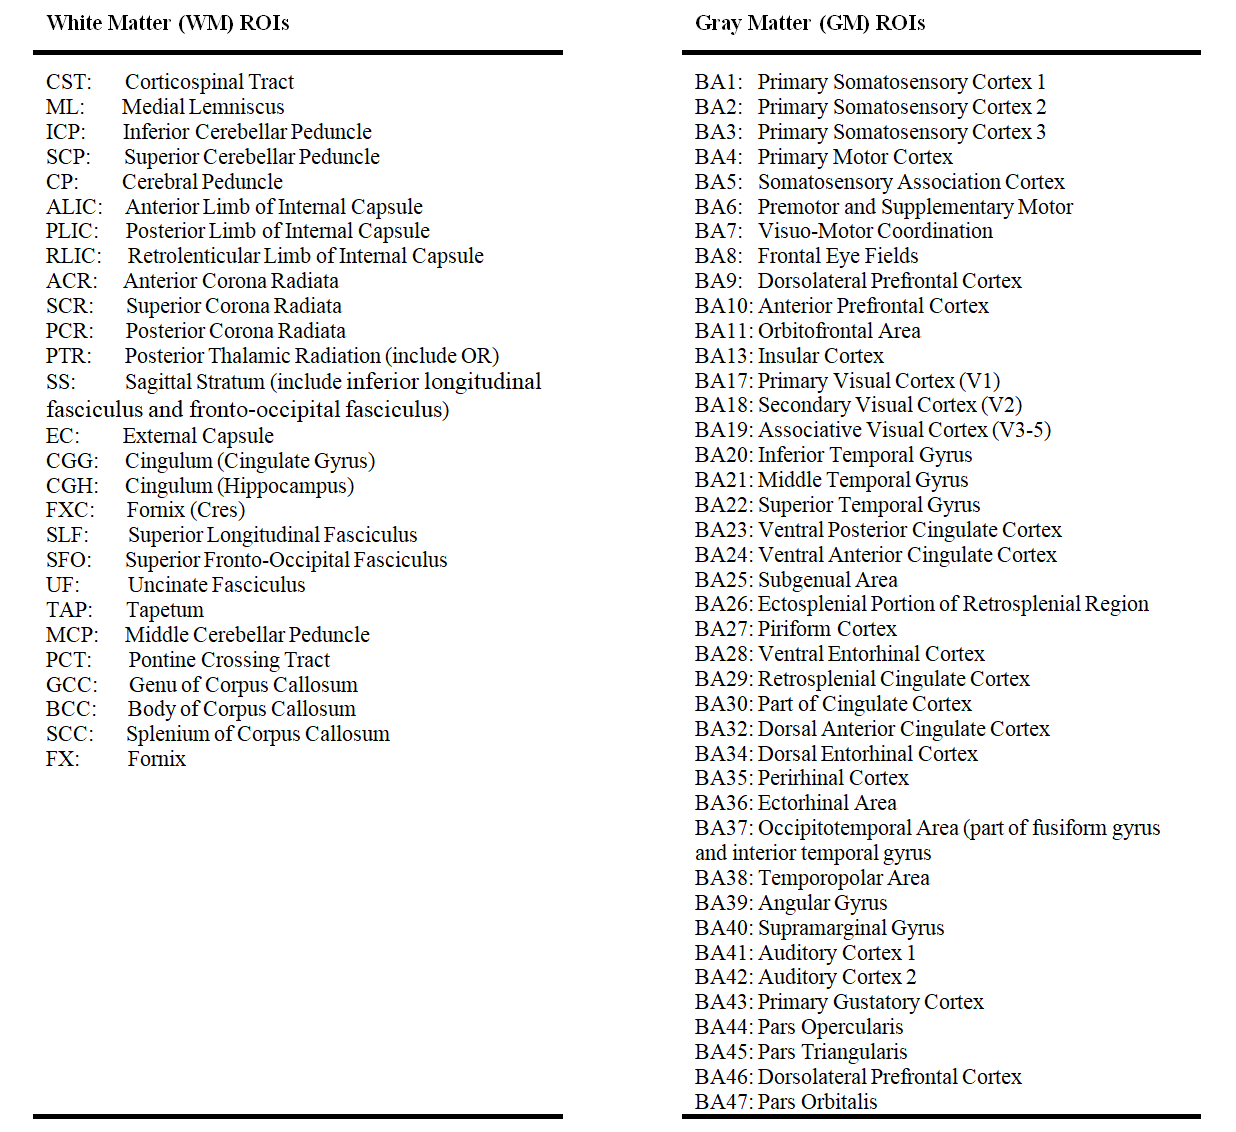
48 WM and 82 GM regions were defined by two atlases9,10 and constrained within conservative tissue masks. For each WM-GM pair, the mean time-courses were cross correlated. The resulting correlation coefficients of all pairs formed a matrix, FCMWG. Similarly, the mean time-courses for each WM-WM pair were cross correlated and all coefficients formed a FCMWW. The possible influences of age, gender, years of education and acquisition-site were regressed out from the FCMs.
Neuropsychological Scores
Neuropsychological scores included scores on the mini-mental state examination (MMSE), clinical dementia rating (CDR) global, CDR sum of boxes (CDR-SOB), global deterioration scale (GDS), functional assessment questionnaire (FAQ) total, Wechsler memory scale-logical memory II subscale (WMS-LMII), and AD assessment scale-cognitive (ADAS-Cog) metrics.
Statistical Analysis
Differences in the group mean FCMs (mFCM) and their effect sizes11 between groups were calculated. Permutation tests (N=10,000) were conducted for each FC value. The resulting P-values were corrected using a false discovery rate12, PFDR. To estimate the overall connectivity of each WM tract, the FCs corresponding to each WM region were averaged. The WM-tract-wise FCs between groups were compared using t-tests.
The associations between each single FCM element and each neuropsychological score were evaluated by calculating linear correlation coefficients between them across all participants.
To further evaluate the associations between combined FCM elements and each neuropsychological score, a random forest (RF) regression model was trained to predict the score after feature selection from all FCM elements. R2 was calculated based on true and predicted scores.
Machine Learning Classification
A support vector machine (SVM) was also implemented to classify the CN group and different combinations of groups of impaired subjects. We used all FCM elements as initial features and implemented an RF algorithm to select optimal features13. A 10-fold cross-validation (CV) and receiver operating characteristic (ROC) analyses were conducted.
Results and Discussion
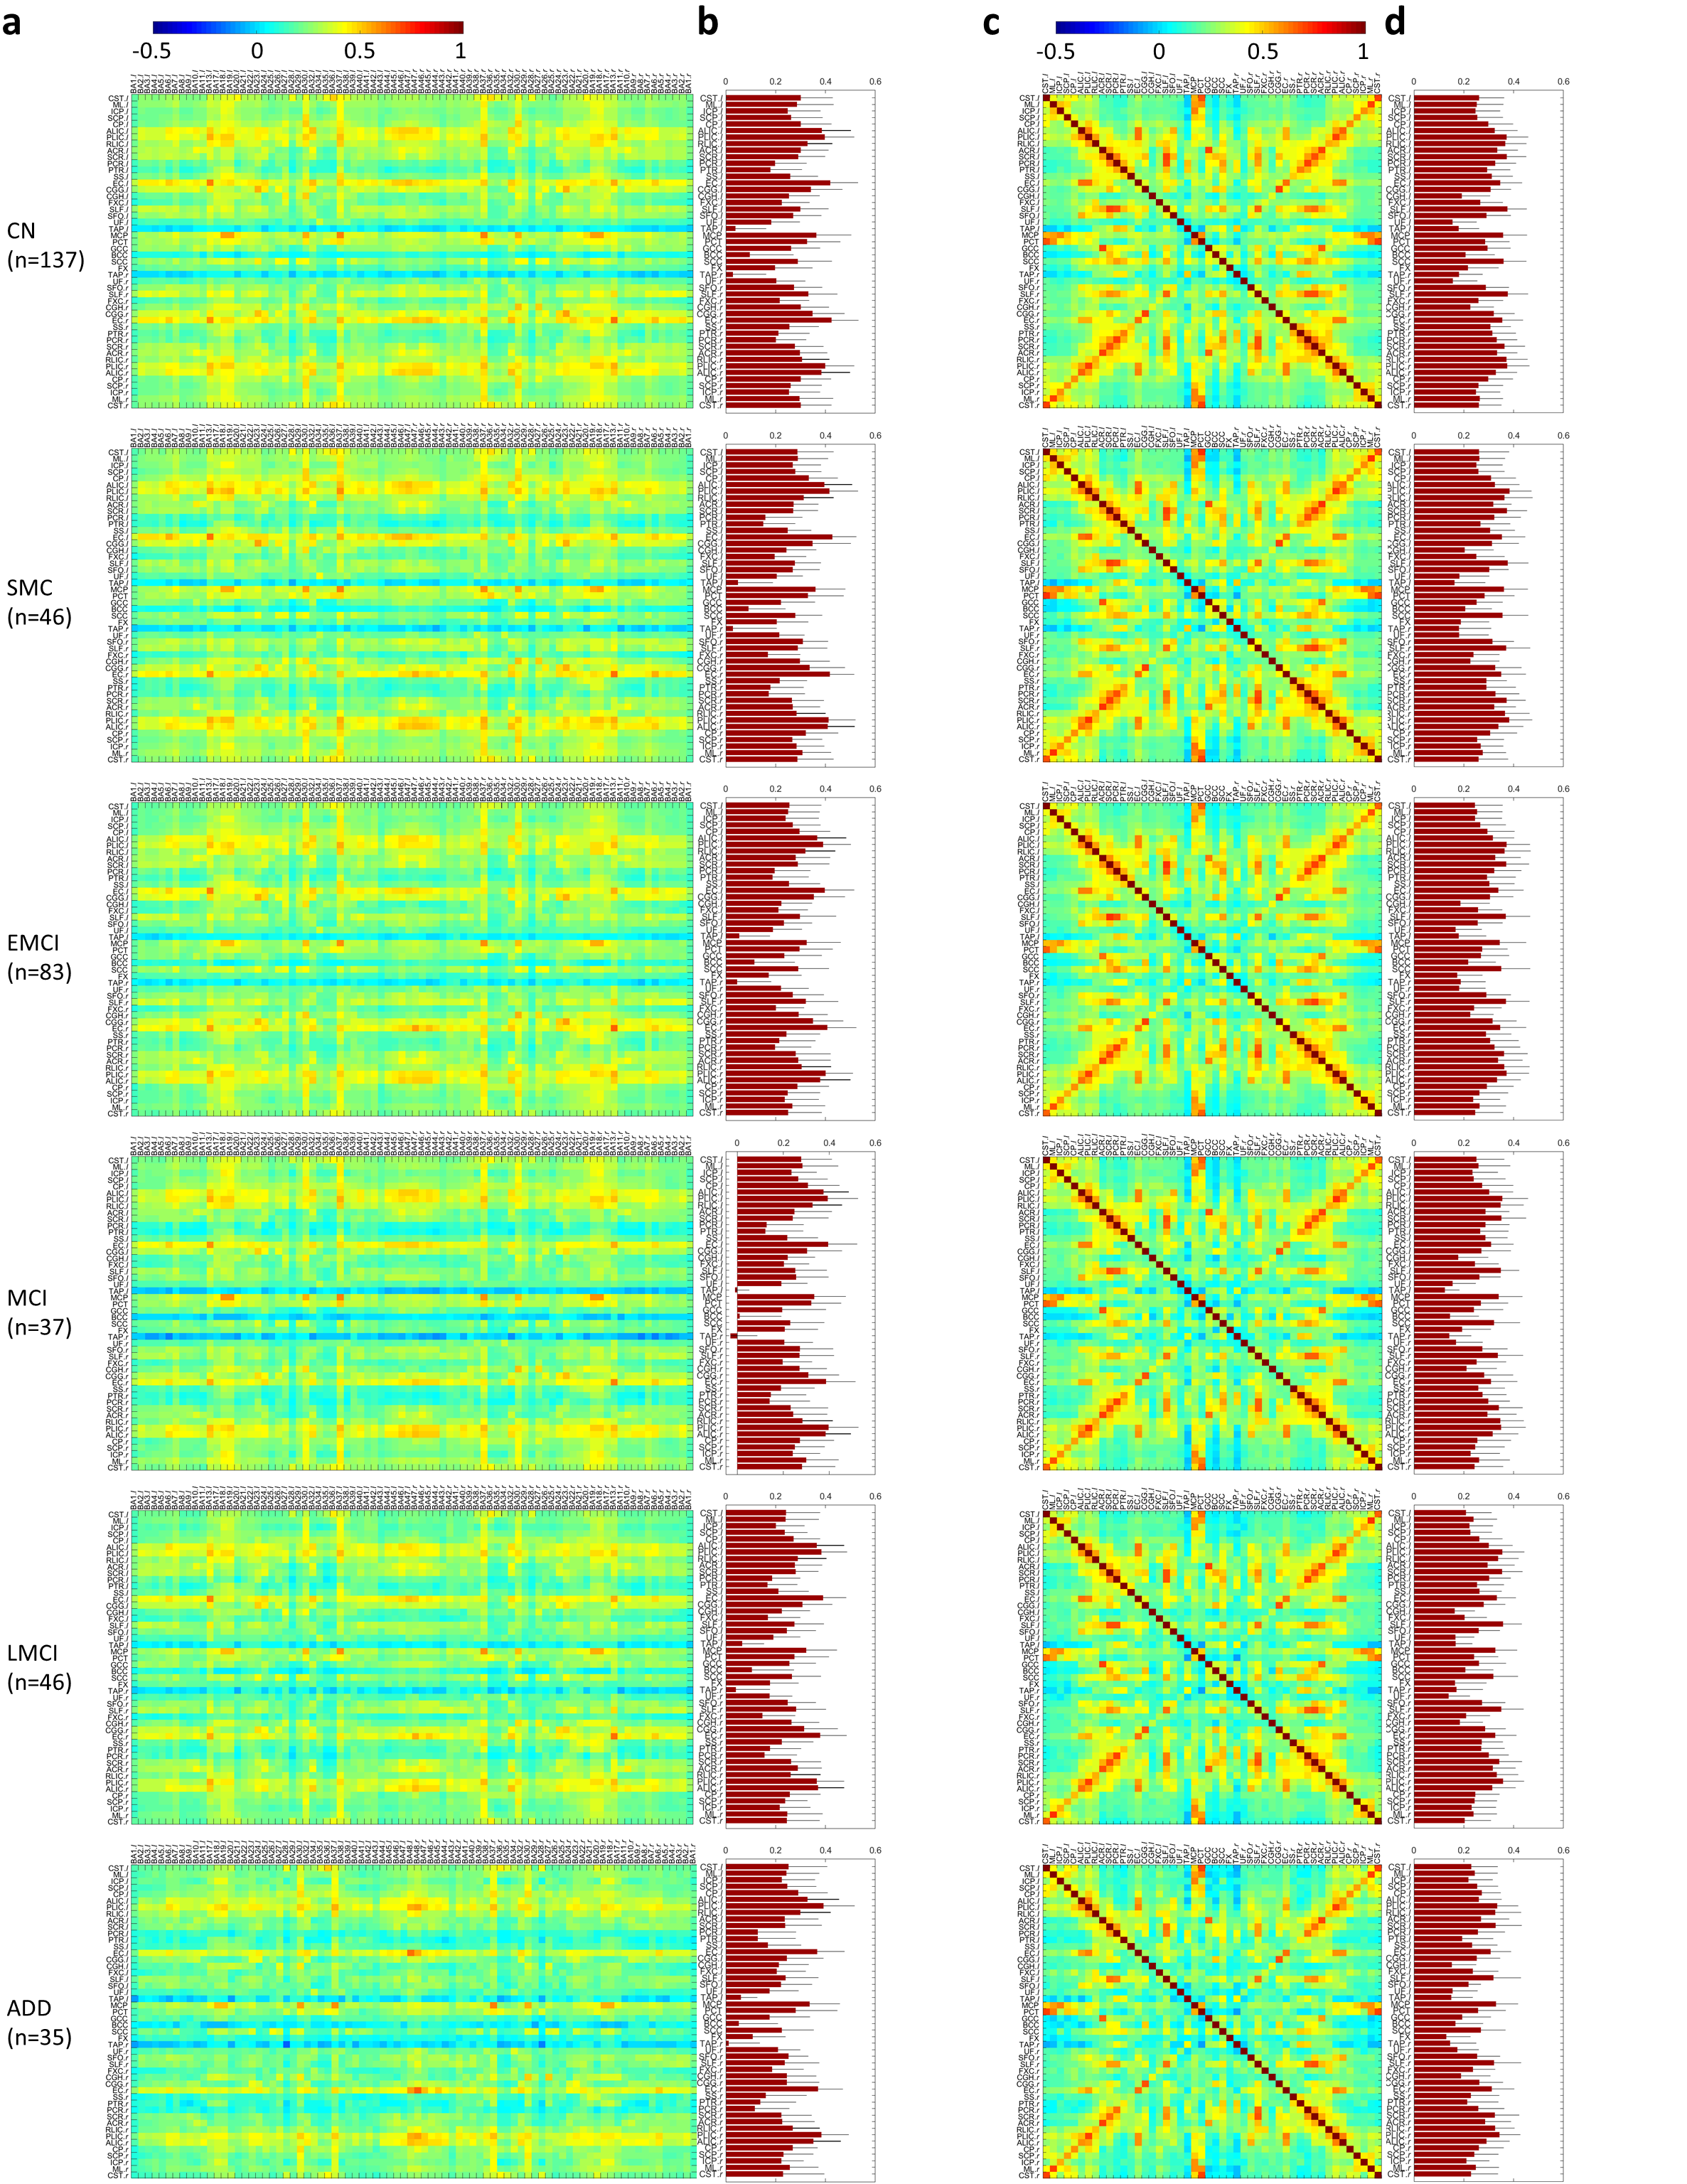
WM functional connectivity at baselineFigure 1ac shows the group mean FCMWG (mFCMWG) and mean FCMWW (mFCMWW), whose overall patterns appear similar across the six groups.
WM functional connectivity deficits in progression to AD
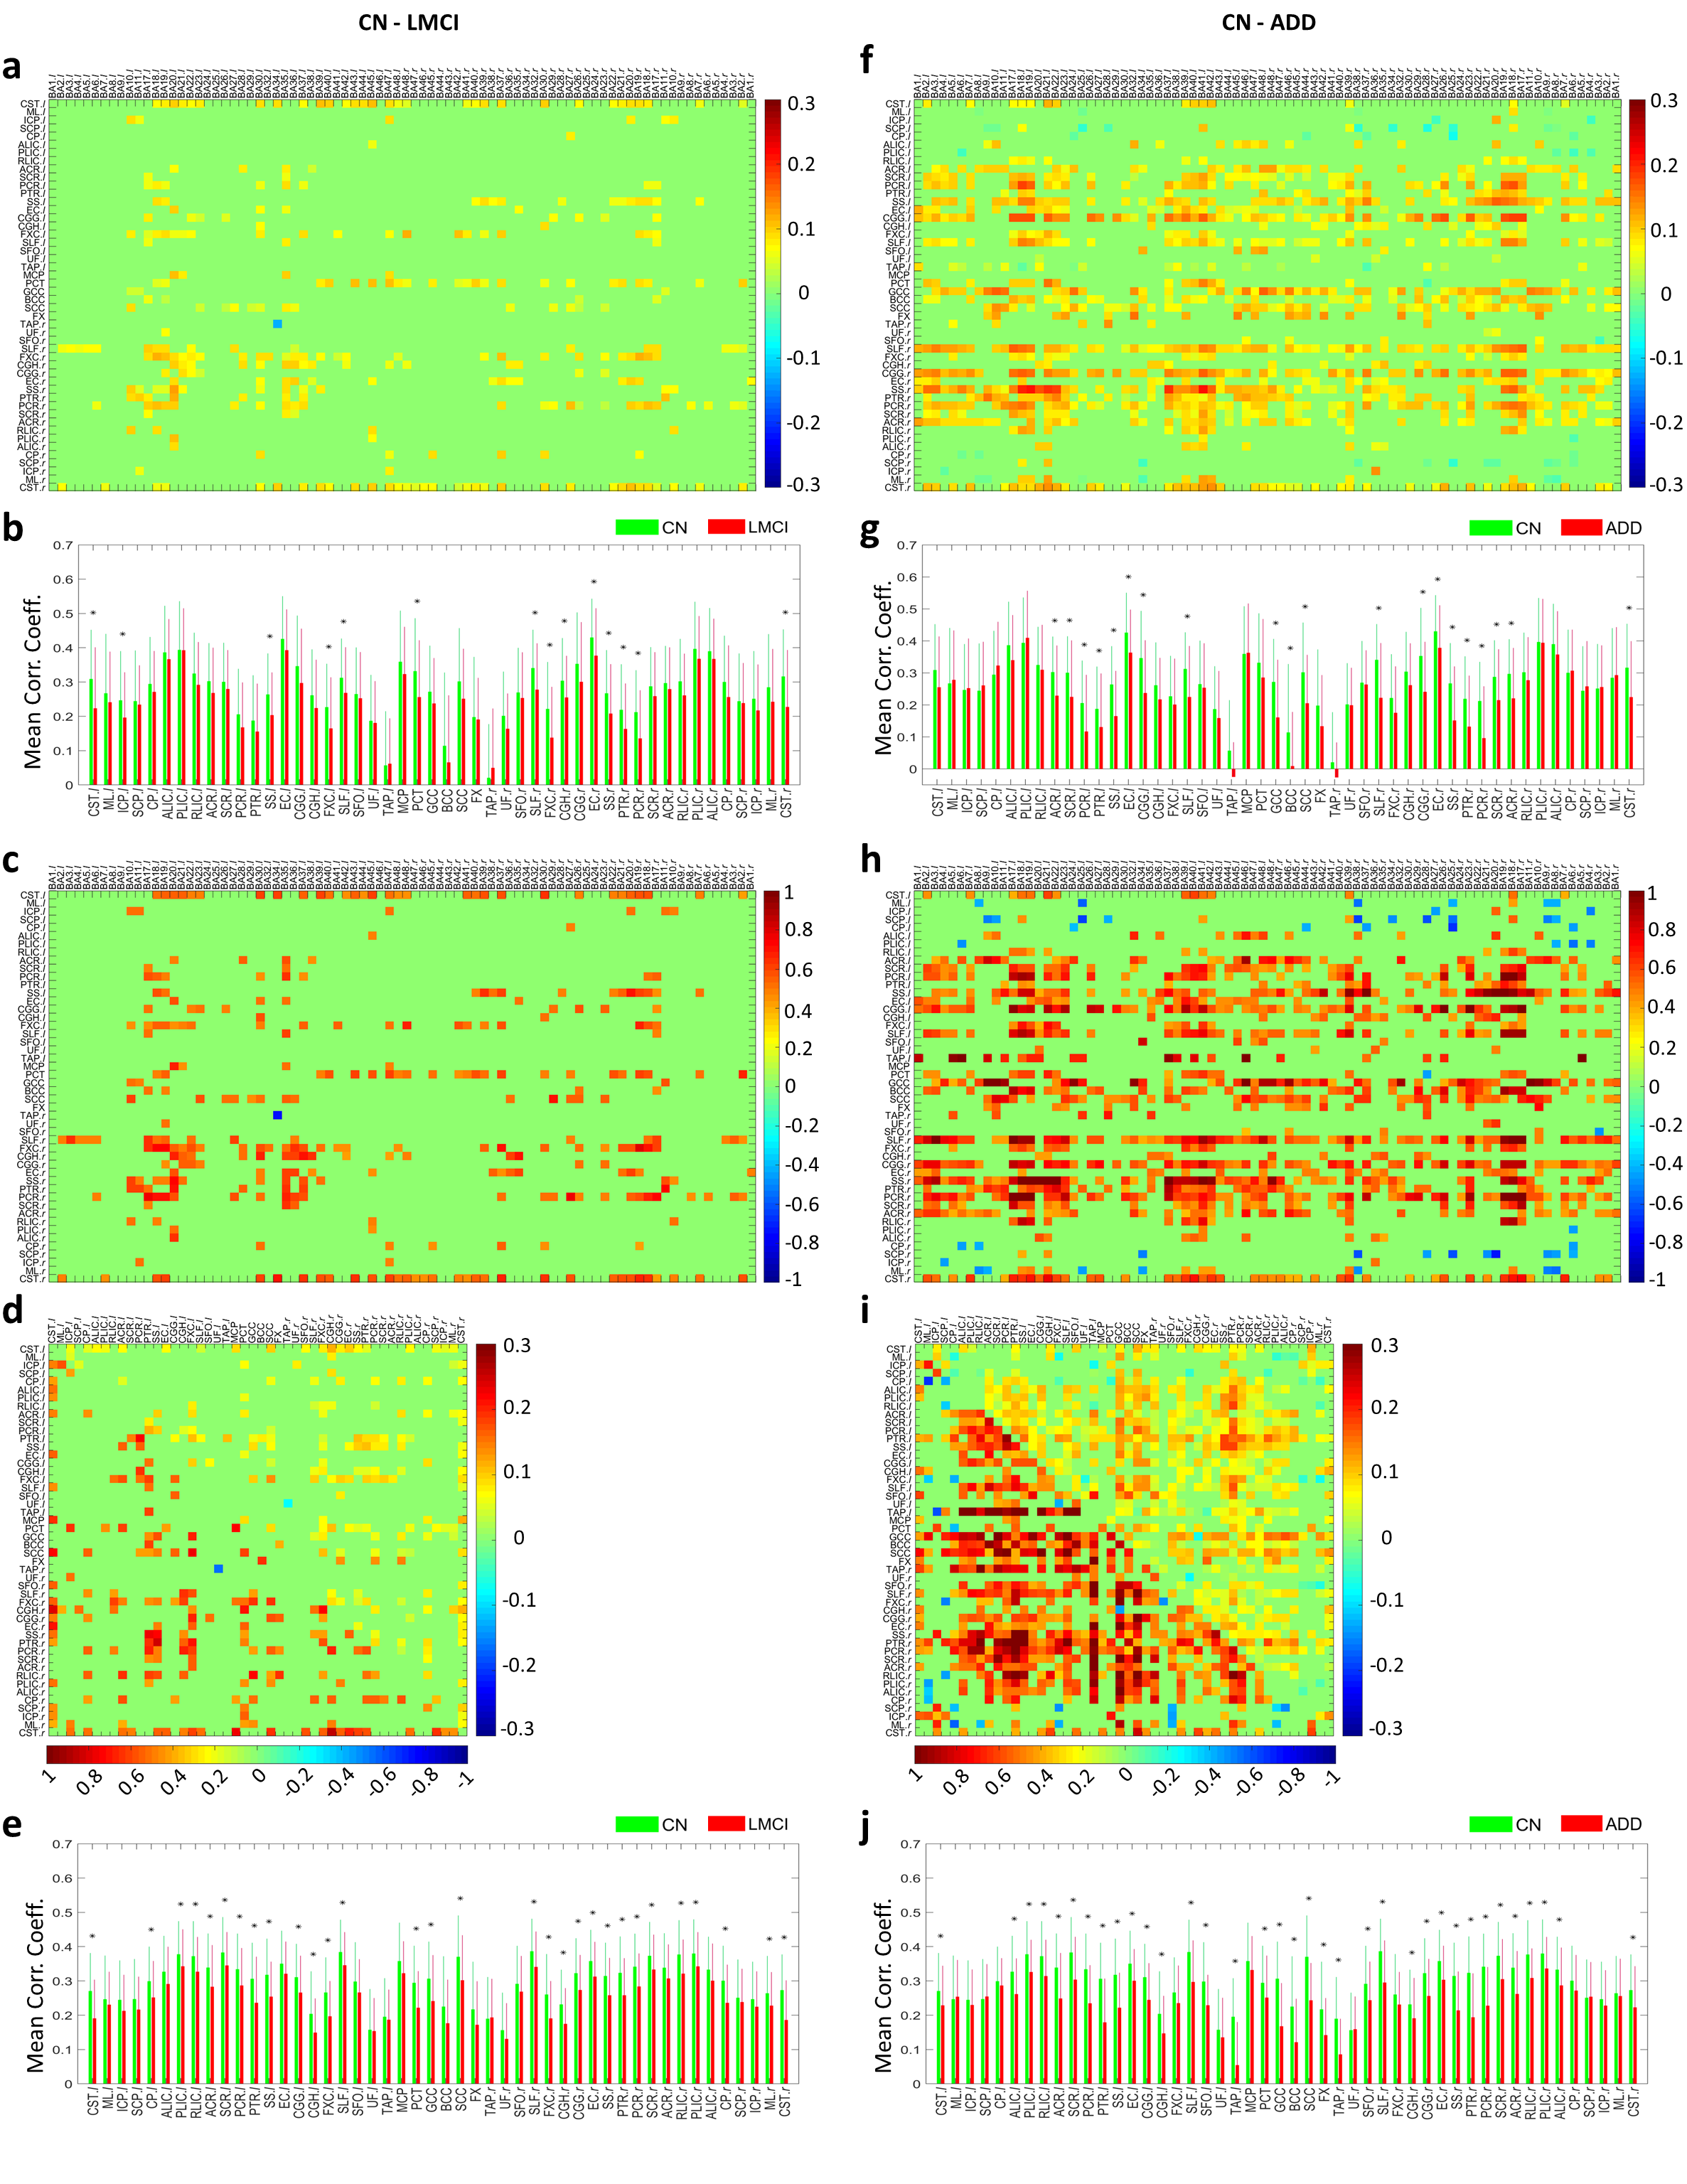
In LMCI or ADD patients, FCs significantly decrease in a number of WM-GM pairs (Figure 2a, f) and WM-WM pairs (upper triangle in Figure 2d, i) compared with CN participants (PFDR<.05). The CC, SLFlr, CGGlr, SSlr, PTRlr and CRlr profoundly decline in WM-GM FC in the ADD group (Figure 2g). The SSlr, FXClr, SLFlr, CGHr, ECr, PTRr and PCRr significantly decrease in the LMCI group (Figure 2b). The CC, SLFlr, CGHlr, CGGlr, ECr, SSlr, PTRlr, PCRlr, SCRlr, ACRl, RLIClr and PLIClr significantly decline in inter-tract FC in both the LMCI and ADD groups (Figure 2e, j). Moreover, the effect sizes of group deficits with PFDR<.05 were mostly larger than 0.3 (Figure 2c, h and lower triangle in Figure 2d, i).
Correlation between WM functional connectivity and neuropsychological scores
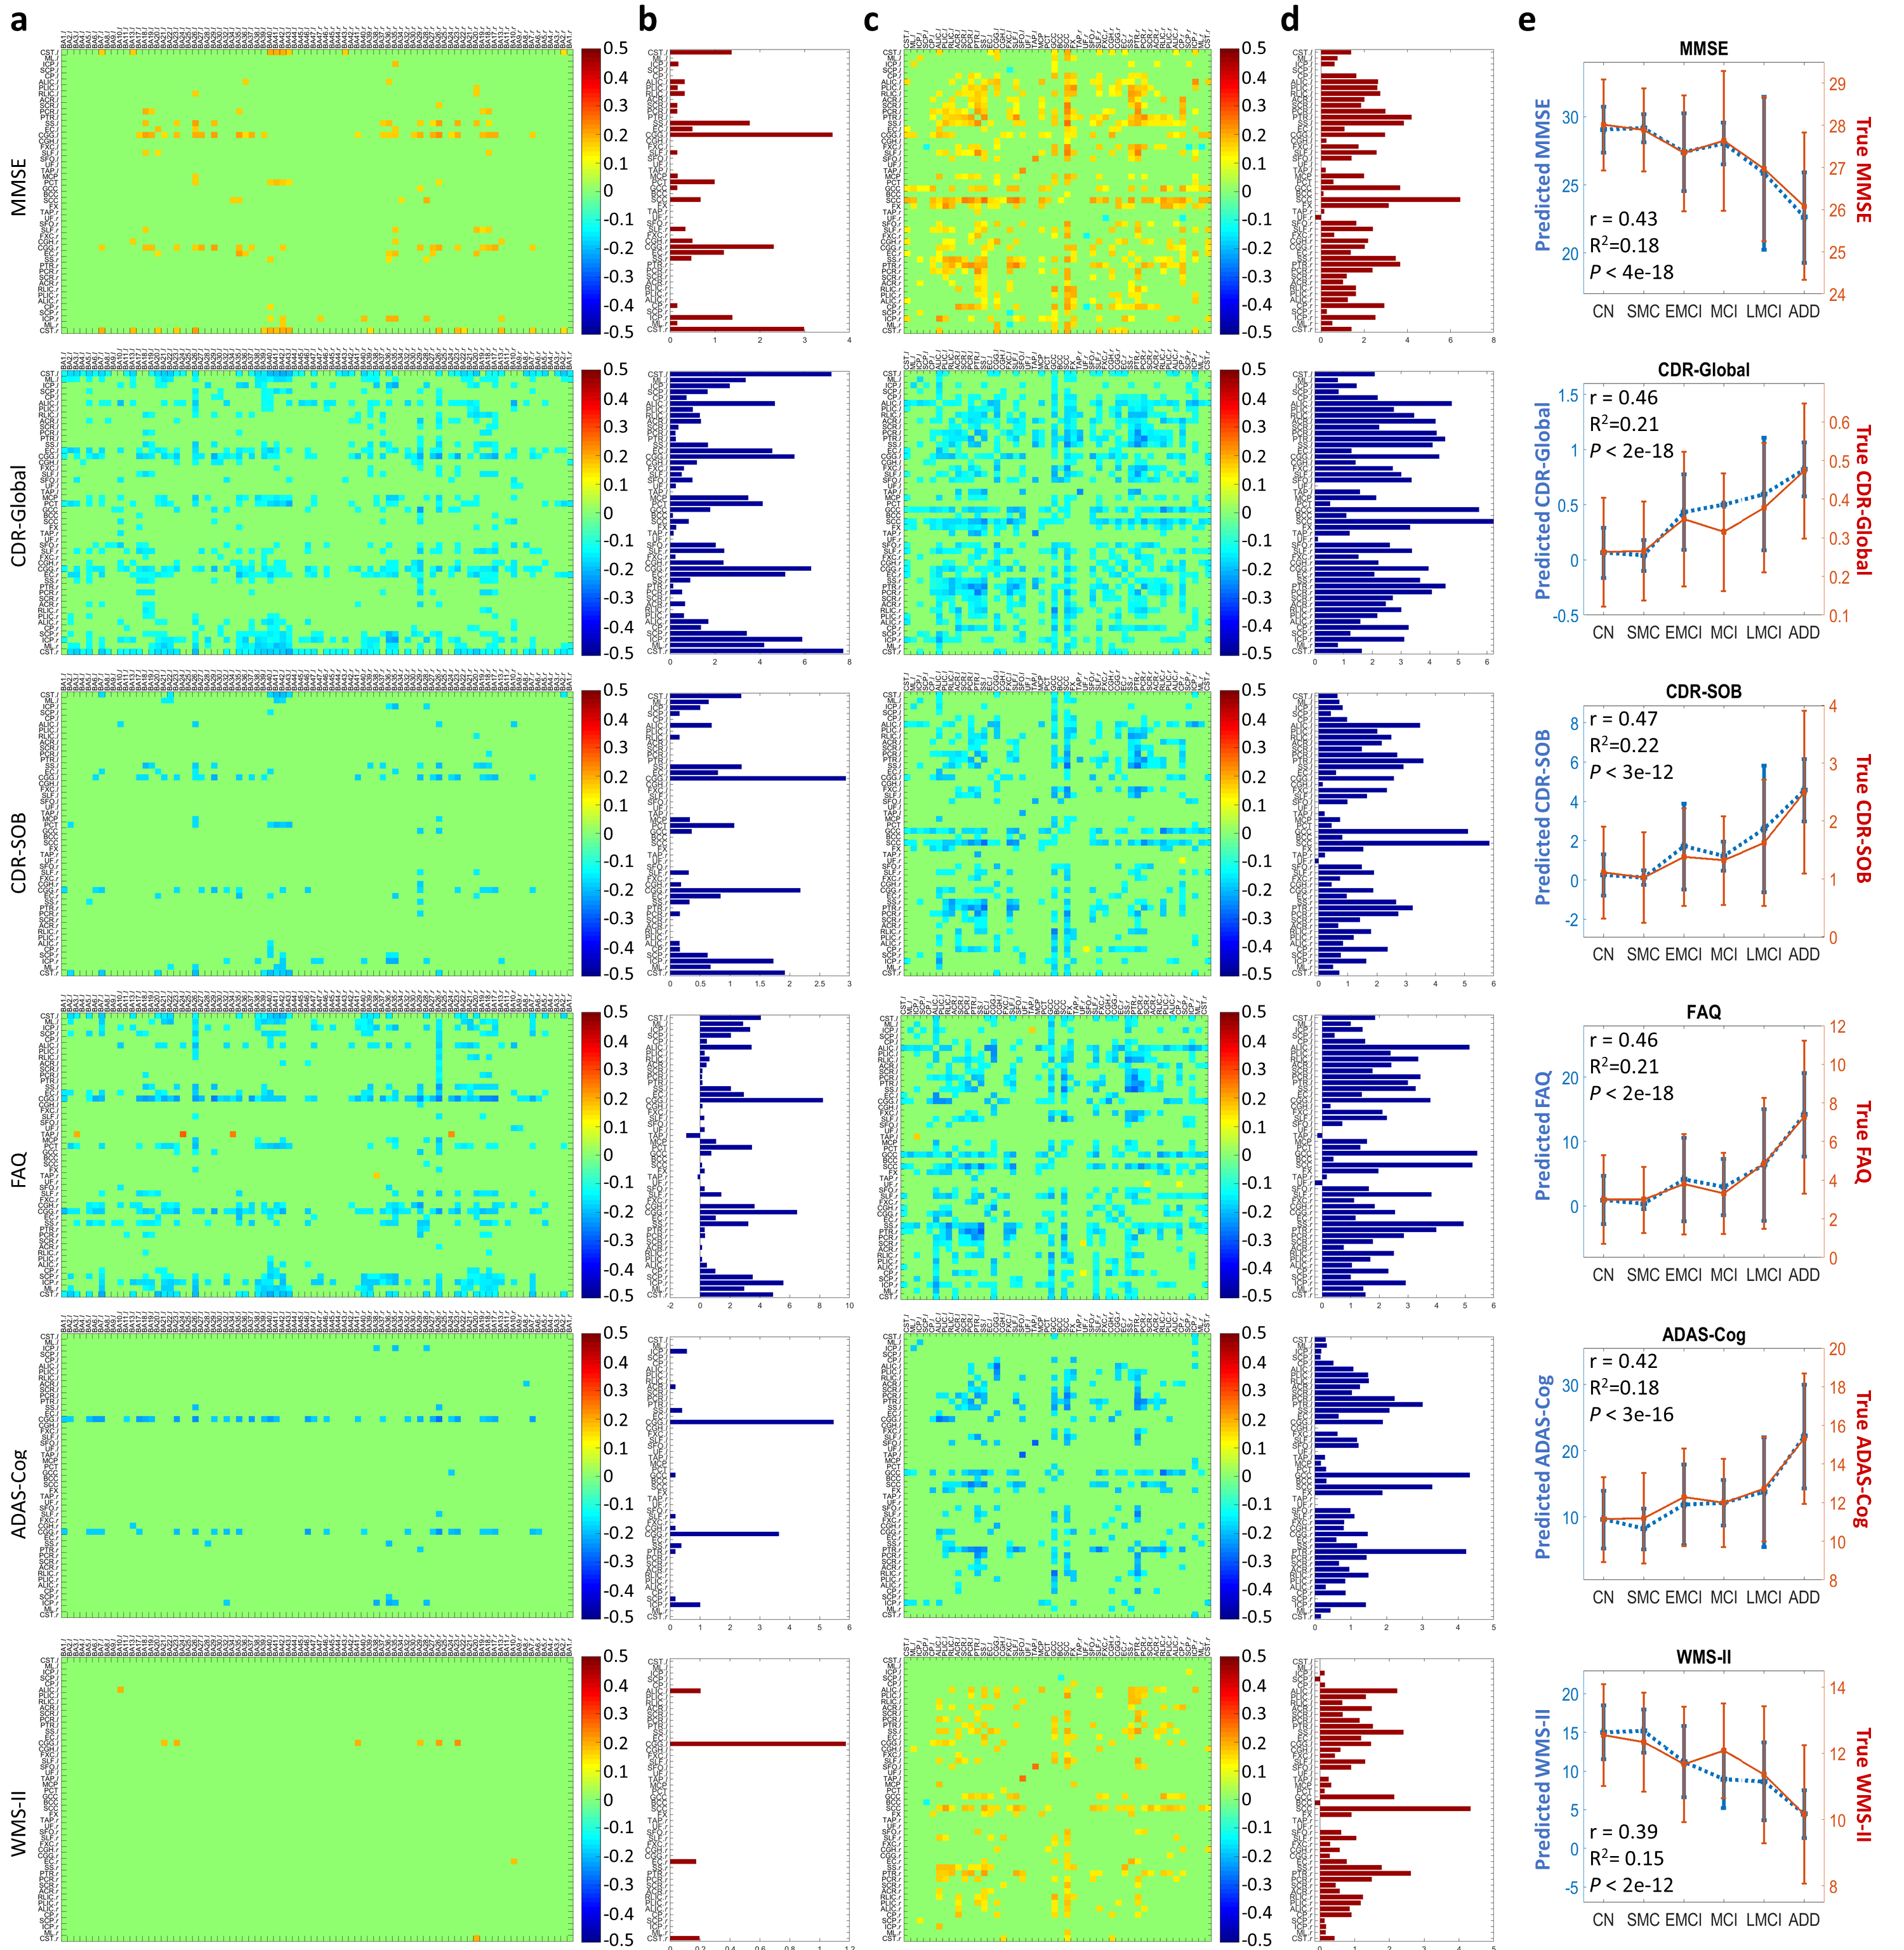
Figure 3a-d shows correlation coefficients between FCs and neuropsychological scores which are significantly different from zero (PFDR<.05). For example, FCs within SSlr, CGGlr, CGHl, FXClr, SCC, PTRlr, and CSTlr positively associated with MMSE scores14, indicating reduced WM FC corresponds to more severe cognitive impairment. GCC, SCC, FX, PTRlr, PCRl, CGGl, SSl, showed significant correlations between FCMWW and ADAS-Cog. SCC, GCC, SSlr, ALICl, PTRr, and CGGl showed stronger correlations between FC and WMS-LMII15 score.
Correlation between combined WM functional connectivities and neuropsychological scores
The correlation coefficients between the true and RF-predicted scores were 0.39-0.47 with highly significant P-value (<<.05) (Figure 3e). The R2 values indicate that 15%-22% of the variances of the scores could be explained by the variance of the overall combined WM FCs, and vice versa.
Prediction of AD stages
The SVM performance using WM FC features was best for distinguishing ADD from CN group (sensitivity=0.83, specificity=0.81 and AUC=0.87). The performance using optimized features reduced monotonically with addition of patients from earlier stages to the ADD group (Figure 4).
Conclusion
This study indicates that WM functional connectivities 1) decline regionally in LMCI and ADD groups relative to a CN group, 2) are significantly related to cognitive scores, and 3) can serve as machine learning features for distinguishing between AD patients and CN with an acceptable sensitivity and specificity. These findings suggest the potential of WM FC, which has been largely overlooked to date, as a novel neuroimaging biomarker to assess AD progression.Acknowledgements
The project is supported by the NIH grant R01 NS093669 and a Vanderbilt University Discovery Grant 600670. We also thank the Vanderbilt Advanced Computing Center for Research and Education (ACCRE) for the support of cluster computation.
Data collection and sharing for this project was funded by the ADNI (NIH Grant U01 AG024904) and DOD ADNI (DOD award number W81XWH-12-2-0012). ADNI is funded by the National Institute on Aging, the National Institute of Biomedical Imaging and Bioengineering, and through generous contributions from the following: AbbVie, Alzheimer’s Association; Alzheimer’s Drug Discovery Foundation; Araclon Biotech; BioClinica, Inc.; Biogen; Bristol-Myers Squibb Company; CereSpir, Inc.; Cogstate; Eisai Inc.; Elan Pharmaceuticals, Inc.; Eli Lilly and Company; EuroImmun; F. Hoffmann-La Roche Ltd and its affiliated company Genentech, Inc.; Fujirebio; GE Healthcare; IXICO Ltd.; Janssen Alzheimer Immunotherapy Research & Development, LLC.; Johnson & Johnson Pharmaceutical Research & Development LLC.; Lumosity; Lundbeck; Merck & Co., Inc.; Meso Scale Diagnostics, LLC.; NeuroRx Research; Neurotrack Technologies; Novartis Pharmaceuticals Corporation; Pfizer Inc.; Piramal Imaging; Servier; Takeda Pharmaceutical Company; and Transition Therapeutics. The Canadian Institutes of Health Research is providing funds to support ADNI clinical sites in Canada. Private sector contributions are facilitated by the Foundation for the NIH (www.fnih.org). The grantee organization is the Northern California Institute for Research and Education, and the study is coordinated by the Alzheimer’s Therapeutic Research Institute at the University of Southern California. ADNI data are disseminated by the Laboratory for Neuro Imaging at the University of Southern California.
References
1. Behrendt G, Baer K, Buffo A, et al. Dynamic changes in myelin aberrations and oligodendrocyte generation in chronic amyloidosis in mice and men. Glia. 2012;61(2):273-286.
2. Brun A, Englund E. A white matter disorder in dementia of the Alzheimer type: A pathoanatomical study. Annals of Neurology. 1986;19(3):253-262.
3. Arvanitakis Z, Capuano AW, Leurgans SE, Bennett DA, Schneider JA. Relation of cerebral vessel disease to Alzheimer's disease dementia and cognitive function in elderly people: a cross-sectional study. The Lancet Neurology. 2016;15(9):934-943.
4. Lue L-F, Kuo Y-M, Roher AE, et al. Soluble Amyloid β Peptide Concentration as a Predictor of Synaptic Change in Alzheimer's Disease. The American Journal of Pathology. 1999;155(3):853-862.
5. Weiner M. Study population. Alzheimer's Disease Neuroimaging Initiative 3 (ADNI3) Protocol2016.
6. Friston KJ, Williams S, Howard R, Frackowiak RS, Turner R. Movement-related effects in fMRI time-series. Magn Reson Med. 1996;35(3):346-355.
7. Ashburner J. A fast diffeomorphic image registration algorithm. NeuroImage. 2007;38(1):95-113.
8. Ashburner J, Friston KJ. Unified segmentation. NeuroImage. 2005;26(3):839-851.
9. Oishi K, Faria A, Jiang H, et al. Atlas-based whole brain white matter analysis using large deformation diffeomorphic metric mapping: Application to normal elderly and Alzheimer's disease participants. NeuroImage. 2009;46(2):486-499.
10. Lancaster JL, Woldorff MG, Parsons LM, et al. Automated Talairach Atlas labels for functional brain mapping. Human Brain Mapping. 2000;10(3):120-131.
11. Cohen J. Statistical power analysis for the behavioral sciences. 2nd ed. New York1988.
12. Benjamini Y, Hochberg Y. Controlling the False Discovery Rate: A Practical and Powerful Approach to Multiple Testing. Journal of the Royal Statistical Society. Series B (Methodological). 1995;57(1):289-300. 13. Sengupta A, Ramaniharan AK, Gupta RK, Agarwal S, Singh A. Glioma Grading Using a Machine-Learning Framework Based on Optimized Features Obtained From T1 Perfusion MRI and Volumes of Tumor Components. Journal of Magnetic Resonance Imaging. 2019;50(4):1295-1306.
14. Folstein MF, Folstein ES, McHugh RP. Mini-mental state. A practical method for grading the cognitive state of patients for the clinician. Journal of Psychiatric Research. 1975;12:189-198.
15. Wechsler D. WMS-R: Wechsler memory scale-revised: manual1987.
Figures