1462
Brain oxygen extraction fraction in cognitive impairment: a potential tool to differentiate between Alzheimer’s and vascular dementia1Department of Radiology, Johns Hopkins University School of Medicine, Baltimore, MD, United States, 2Department of Medicine, Johns Hopkins School of Medicine, Baltimore, MD, United States, 3Department of Psychiatry and Behavioral Sciences, Johns Hopkins School of Medicine, Baltimore, MD, United States, 4Department of Neurology, Johns Hopkins School of Medicine, Baltimore, MD, United States
Synopsis
Alzheimer’s disease (AD) and vascular dementia (VD) are the two most common types of cognitive impairment. However, there is still a lack of effective tools for their differential diagnosis. In this work, we demonstrated that OEF is differentially (in opposite direction) affected by AD and vascular pathology. Among patients with cognitive impairment, patients with low OEF are associated with more AD pathology and less vascular pathology; and the opposite can be said for patients with high OEF. These findings suggest that OEF may provide valuable information in differentiating AD and VD.
INTRODUCTION
Alzheimer’s disease (AD) and vascular dementia (VD) represent two of the most common types of cognitive impairment.1 Treatment strategies for the two types can be very different. However, many symptoms of these two diseases overlap and there is still a lack of effective tools for their differential diagnosis. Cerebral oxygen-extraction-fraction (OEF) reflects a delicate balance between vascular (e.g. blood supply) and neural (e.g. oxygen consumption) function. It can be hypothesized that, when the brain is characterized by neurodegeneration with relatively intact vascular function (i.e. AD), OEF will be diminished. On the other hand, when the brain mainly suffers from vascular dysfunction (i.e. VD), OEF will be unchanged or increased. Therefore, in this work, we used a non-invasive (without contrast agent) and rapid (1.2min in scan time) MRI technique to test the above hypothesis and demonstrate that OEF can differentiate impaired patients who have predominantly AD pathology versus those who have vascular diseases.METHODS
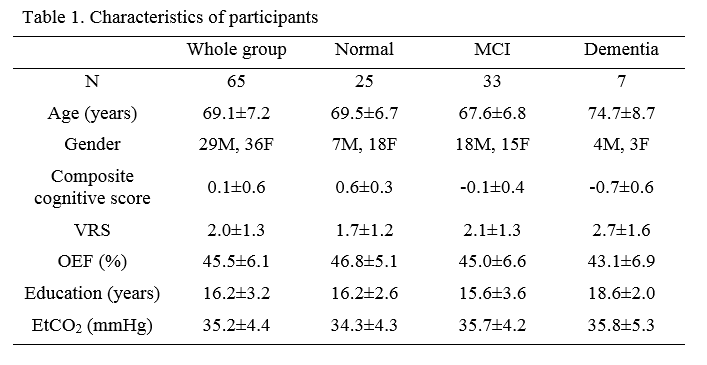
ParticipantsSixty-five elderly subjects were included, among which 25 were cognitively normal, 33 had mild-cognitive-impairment (MCI), and 7 had dementia. Neuropsychological tests were performed which included four cognitive domains: verbal episodic memory, executive function, processing speed, and language. The z-scores of each domain were averaged to yield an overall composite cognitive score. In addition, in a subset of 40 subjects, cerebrospinal-fluid (CSF) was collected through lumbar puncture, and β-amyloid-42 (Aβ42) concentration (in picograms/ml) was measured from the CSF samples.
Vascular-Risk-Score
Based on medical histories, a vascular-risk-score (VRS) was created by summing up five elements2: hypertension (1=recent, 0=remote/absent), hypercholesterolemia (1=recent, 0=remote/absent), diabetes (1=recent, 0=remote/absent), smoking (1 if ≥100 cigarettes-smoked, 0 if not) and body-mass-index (1 if >30, 0 if not).
MRI Experiment
The global OEF of each subject was measured using an MRI technique, T2-relaxation-under-spin-tagging (TRUST),3,4 with the following parameters: TR=3000ms, TI=1020ms, and scan time=1.2min. During the TRUST scan, end-tidal CO2 (EtCO2) of each subject was sampled by nasal cannula and recorded with a capnograph device.
Data Processing
The processing of TRUST OEF data followed established literature.3,4 Previous studies have shown that inter-subject variations in OEF are largely attributed to EtCO2.5 Therefore, to reduce physiological variations, OEF was corrected for EtCO2 using:
$$OEF=OEF_{raw}-\alpha(EtCO_2-\overline{EtCO_2})$$
where $$$OEF_{raw}$$$ is the OEF before correction, $$$\overline{EtCO_2}$$$ is the averaged EtCO2 across subjects. The coefficient α was obtained by linear regression between OEF and EtCO2 across the 65 subjects, and was found to be -0.92±0.17%/mmHg (P=2×10⁻⁶).
Statistical Analysis
Multi-linear regression analyses were conducted in which OEF was the dependent variable while VRS and diagnosis (0=normal, 1=MCI, 2=dementia) were independent variables. A Diagnosis×VRS interaction term was also tested. Age and sex were used as covariates. We also divided the subjects into subgroups of a low-VRS (≤2) subgroup and a high-VRS (>2) subgroup, or a normal subgroup and an impaired subgroup (MCI/dementia), and examined their relationships to OEF. The associations of OEF with cognitive function and CSF Aβ42 were also examined.
RESULTS AND DISCUSSION
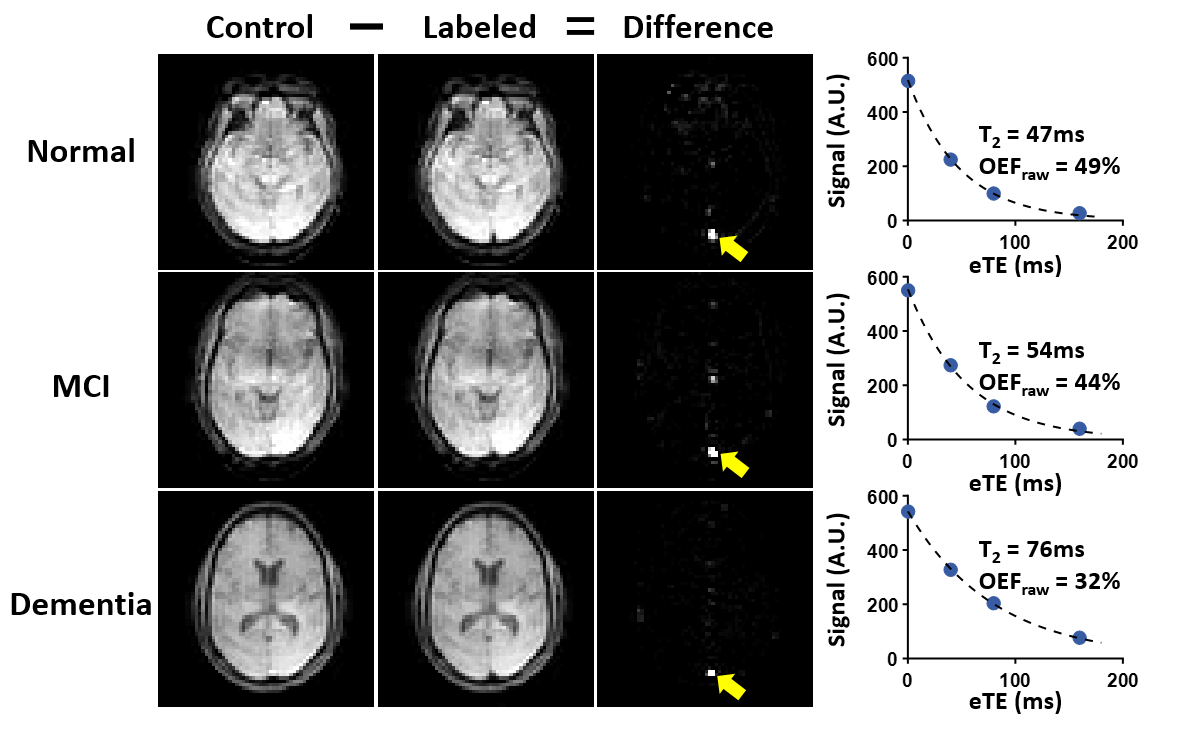
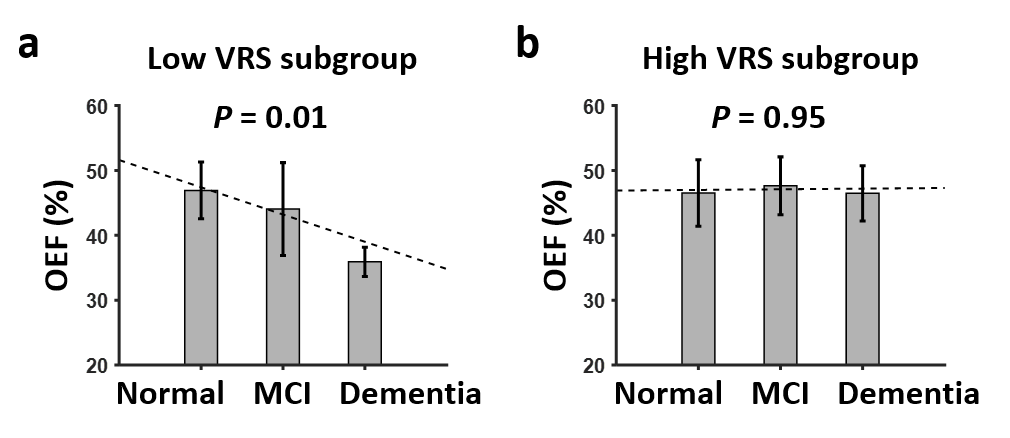
Table 1 lists the characteristics of the subjects. Figure 1 shows representative TRUST OEF data. Multi-linear regression analysis revealed that OEF was negatively associated with diagnosis of cognitive impairment (P=0.02) but positively associated with VRS (P=0.02). OEF increased with age (P=0.01) and was not related to sex (P=0.74), consistent with previous reports.6When further adding the Diagnosis×VRS term to the model, a significant interaction effect was observed (P=0.04). We then divided the subjects by VRS. As shown in Figure 2a, in the low-VRS subgroup (N=44), OEF was inversely correlated with diagnosis of cognitive impairment (P=0.01). Since the low-VRS impaired individuals are likely attributed primarily to AD-type dementia, this observation supports our hypothesis that AD results in diminished OEF. In the high-VRS subgroup (N=21), on the other hand, OEF was not associated with diagnosis (P=0.95, Figure 2b), suggesting that VD has a different effect on OEF compared to AD.
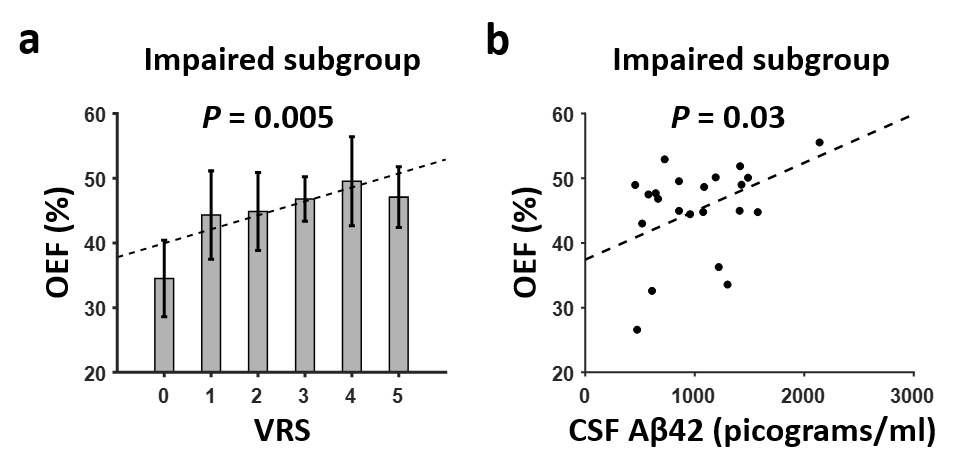
Next, we split the subjects by diagnosis. As illustrated in Figure 3a, among impaired individuals (MCI/dementia) (N=40), OEF was positively associated with VRS (P=0.005). This observation supports the notion that, in a group of patients diagnosed with MCI/dementia, one can use OEF to differentiate those who are attributed to vascular disease from those attributed to AD. OEF was not associated with VRS (P=0.49) in the normal subgroup (N=25).
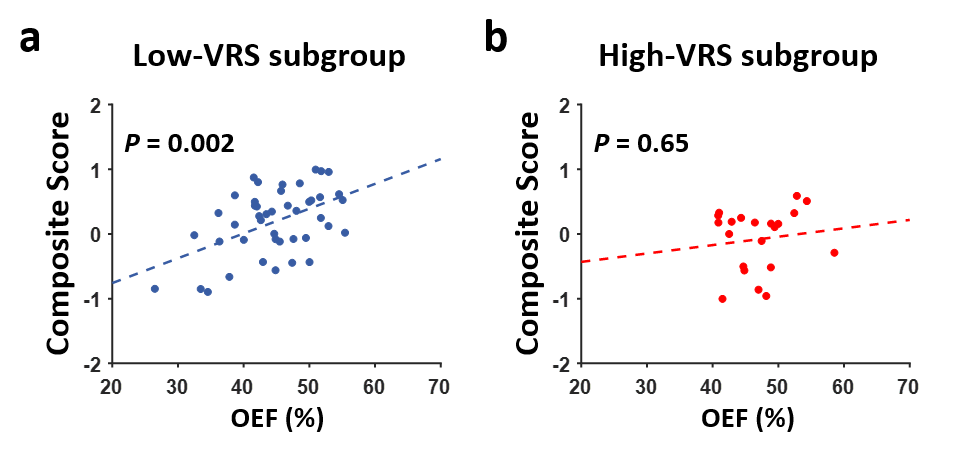
There was a strong association between OEF and cognition (P=0.002 for composite cognitive score and P=0.0003 for processing-speed domain, Figure 4) in the low-VRS group, but not in the high-VRS group (P>0.6), again suggesting that AD and VD have different impacts on OEF.
CSF Aβ42 was only available in a subset of participants. Thus, they were used in an exploratory analysis with prior hypothesis, and a one-tail P-value was used. Figure 3b shows a scatter plot between OEF and CSF Aβ42 in the impaired group (one-tail P=0.03). Together with Figure 3a, these results strongly suggest that OEF is differentially (in opposite direction) affected by AD and vascular pathology.
CONCLUSION
This work demonstrated that, among patients with cognitive impairment, patients with low OEF are associated with more AD pathology and less vascular pathology; and the opposite can be said for patients with high OEF. These findings suggest that OEF may provide valuable information in differentiating AD and vascular dementia.Acknowledgements
No acknowledgement found.References
1. Organization WH. https://www.who.int/en/news-room/fact-sheets/detail/dementia.
2. Gottesman RF, Schneider AL, Zhou Y et al. Association Between Midlife Vascular Risk Factors and Estimated Brain Amyloid Deposition. JAMA 2017;317:1443-1450.
3. Lu H, Ge Y. Quantitative evaluation of oxygenation in venous vessels using T2-Relaxation-Under-Spin-Tagging MRI. Magn Reson Med 2008;60:357-363.
4. Xu F, Uh J, Liu P, Lu H. On improving the speed and reliability of T2-relaxation-under-spin-tagging (TRUST) MRI. Magn Reson Med 2012;68:198-204.
5. Jiang D, Lin Z, Liu P et al. Normal variations in brain oxygen extraction fraction are partly attributed to differences in end-tidal CO2. J Cereb Blood Flow Metab 2019. doi:10.1177/0271678X19867154:271678X19867154.
6. Liu P, Dimitrov I, Andrews T et al. Multisite evaluations of a T2-relaxation-under-spin-tagging (TRUST) MRI technique to measure brain oxygenation. Magn Reson Med 2016;75:680-687.
Figures