1461
Study of the cerebral blood flow and Iron Deposition metabolism in Alzheimer’s disease using ASL-MRI and QSM-MRI1Department of Radiology, Guizhou Provincial People's Hospital, Guiyang, China, 2GE Healthcare, MR Research, Beijing, China
Synopsis
The CBF and iron deposition evaluation are commonly used in alzheimer's disease. we analyzed the changes and correlations of CBF and iron deposition in different stages of AD. ASL and QSM identified several abnormal brain regions of interest, which were sensitive to tissue alterations in each stage. This study found QSM was detected in the early stage of AD, which is expected to be an effective tool for early AD diagnosis and timely intervention. Additionally, the iron deposition and CBF in the globus pallidum and putamen flow negatively correlated in the AD group that may be relevant to pathologic changes.
Introduction
Alzheimer's disease (AD) is a neurodegenerative disease mainly manifested by progressive irreversible memory loss and cognitive decline. Its pathological changes are fiber tangles of neurons and deposition of amyloid protein. At present, there is a lack of effective treatment for middle and late AD, and the most effective measures to prevent and control its progress are early diagnosis and early intervention. With the introduction of the concept of pre-clinical AD1, currently the disease course of AD can be divided into three stages including subjective cognitive decline (SCD), mild cognitive impairment (MCI) and dementia2. Previous research found that cerebral blood flow (CBF) and iron deposition are involved in the pathological process of AD respectively, but didn’t investigate the correlation of CBF and iron deposition3-6. The aim of this study is to use three-dimensional (3D) continuous pulse arterial spin labeling (pCASL) and Quantitative susceptibility mapping (QSM) techniques to investigate CBF and iron deposition changes in patients with AD, MCI, SCD and age- and sex-matched healthy controls. And explore the correlation of CBF and iron deposition in different course of AD.Materials and Methods
This study was approved by the institutional review board, and written informed consent was obtained from all patients. Sixteen patients with AD, fourteen patients with MCI, fifteen patients with SCD, and seventeen control subjects were recruited in the study. All participants underwent a 3D T1-weighted imaging acquisition, a 3D pCASL acquisition, and a 3D multi-gradient-echo QSM acquisition. All MRI examinations were performed at a 3.0T MR imaging system (Discovery MR 750w, GE Healthcare, Milwaukee, USA) with an 8-channel phased array head coil. The CBF and magnetic susceptibility maps were further calculated from the ASL and QSM data on AW4.6 GE Workstation. Using the SPM12 software package (http://www.fil.ion.ucl.ac.uk/spm/) implemented in MATLAB (MathWorks, Natick, MA, USA), we first registered ASL and CBF images of each participant to its own structural image, then normalized to the standard brain, and finally smoothed with a 6 mm isotropic gaussian kernel. The processing process of QSM is the same as above. The ROIs including globus pallidus (GP), putamen (PU), caudate nucleus (CA), hippocampus (HP), thalamus (TH), frontal cortex (FC), parietal cortex (PC), and occipital cortex (OC) extracted were selected based on Brainnetome Atlas brain network atlas7. The CBF and magnetic susceptibility values were extracted from these standardized ROIs using a custom MATLAB code. Histograms of CBF and magnetic susceptibility values in each ROI were drawn (Figure 1), and the differences analysis of CBF or magnetic susceptibility values between each group were performed by variance analysis. The Receiver Operating Characteristic (ROC) curves of CBF and magnetic susceptibility values in each group of ROI were drawn, and It's area under the curve (AUC) were analyzed. At last, The correlation analysis between the CBF and magnetic susceptibility values in each ROI was performed by Spearman test.Results
ASL and QSM identified several abnormal brain regions of interest(ROI) (P<0.05) in AD, MCI and SCD (Table 1). The differences in the CBF values were found multiple ROIs between groups comparison, and CBF values of all ROIs in AD and MCI were lower than those in the normal control group. However, CBF values of all ROIs in SCD were higher than the normal control except CA and FC. In addition, we found that the highest brain magnetic susceptibility values in SCD, MCI and AD were GP, and then the PU, while the lowest was HP, and the magnetic susceptibility values of the three groups in PU, GP and CA were significantly different from those of the control group. Simultaneously, the magnetic susceptibility values of partial ROIs in different groups are statistically different, such as the PU and GP in AD group(P<0.001). Iron anomalies were similar to the above in the MCI and SCD groups, a phenomenon visually traceable in many individual patients (Figure 2). Then, the ROC curve displayed that the magnetic sensitivity values of GP, PU and CA have good diagnostic performance in AD, MCI and SCD, and the CBF of CA and PC has a better predictive effect on AD (P < 0.05) (Figure 3). In addition, significantly negative correlation between CBF and magnetic susceptibility values were found at the GP and PU in the AD group, and the same founding was showed at the HP in the MCI group (P< 0.05) (Figure 4).Discussion and Conclusion
ASL and QSM identified abnormal brain regions of interest, which were sensitive to tissue alterations in different stages of Alzheimer’s disease that may be relevant to pathologic changes. This study found that perfusion brain regions increased presence of SCD group phenomenon, we might speculate now about the early compensatory increased. And QSM is noted during early stages of cognitive decline in AD. It is promising to be a useful tool for early AD diagnosis and timely intervention. Additionally, the iron deposition and CBF in the globus pallidum and putamen flow negatively correlated in the AD group. But we still need to explore the physiological mechanism of this phenomenon in the future.Acknowledgements
This work was supported by the National Natural Science Foundation of China (No. 81960314), the Science and Technology Foundation of Guizhou Province (QKHZC[2019]2810), (QKHJC[2016]1096), (QKHPTRC[2019]5803), and (QKHPTRC[2017]5724), the Guizhou Provincial People’s Hospital Doctoral Foundation (GZSYBS[2015]02), and the Guizhou Science and Technology Department Key lab. Project (QKF[2017]25).References
1. Bateman RJ, Xiong C, Benzinger TL. Clinical and biomarker changes in dominantly inherited Alzheimer’s disease. N Engl J Med. 2012;367(9).
2. Wolfsgruber S, Kleineidam L, Wagner M, et al. Differential risk of incident Alzheimer's disease dementia in stable versus unstable patterns of subjective cognitive decline. Journal of Alzheimer's Disease. 2016;54(3):1135-1146.
3. Staffen W, Bergmann J, Schönauer U, et al. Cerebral perfusion (HMPAO-SPECT) in patients with depression with cognitive impairment versus those with mild cognitive impairment and dementia of Alzheimer's type: a semiquantitative and automated evaluation. Eur J Nucl Med Mol Imaging. 2009;36(5):801-810.
4. Wang Z, Das S R, Xie S X, et al. Arterial spin labeled MRI in prodromal Alzheimer's disease: A multi-site study. Neuroimage Clin. 2013;2:630-636.
5. Acosta-Cabronero J, Williams GB, Cardenas-Blanco A, et al. In vivo quantitative susceptibility mapping (QSM) in Alzheimer's disease. PLoS One. 2013;8(11):e81093.
6. Du L, Zhao Z, Cui A, et al. Increased Iron Deposition on Brain Quantitative Susceptibility Mapping Correlates with Decreased Cognitive Function in Alzheimer's Disease. ACS Chem Neurosci. 2018;9(7):1849-1857.
7. Fan L, Li H, Zhuo J, et al. The Human Brainnetome Atlas: A New Brain Atlas Based on Connectional Architecture. Cereb Cortex. 2016;26(8):3508-26.
Figures
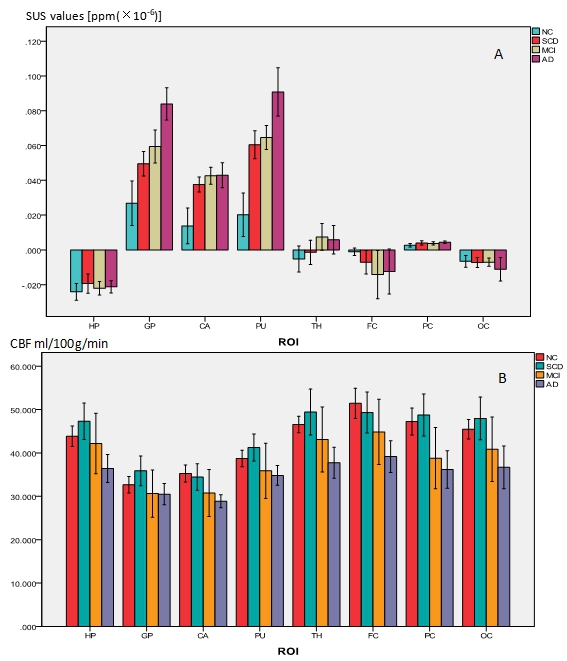
Figure 1. Comparison of histograms between groups ( A = SUS, B = CBF).
A. The highest brain magnetic susceptibility values in SCD, MCI and AD were GP, and then the PU, while the lowest was HP.
B. CBF values of all ROIs in AD and MCI were lower than those in the normal control group. CBF values of all ROIs in SCD were higher than the normal control except CA and FC.
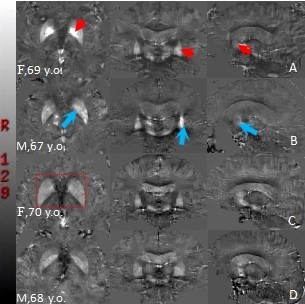
Figure 2. Representative axial,coronal and sagittal quantitative susceptibility mapping (QSM) views in standard space in, control subjects and age-matched patients.
A=AD patient; B=MCI patient; C=ACD patient; D=Control subject
Arrowheads = some regions of QSM increase in AD and MCI: globus pallidus (axial view), putamen (coronal view) and caudate nucleus (sagittal view).
C and D are not significant in visual difference, but C is unclear in the structure of the basal ganglia (red label).
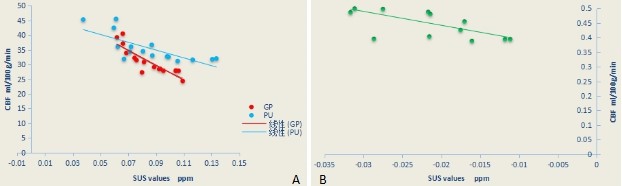
Figure 3. Correlation analysis of CBF and SUS values ( A = AD, B = MCI)
A. Significant negative correlation between cerebral blood flow (CBF) and magnetic susceptibility (SUS) values were found in GP(SUS= 0.085 ± 0.016, CBF= 30.907 ± 4.601; r= - 0.874, P<0.001) and PU(SUS= 0.086 ± 0.027, CBF= 35.477 ± 4.781; r= - 0.806, P= 0.001).
B. Significant negative correlation between CBF and SUS values were found in HP (SUS= - 0.022 ± 0.007, CBF= 45.172 ± 4.896; r= - 0.662, P= 0.01) .
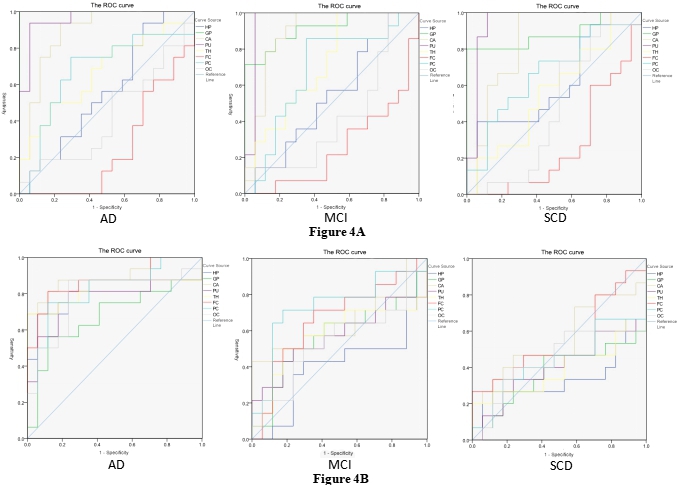
Figure 4. ROC curve of ROI magnetic susceptibility values and blood flow of each group.
A. ROC curve of ROI magnetic susceptibility values. GP, PU and CA all have statistical significane in AD (AUC= 1, AUC= 0.96, AUC= 0.886; P<0.001), MCI (AUC= 0.916, AUC= 0.954, AUC=0.887; P<.001) and SCD (AUC= 0.882, AUC= 0.945, P<0.001; AUC= 0.835, P=0.001).
B. ROC curve of ROI blood flow. CA (AUC= 0.897; P<0.001) and FC (AUC= 0.868; P<0.001) all have statistical significane in AD. All ROIs of MCI and SCD were not statistically significant(P>0.05).
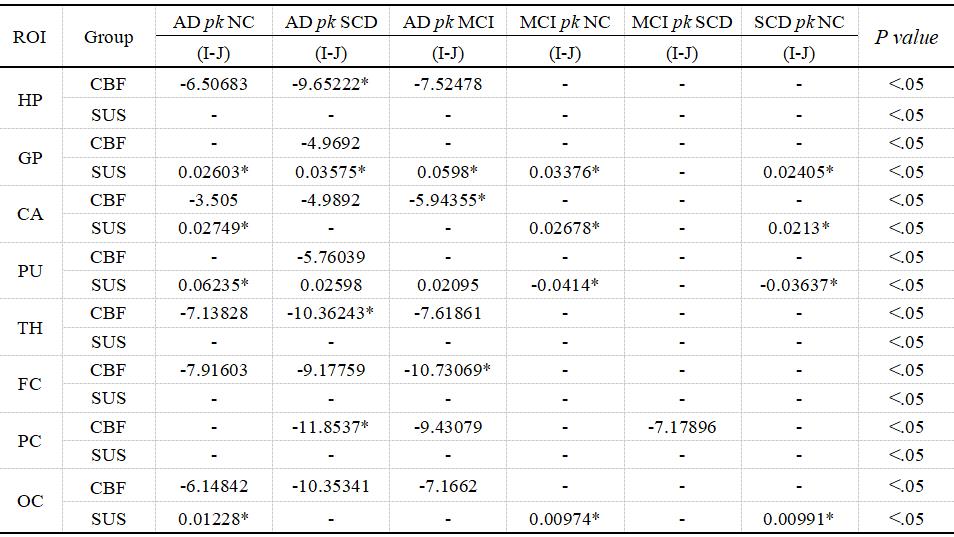
Table 1. The magnetic susceptibility values of the three lesion groups in PU, GP and CA were significantly different from those of the control group ( * =P<. 001). No differences in magnetic susceptibility values between each group were found on HP and PC( - =p>.05).
The differences in the CBF values were found multiple ROIs between groups comparison. No differences in CBF and magnetic susceptibility values between MCI and SCD groups were found in all ROIs, except in the CBF at the PC(P < 0.05).