1460
Cortical Thickness Estimates to Classify Early Onset Alzheimer’s Disease versus Frontotemporal Dementia1Physics, University of Rochester, Rochester, NY, United States, 2Translational Biomedical Sciences, University of Rochester, Rochester, NY, United States, 3Imaging Sciences, University of Rochester, Rochester, NY, United States
Synopsis
Frontotemporal Dementia (FTD) and Early-Onset Alzheimer's Dementia (EOAD) can occur in the same age group and have overlapping symptoms, often complicating diagnosis. In this study, we focused on trying to understand cortical thickness as a biomarker of dementia type. More specifically, we wanted to classify EOAD vs FTD using only data from T1w MRI. We found that classification of FTD vs EOAD using FreeSurfer and ANTs cortical thickness data is highly dependent on the type of classifier used. In addition, it seems that ANTs is better suited than FreeSurfer independent of classification model.
Background
Early onset Alzheimer’s Disease (EOAD) is characterized by the clinical features of AD before the age of 65. These cases are believed to be associated with a hereditary trait. Making a diagnosis of EOAD is complicated by the fact that frontotemporal dementia (FTD) is similar in prevalence to EOAD in this age group.[1] Despite the fact that each of these conditions can present in unique ways, there is substantial overlap in clinical presentation such that FTD and EOAD are commonly misdiagnosed as each other.[2] Previous studies have found distinct patterns of atrophy[3-5], perfusion[6, 7], and glucose metabolism[8, 9]. In this study, we focused on the first pattern noted, trying to understand cortical thickness as a biomarker of dementia type. We chose to use only atrophy because a biomarker derived from this data would be readily usable, requiring the acquisition of only a T1W scan. We further sought to understand how different processing pipelines influence thickness measures and generated a classification algorithm to better classify FTD and EOAD.Methods
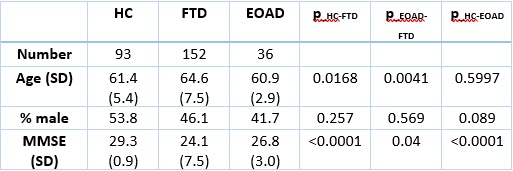
Subjects – The EOAD group was selected from the AD Neuroimaging Initiative (ADNI) database with the age of 65 or less, including subjects with AD as well as Mild Cognitive Impairment (MCI), a stage that precedes AD in many cases. With these inclusion requirements, we were able to include data from 36 subjects with EOAD or MCI. The FTD subject data was downloaded from the Frontotemporal Lobar Degeneration Neuroimaging Initiative (FTLDNI) database, which has baseline data on 152 subjects. Healthy control data was also downloaded from the FTLDNI database, which amounted to 93 subjects. The demographics of each cohort are shown in Table 1. Imaging – T1W images were downloaded for each of the subjects, our only restriction on the image was that it was acquired at a 1x1x1 mm resolution. Cortical Thickness Measurement – We used two popular methods of cortical thickness estimation: FreeSurfer [10] and the ANTs Cortical Thickness Pipeline [11]. Each of these pipelines requires only a T1W image for analysis. FreeSurfer generates thickness measures on different atlases; for this study, we used thickness measures on the Desikan-Killiany-Tourville (DKT) atlas [12]. The FreeSurfer statistics for this atlas were extracted for each subject. The ANTs pipeline outputs a map of cortical thickness, and ROIs from the OASIS DKT atlas [13] were used to generate identical statistics from the ANTs pipeline. The statistics were then used in a random forest classifier and a logistic regression, for comparison, to classify AD vs FTD. Accuracy, sensitivity, and specificity of each model was calculated using five-fold cross-validation.Results
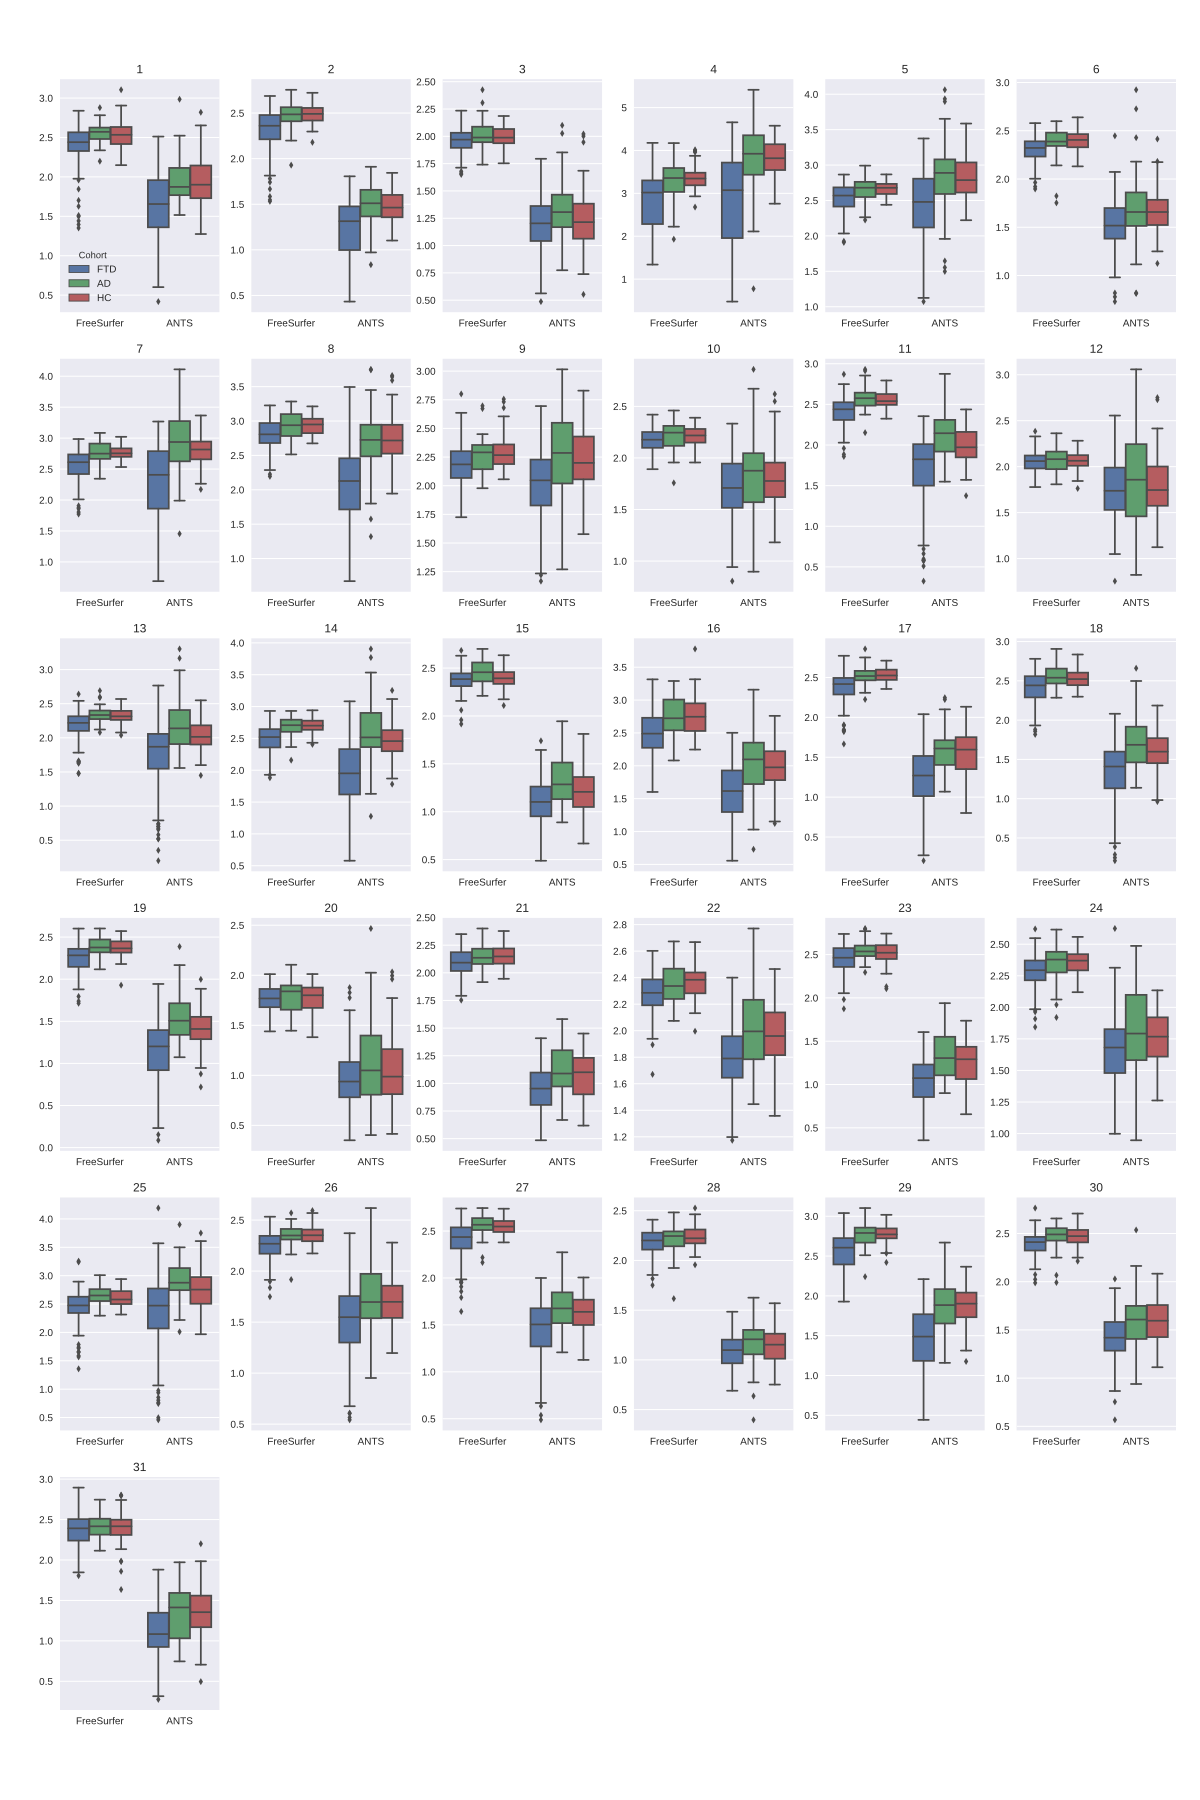
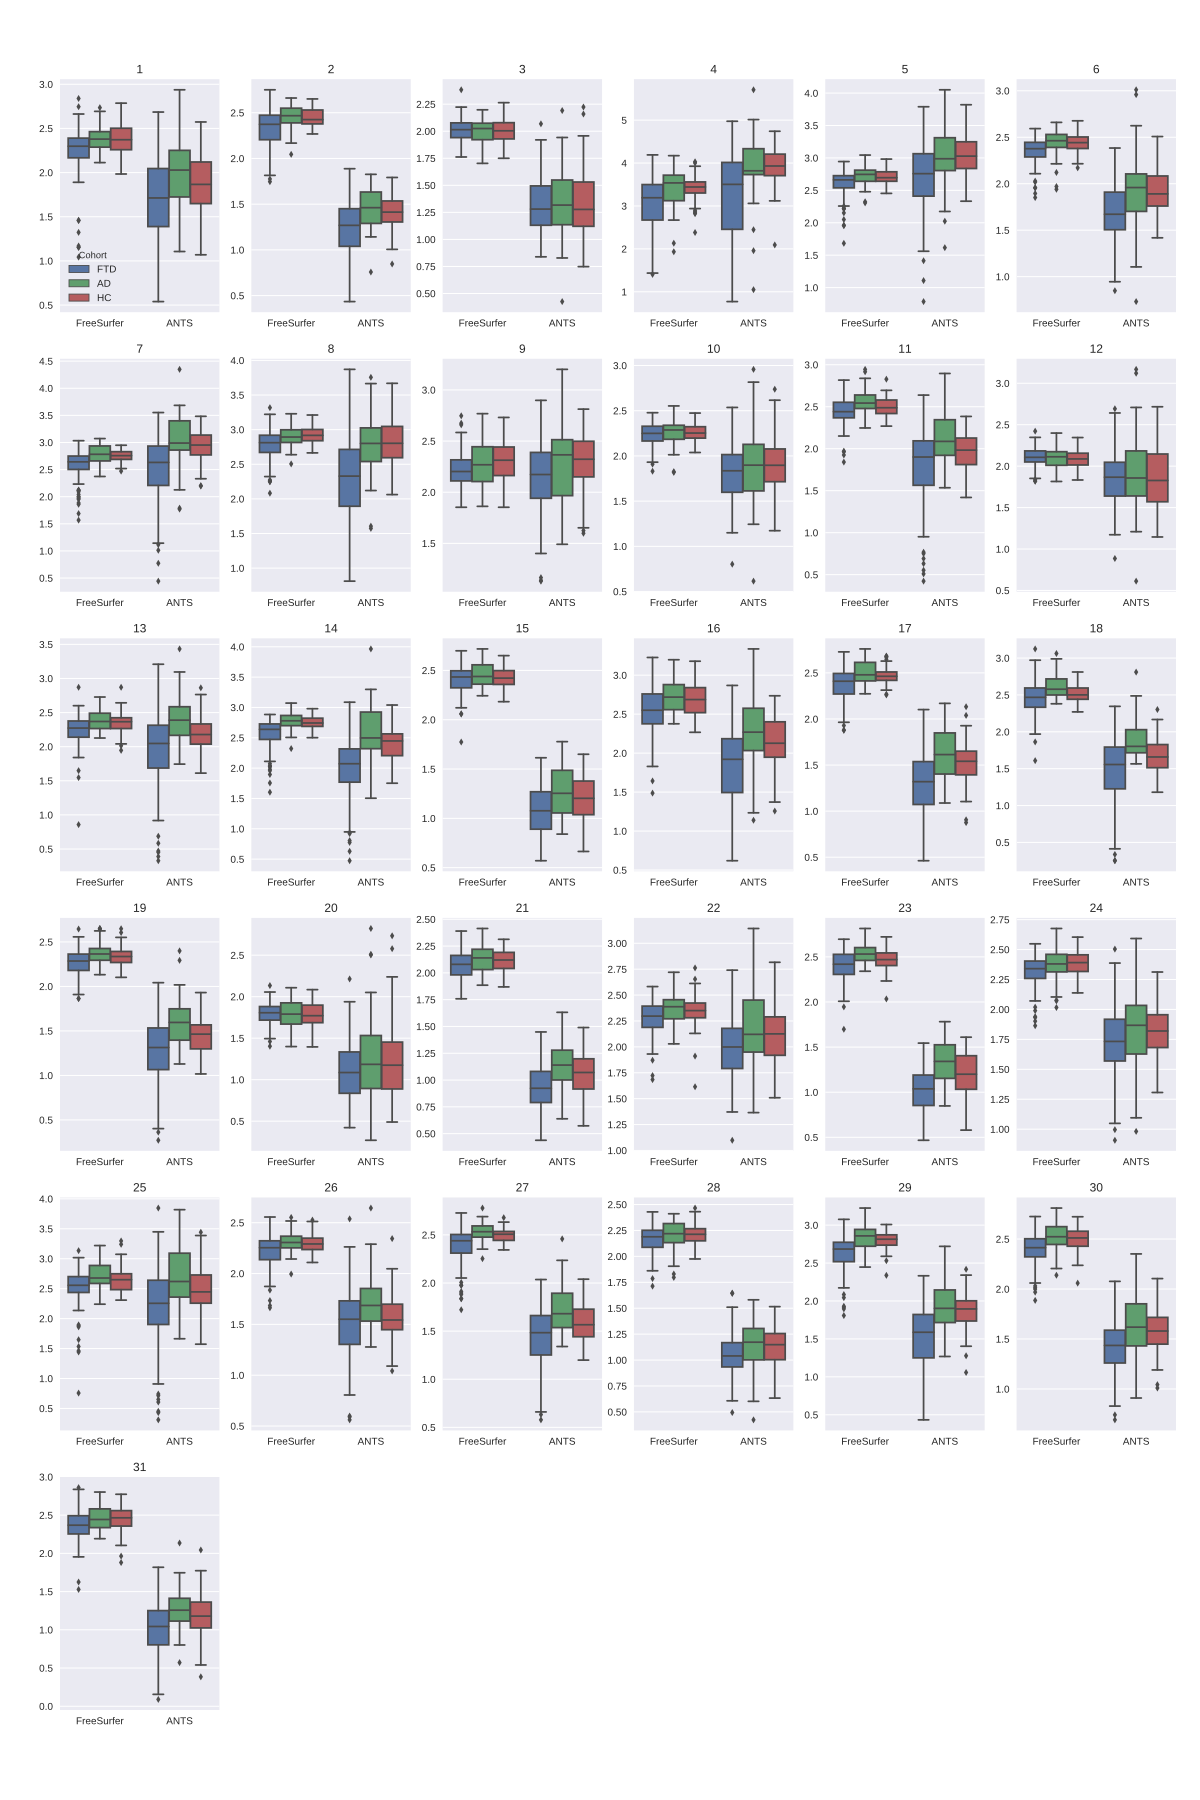
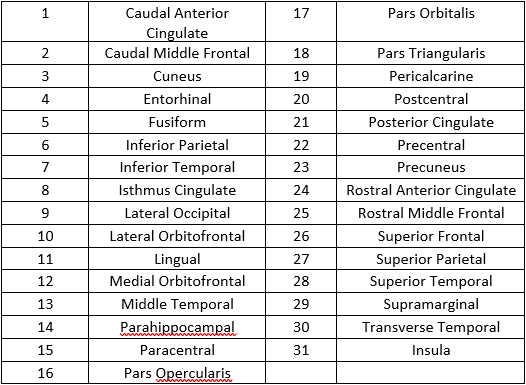
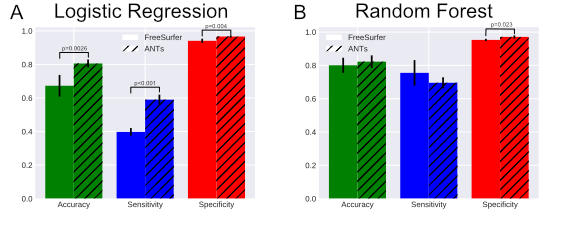
Figures 1 and 2 show the results of cortical thickness measurements from the FreeSurfer and ANTs processing pipelines in all three cohorts. The 31 regions shown in these Figures are defined in Table 2. Figure 3 shows the classification accuracy, as well as the sensitivity and specificity of classification to the AD group using the data from each of the pipelines.Discussion
Based on the results shown in Figures 1 and 2, we can see that the FreeSurfer and ANTs pipelines do not give identical results. In general, the ANTs Cortical Thickness pipeline seems to estimate lower cortical thickness compared to the FreeSurfer pipeline. However, both pipelines reflect the same pattern of cortical thickness between cohorts. For example, in region 13 (Middle Temporal Area) seen in the 3rd row, 1st column of Figures 1 and 2 (left and right hemisphere, respectively), both algorithms reflect that the FTD group has a lower estimate of cortical thickness than AD or HC and that the AD and HC cohorts have similar thickness measures. The ANTs estimates also seem to have a wider distribution, seen by the height of the box plots in Figures 1 and 2, this could arise either from higher sensitivity to cortical thickness changes or greater amount of noise intrinsic to the ANTs pipeline. We would expect the latter to lead to poor classification while the former would produce better classification estimates. In Figure 3, we see that the overall accuracy as well as the sensitivity and specificity of AD classification are influenced by which type of classifier is used. In addition, classification on ANTs data seems to be better in the case of both classifiers compared to the FreeSurfer data. In the random forest classifier, using ANTs data, we see that there is an increase in specificity of AD diagnosis, while in the logistic regression, the FreeSurfer accuracy and sensitivity also are significantly lower than the ANTs data. This suggests that the ANTs pipeline is more sensitive to cortical thickness changes and is better suited as a predictor of FTD vs EOAD pathology.Conclusion
We found that classification of FTD vs EOAD using FreeSurfer and ANTs cortical thickness data is highly dependent on the type of classifier used. In addition, it seems that ANTs is better suited than FreeSurfer independent of classification model. In the future, we hope that more EOAD patients are scanned to better train the classifier, which we believe will increase the sensitivity of EOAD classification.Acknowledgements
I would like to acknowledge Giovanni Schifitto and the funding from 5R01MH118020-02. Data collection and sharing for this project was funded by the Alzheimer's Disease Neuroimaging Initiative (ADNI) (National Institutes of Health Grant U01 AG024904) and DOD ADNI (Department of Defense award number W81XWH-12-2-0012). ADNI is funded by the National Institute on Aging, the National Institute of Biomedical Imaging and Bioengineering, and through generous contributions from the following: AbbVie, Alzheimer's Association; Alzheimer's Drug Discovery Foundation; Araclon Biotech; BioClinica, Inc.; Biogen; Bristol-Myers Squibb Company; CereSpir, Inc.; Cogstate; Eisai Inc.; Elan Pharmaceuticals, Inc.; Eli Lilly and Company; EuroImmun; F. Hoffmann-La Roche Ltd and its affiliated company Genentech, Inc.; Fujirebio; GE Healthcare; IXICO Ltd.;Janssen Alzheimer Immunotherapy Research & Development, LLC.; Johnson & Johnson Pharmaceutical Research & Development LLC.; Lumosity; Lundbeck; Merck & Co., Inc.;Meso Scale Diagnostics, LLC.; NeuroRx Research; Neurotrack Technologies; Novartis Pharmaceuticals Corporation; Pfizer Inc.; Piramal Imaging; Servier; Takeda Pharmaceutical Company; and Transition Therapeutics. The Canadian Institutes of Health Research is providing funds to support ADNI clinical sites in Canada. Private sector contributions are facilitated by the Foundation for the National Institutes of Health (www.fnih.org). The grantee organization is the Northern California Institute for Research and Education, and the study is coordinated by the Alzheimer's Therapeutic Research Institute at the University of Southern California. ADNI data are disseminated by the Laboratory for Neuro Imaging at the University of Southern California.References
1. Ratnavalli, E., et al., The prevalence of frontotemporal dementia. Neurology, 2002. 58(11): p. 1615-21.
2. Hernandez, I., et al., Identification of misdiagnosed fronto-temporal dementia using APOE genotype and phenotype-genotype correlation analyses. Curr Alzheimer Res, 2014. 11(2): p. 182-91. 3. Rabinovici, G.D., et al., Distinct MRI atrophy patterns in autopsy-proven Alzheimer's disease and frontotemporal lobar degeneration. Am J Alzheimers Dis Other Demen, 2007. 22(6): p. 474-88.
4. Laakso, M.P., et al., Hippocampus and entorhinal cortex in frontotemporal dementia and Alzheimer's disease: a morphometric MRI study. Biol Psychiatry, 2000. 47(12): p. 1056-63.
5. Du, A.T., et al., Different regional patterns of cortical thinning in Alzheimer's disease and frontotemporal dementia. Brain, 2007. 130(Pt 4): p. 1159-66.
6. Du, A.T., et al., Hypoperfusion in frontotemporal dementia and Alzheimer disease by arterial spin labeling MRI. Neurology, 2006. 67(7): p. 1215-20.
7. Varma, A.R., et al., Diagnostic patterns of regional atrophy on MRI and regional cerebral blood flow change on SPECT in young onset patients with Alzheimer's disease, frontotemporal dementia and vascular dementia. Acta Neurol Scand, 2002. 105(4): p. 261-9.
8. Foster, N.L., et al., FDG-PET improves accuracy in distinguishing frontotemporal dementia and Alzheimer's disease. Brain, 2007. 130(Pt 10): p. 2616-35.
9. Kanda, T., et al., Comparison of grey matter and metabolic reductions in frontotemporal dementia using FDG-PET and voxel-based morphometric MR studies. Eur J Nucl Med Mol Imaging, 2008. 35(12): p. 2227-34.
10. Fischl, B., FreeSurfer. Neuroimage, 2012. 62(2): p. 774-81.
11. Tustison, N.J., et al. The ANTs cortical thickness processing pipeline. in Medical Imaging 2013: Biomedical Applications in Molecular, Structural, and Functional Imaging. 2013. International Society for Optics and Photonics.
12. Klein, A. and J. Tourville, 101 labeled brain images and a consistent human cortical labeling protocol. Front Neurosci, 2012. 6: p. 171.
13. Klein, A., Mindboggle-101 atlases (anatomical labels from a population of brains), A. Klein, Editor. 2016, Harvard Dataverse.
Figures