1457
Pathway-specific polygenic scores for Alzheimer’s disease are associated with multi-modal structural brain imaging markers in young adults1CUBRIC, CUBRIC, Cardiff University, Cardiff, United Kingdom, 2MRC Centre for Neuropsychiatric Genetics and Genomics, Cardiff University, Cardiff, United Kingdom, 3School for Mental Health and Neuroscience, Maastricht University, Maastricht, Netherlands
Synopsis
This study explores the relationship between structural brain measurements and novel pathway-specific polygenic scores for Alzheimer’s Disease (AD). We observed associations between the pathway-polygenic profiles, cortical thinning, and changes in white matter signal particularly in the fornix, which have been shown to be markers of Alzheimer’s degeneration, in our sample of healthy young adults. Surprisingly, despite the contribution of APOE to AD risk, the signal in the white matter was stronger when APOE was excluded from the polygenic scores.
Introduction
Late-onset Alzheimer’s Disease (AD) is a highly heritable condition. Many single nucleotide polymorphisms (SNPs) confer small increases in AD risk.1 These risk loci are clustered around genes involved in similar biological pathways.2 Polygenic risk scores (PRS) can be created using the weighted sum of risk SNPs, aggregating their effect genome-wide.3 Polygenic risk for AD is associated with changes in brain structure in in AD-vulnerable regions.4,5 We investigated whether novel pathway-specific PRS were associated with cortical thickness in the temporal and parietal lobes and diffusion MRI metrics in the fornix, cingulum and parahippocampal cingulum.Methods
Polygenic discovery & target datasetOur discovery dataset, used to identify relevant SNPs for polygenic analysis, was summary statistics from the latest meta-analysis of AD genome-wide association studies, including 94,437 individuals.1 The target sample (N = 578, all aged ~24) were from the Avon Longitudinal Study of Parents and Children.
Pathway analysis and polygenic scoring
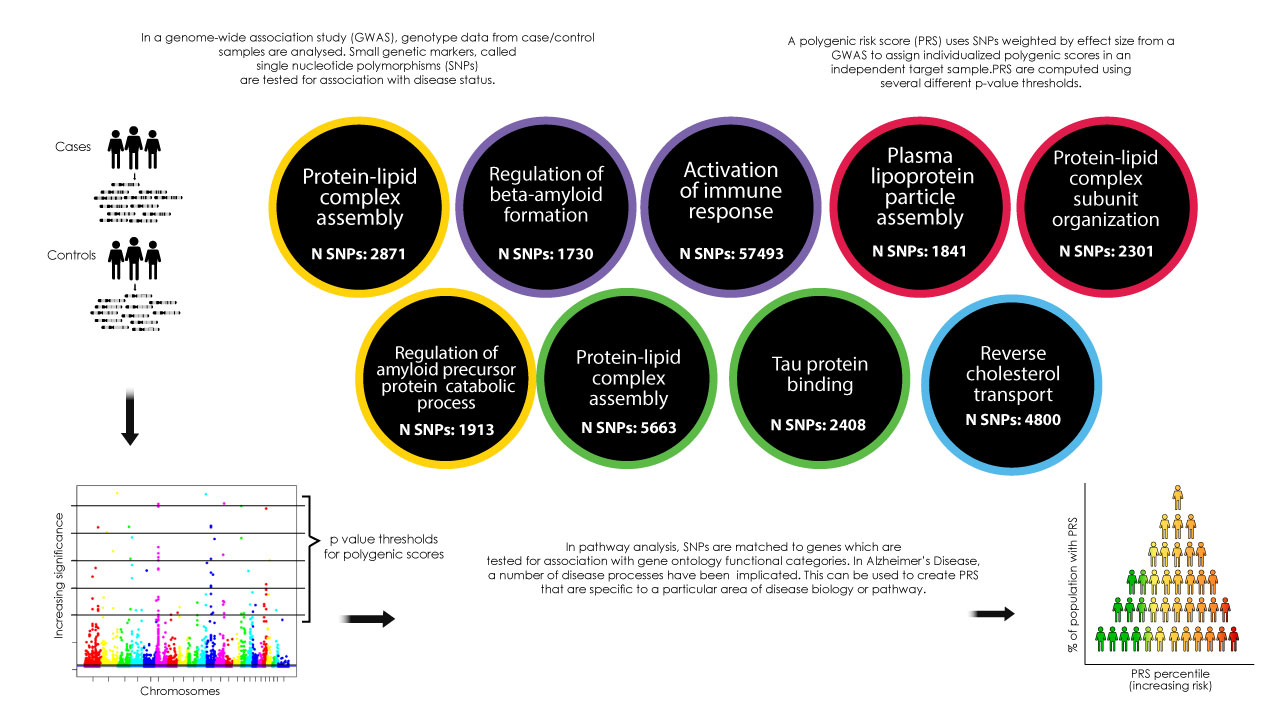
We mapped SNPs to nine pathways implicated in AD. The genetic data were pruned with r2 < 0.2, retaining those SNPs with the most significant p values. We selected a p value threshold of 0.001 to select relevant SNPs for our primary analysis, as previous studies suggested this might explain the most variance.5 For our secondary analysis we applied seven additional thresholds (p= 0.5, 0.3, 0.1, 0.01, 0.0001, 0.00001, 0.000001). Figure 1 summarizes the PRS methodology and disease pathway groups.
Image acquisition & preprocessing
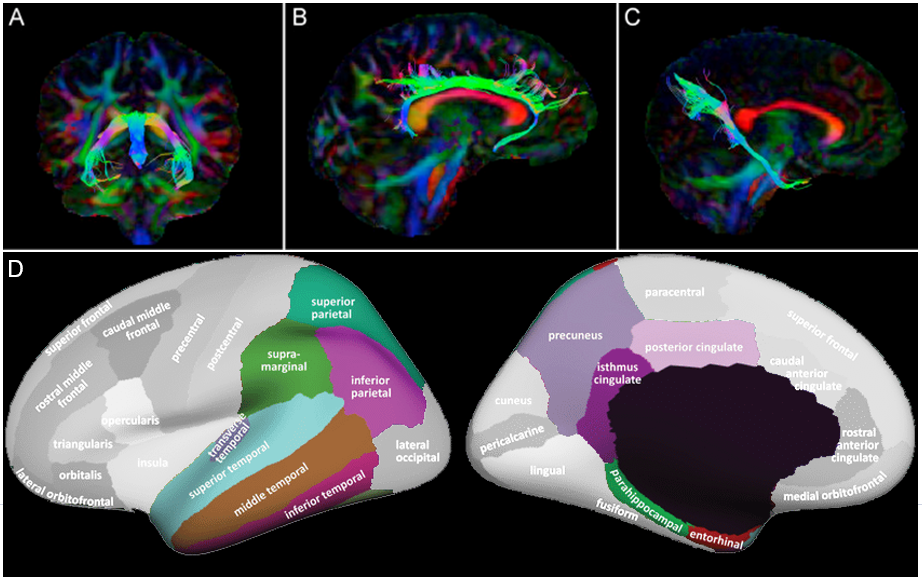
MRI was carried out on a GE Signa HDx 3T scanner at Cardiff University Brain Research Imaging Centre (CUBRIC). T1-weighted structural data were acquired using an axial three-dimensional fast, spoiled gradient recalled sequence: repetition time/echo time/inversion time = 8/3/450 ms; flip angle = 20°; 1 mm isotropic resolution; field of view ranged from 256 × 192 × 160 mm3 to 256 × 256 × 256 mm3 (anterior–posterior/left–right/superior–inferior), acquisition time approximately 6-10 minutes. Diffusion data were acquired using a cardiac-gated sequence: b-values 0 and 1200 s/mm2, repetition time ~20 seconds (depending on heart rate); echo time = 90 ms; 60 2.4-mm slices aligned with the anterior commissure-posterior commissure, zero slice gap; acquisition matrix 96 × 96; field of view = 230 mm; 2.4-mm isotropic resolution. Data were acquired either from 30 unique diffusion directions and 3 b0 images or from a subsample of 30 optimal directions from an acquired set of 60 directions with the first 3 b0 images. FreeSurfer was used to calculate cortical thickness in temporal and parietal regions. ExploreDTI was used to extract mean diffusivity (MD) and fractional anisotropy (FA) for the cingulum and parahippocampal cingulate (left and right) and the fornix (Figure 2).
Statistical analysis
We used linear regression to test for correlations between AD pathway-specific PRS and MRI measures, adjusting for sex and intracranial volume for cortical measurements and sex for diffusion metrics.
Results
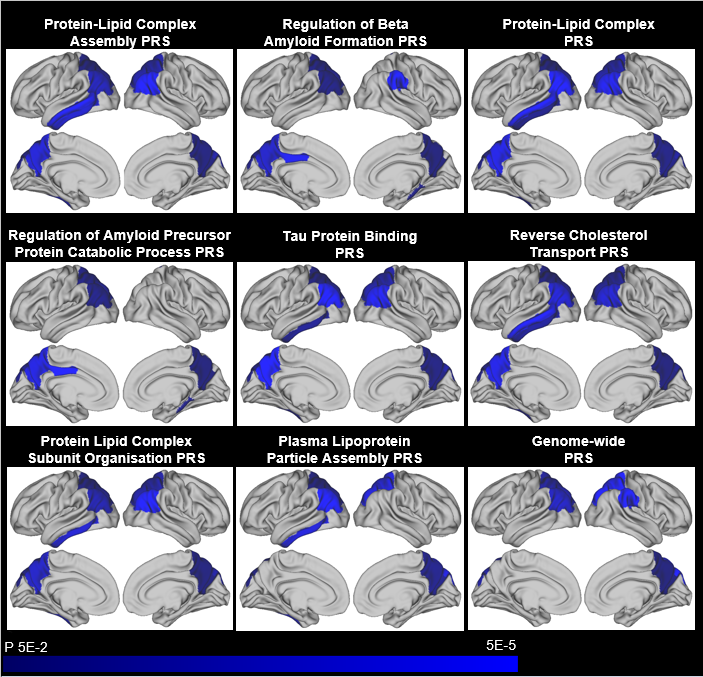
Cortical thicknessThere were significant negative association between cortical thickness in parietal and temporal regions and increased PRS at a p threshold of 0.001 (see Figure 3). There were no significant positive associations. These results attenuated slightly when APOE was excluded from the PRS although a number remained nominally significant, chiefly in parietal areas, and particularly for the Protein Lipid Complex Subunit Organisation Pathway. The pathway-specific PRS explained more of the variance than the genome-wide PRS. Further analysis using a range of p thresholds showed the same direction of effect, with many associations remaining at more conservative thresholds.
White matter metrics
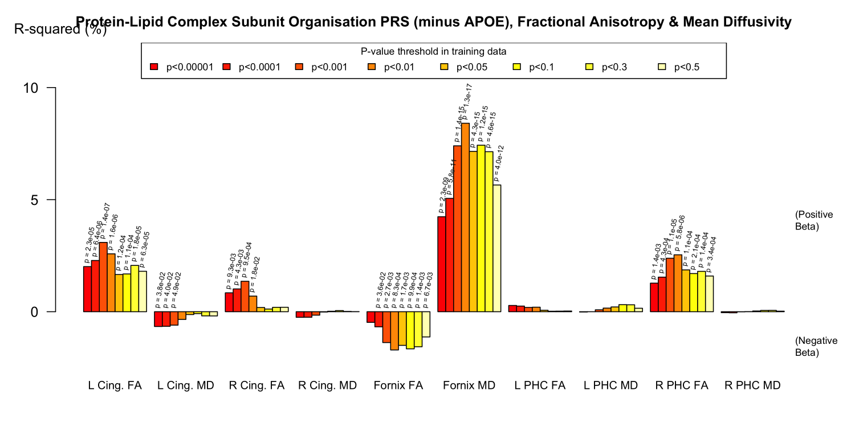
There were some nominally significant associations with FA and MD in the fornix, cingulum and parahippocampal cingulate when APOE was included in the PRS. However, when APOE was removed, there were strong associations with the fornix, particularly between with increased MD and reduced FA. This pattern was evident in all but the Protein Lipid Complex and Plasma Lipoprotein Assembly PRS (Figure 4). Again, the pathway-specific PRS explained more of the variance than the genome-wide PRS.
Discussion
To our knowledge, this is the first time that pathway-specific PRS have been used to explore brain structure in young adults. Our results show that pathway-specific PRS were associated with cortical thinning and changes in white matter metrics in areas known to be susceptible to AD pathology. Previous studies have reported similar findings (cortical thinning, reduced FA and increased MD in the fornix) in those at high risk of AD or with early symptoms. Whilst the signal in the cortex appears to be partly driven by APOE, effects in white matter were stronger when APOE was removed, suggesting that the other risk loci may be more relevant to white matter changes in AD. In both the cortex and the white matter, pathway-specific PRS explained more variance than genome-wide PRS, which suggests that the using loci known to be involved in AD processes may reduce noise inherent in PRS.Conclusion
This study shows links between pathway-specific AD PRS and structural brain changes known to be associated with AD in young adults, decades before potential illness onset. Focusing on SNPs involved in disease processes may refine PRS to better explain early brain changes. If genetic risk for disease pathways in AD can be linked to structural differences in the brain, it could be used to stratify entrants to clinical trials.Acknowledgements
JH was funded by a Wellcome Trust GW4 Clinical Academic Fellowship. We are extremely grateful to all the families who took part in this study, the midwives for their help in recruiting them, and the whole ALSPAC team, which includes interviewers, computer and laboratory technicians, clerical workers, research scientists, volunteers, managers, receptionists and nurses.
References
1. Kunkle BW, Grenier-Boley B, Sims R, et al. Genetic meta-analysis of diagnosed Alzheimer’s disease identifies new risk loci and implicates Aβ, tau, immunity and lipid processing. Nat Genet. 2019;51(3):414-430. doi:10.1038/s41588-019-0358-2
2. Jones L, Holmans PA, Hamshere ML, et al. Genetic evidence implicates the immune system and cholesterol metabolism in the aetiology of Alzheimer’s disease. PLoS One. 2010;5(11):e13950.
3. Escott-Price V, Shoai M, Pither R, Williams J, Hardy J. Polygenic score prediction captures nearly all common genetic risk for Alzheimer’s disease. Neurobiol Aging. 2017;49:214.e7-214.e11. doi:10.1016/j.neurobiolaging.2016.07.018
4. Sabuncu MR, Buckner RL, Smoller JW, Lee PH, Fischl B, Sperling RA. The association between a polygenic Alzheimer score and cortical thickness in clinically normal subjects. Cereb cortex. 2012;22(11):2653-2661.
5. Foley SF, Tansey KE, Caseras X, et al. Multimodal Brain Imaging Reveals Structural Differences in Alzheimer’s Disease Polygenic Risk Carriers: A Study in Healthy Young Adults. Biol Psychiatry. 2017;81(2):154-161. doi:10.1016/j.biopsych.2016.02.033
Figures