1456
Longitudinal trajectory of fibre-specific degeneration in Alzheimer’s disease and mild cognitive impairment1Florey Institute of Neuroscience and Mental Health, Melbourne, Australia, 2Florey Department of Neuroscience and Mental Health, University of Melbourne, Melbourne, Australia, 3Department of Medicine, Austin Health, University of Melbourne, Melbourne, Australia, 4Department of Molecular Imaging & Therapy, Centre for PET, Austin Health, Heidelberg, Australia
Synopsis
Alzheimer’s disease (AD) is characterised by degeneration of specific white matter tracts, however the longitudinal trajectory of tract-specific decline has not yet been well described. In this work, we utilise a longitudinal fixel-based analysis framework to investigate specific fibre tracts that exhibit accelerated decline in AD and mild cognitive impairment (MCI). Whole-brain analysis revealed that select fixels exhibit accelerated rates of decline in AD compared to healthy elderly controls, while MCI patients did not exhibit accelerated decline in any fibre structures. Tract-of-interest analysis revealed group differences in tract trajectories over time.
Introduction
Alzheimer’s disease (AD) is characterised by degeneration to specific white matter fibre pathways1. However, the longitudinal trajectory of degeneration to these fibre tracts remains unclear. While longitudinal changes to white matter in AD have been described to some extent using diffusion tensor imaging (DTI)2,3, these studies have only explored within-group or between-group differences in DTI metrics at given time-points, rather than exploring dynamic longitudinal trajectories, and have been unable to assess tract-specific changes due to the inherent limitations of DTI4. In this study, we thus apply a longitudinal fixel-based analysis (FBA)5 framework to investigate fibre tracts that exhibit accelerated decline in AD and mild cognitive impairment (MCI) patients, and explore the longitudinal trajectory of tract-specific decline in these patients.Methods
Participants included in this study were recruited as part of the Australian Imaging, Biomarkers and Lifestyle (AIBL) study, and included AD patients (n=28), MCI patients (n=16), and healthy elderly control subjects (n=75). Participants underwent MR imaging approximately every 18 months for up to 5 visits (approximately 7.5 years), with data available from 83 participants at their baseline recruitment time-point, 106 participants at first follow-up, 90 participants at second follow-up, 82 participants at third follow-up, 65 participants at fourth follow-up, and 54 participants at fifth follow-up.DWI data were acquired on a 3T Siemens Tim Trio scanner (2.3mm3 isotropic voxels, 60 directions at b=3000s/mm2, 8 b=0 images), and pre-processed. FODs were computed with single-shell, 3-tissue constrained spherical deconvolution6,7, and spatial correspondence was achieved by creating an unbiased longitudinal template (first creating intra-subject templates from 10 healthy controls, 10 MCI, and 10 AD subjects, then using the 30 intra-subject templates to generate a group-specific population template), and registering all FOD images to the template. Measures of fibre density (FD), fibre bundle cross-section (FC), and combined fibre density and cross-section (FDC) were obtained5. To identify white matter regions that exhibit different longitudinal trajectories in AD and MCI patients compared to healthy controls, we compared rate of change in a given fixel-based metric, using the two time-points that were furthest apart for a given subject, and computed the rate of change in the metric as follows (as an example, for FDC):
Rate of FDC change = (FDCfinal timepoint – FDCfirst timepoint)/time interval (years)
Statistical comparisons of rate of change of each fixel metric between groups were performed with Connectivity-based Fixel Enhancement (CFE)8 at each fixel using a General Linear Model.
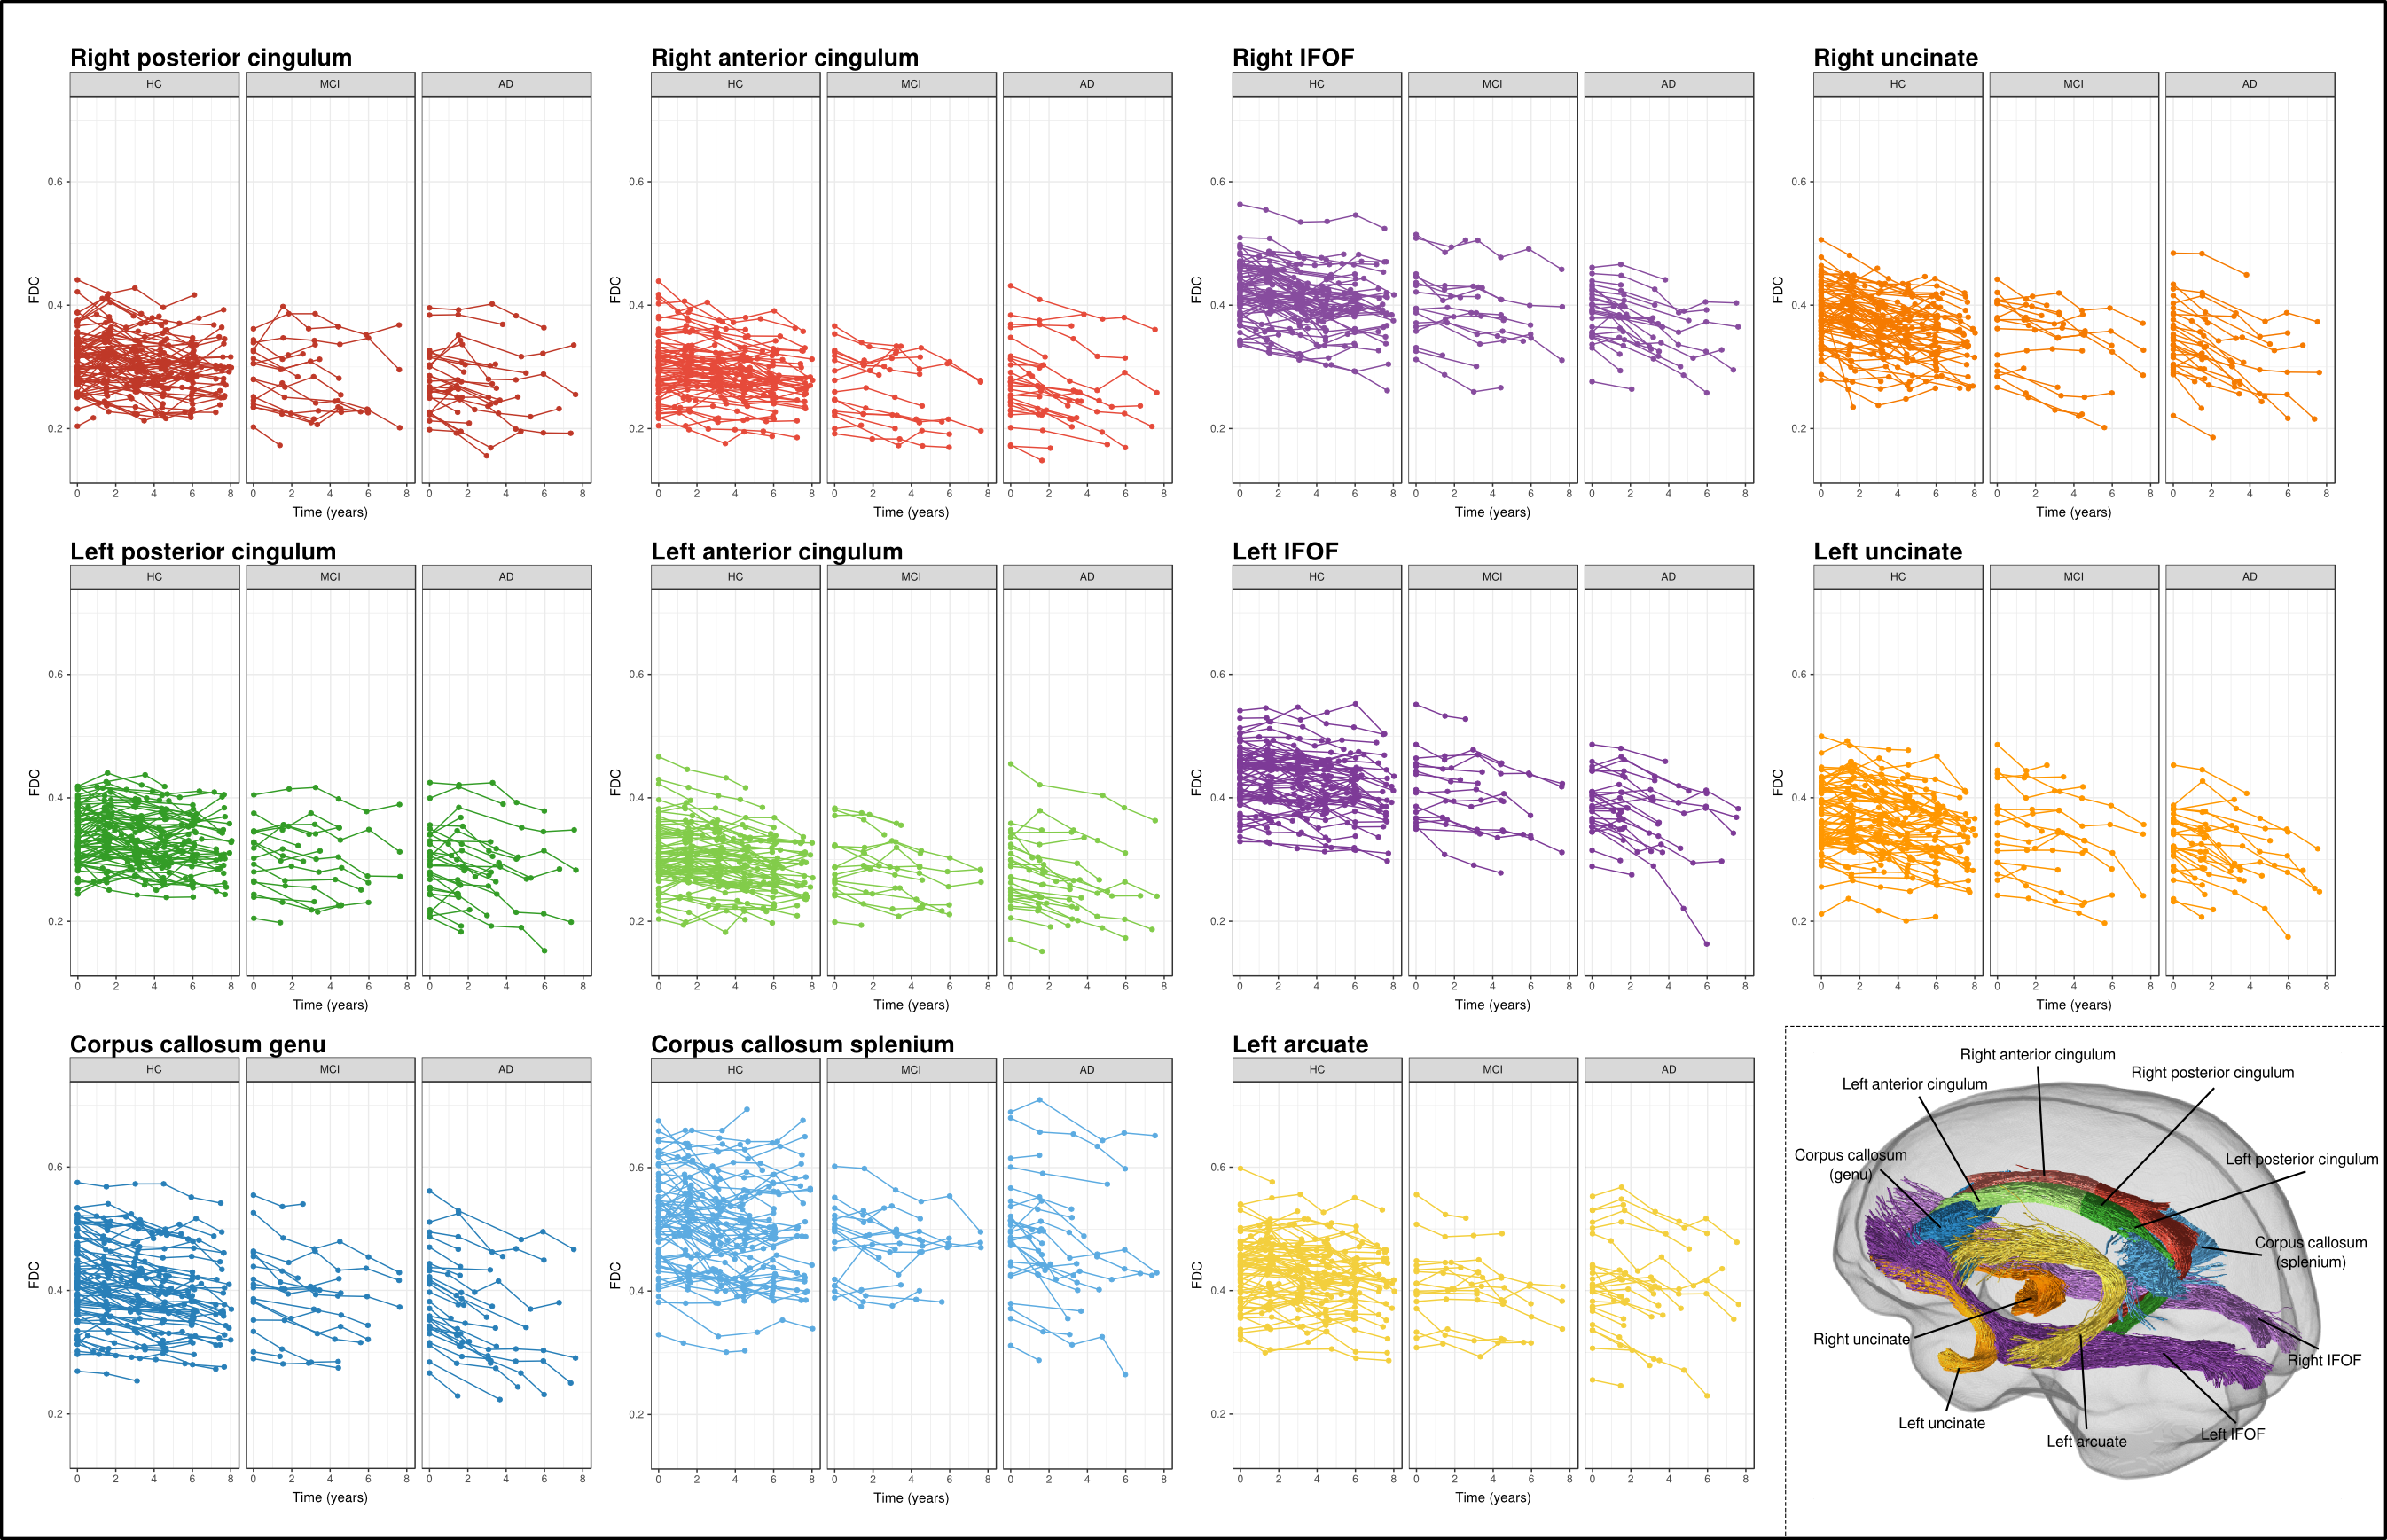
Subsequent tract-of-interest analysis was performed to explore longitudinal trajectories of FDC within select fibre tracts across all time-points. These tracts are shown in Figure 2, and were extract from the template tractogram using inclusion and exclusion regions-of-interest, and were selected on the basis of previous cross-sectional work that exhibited reduced FDC in AD patients compared to controls1. Mean FDC within each tract-of-interest was computed for each time-point. Linear mixed effects models9 were used to determine whether groups differed in FDC change over time. Random effect of subject was included, while fixed effects of interest included time (years) from baseline/first MRI, diagnostic group, and time-by-group interaction. Fixed effects of intracranial volume (ICV), sex, years of education, and amyloid status were also included. Together, these fixed effects allowed tract FDC to decline linearly with years from first MRI while testing the possibility of different trajectories of decline for different groups.
Results
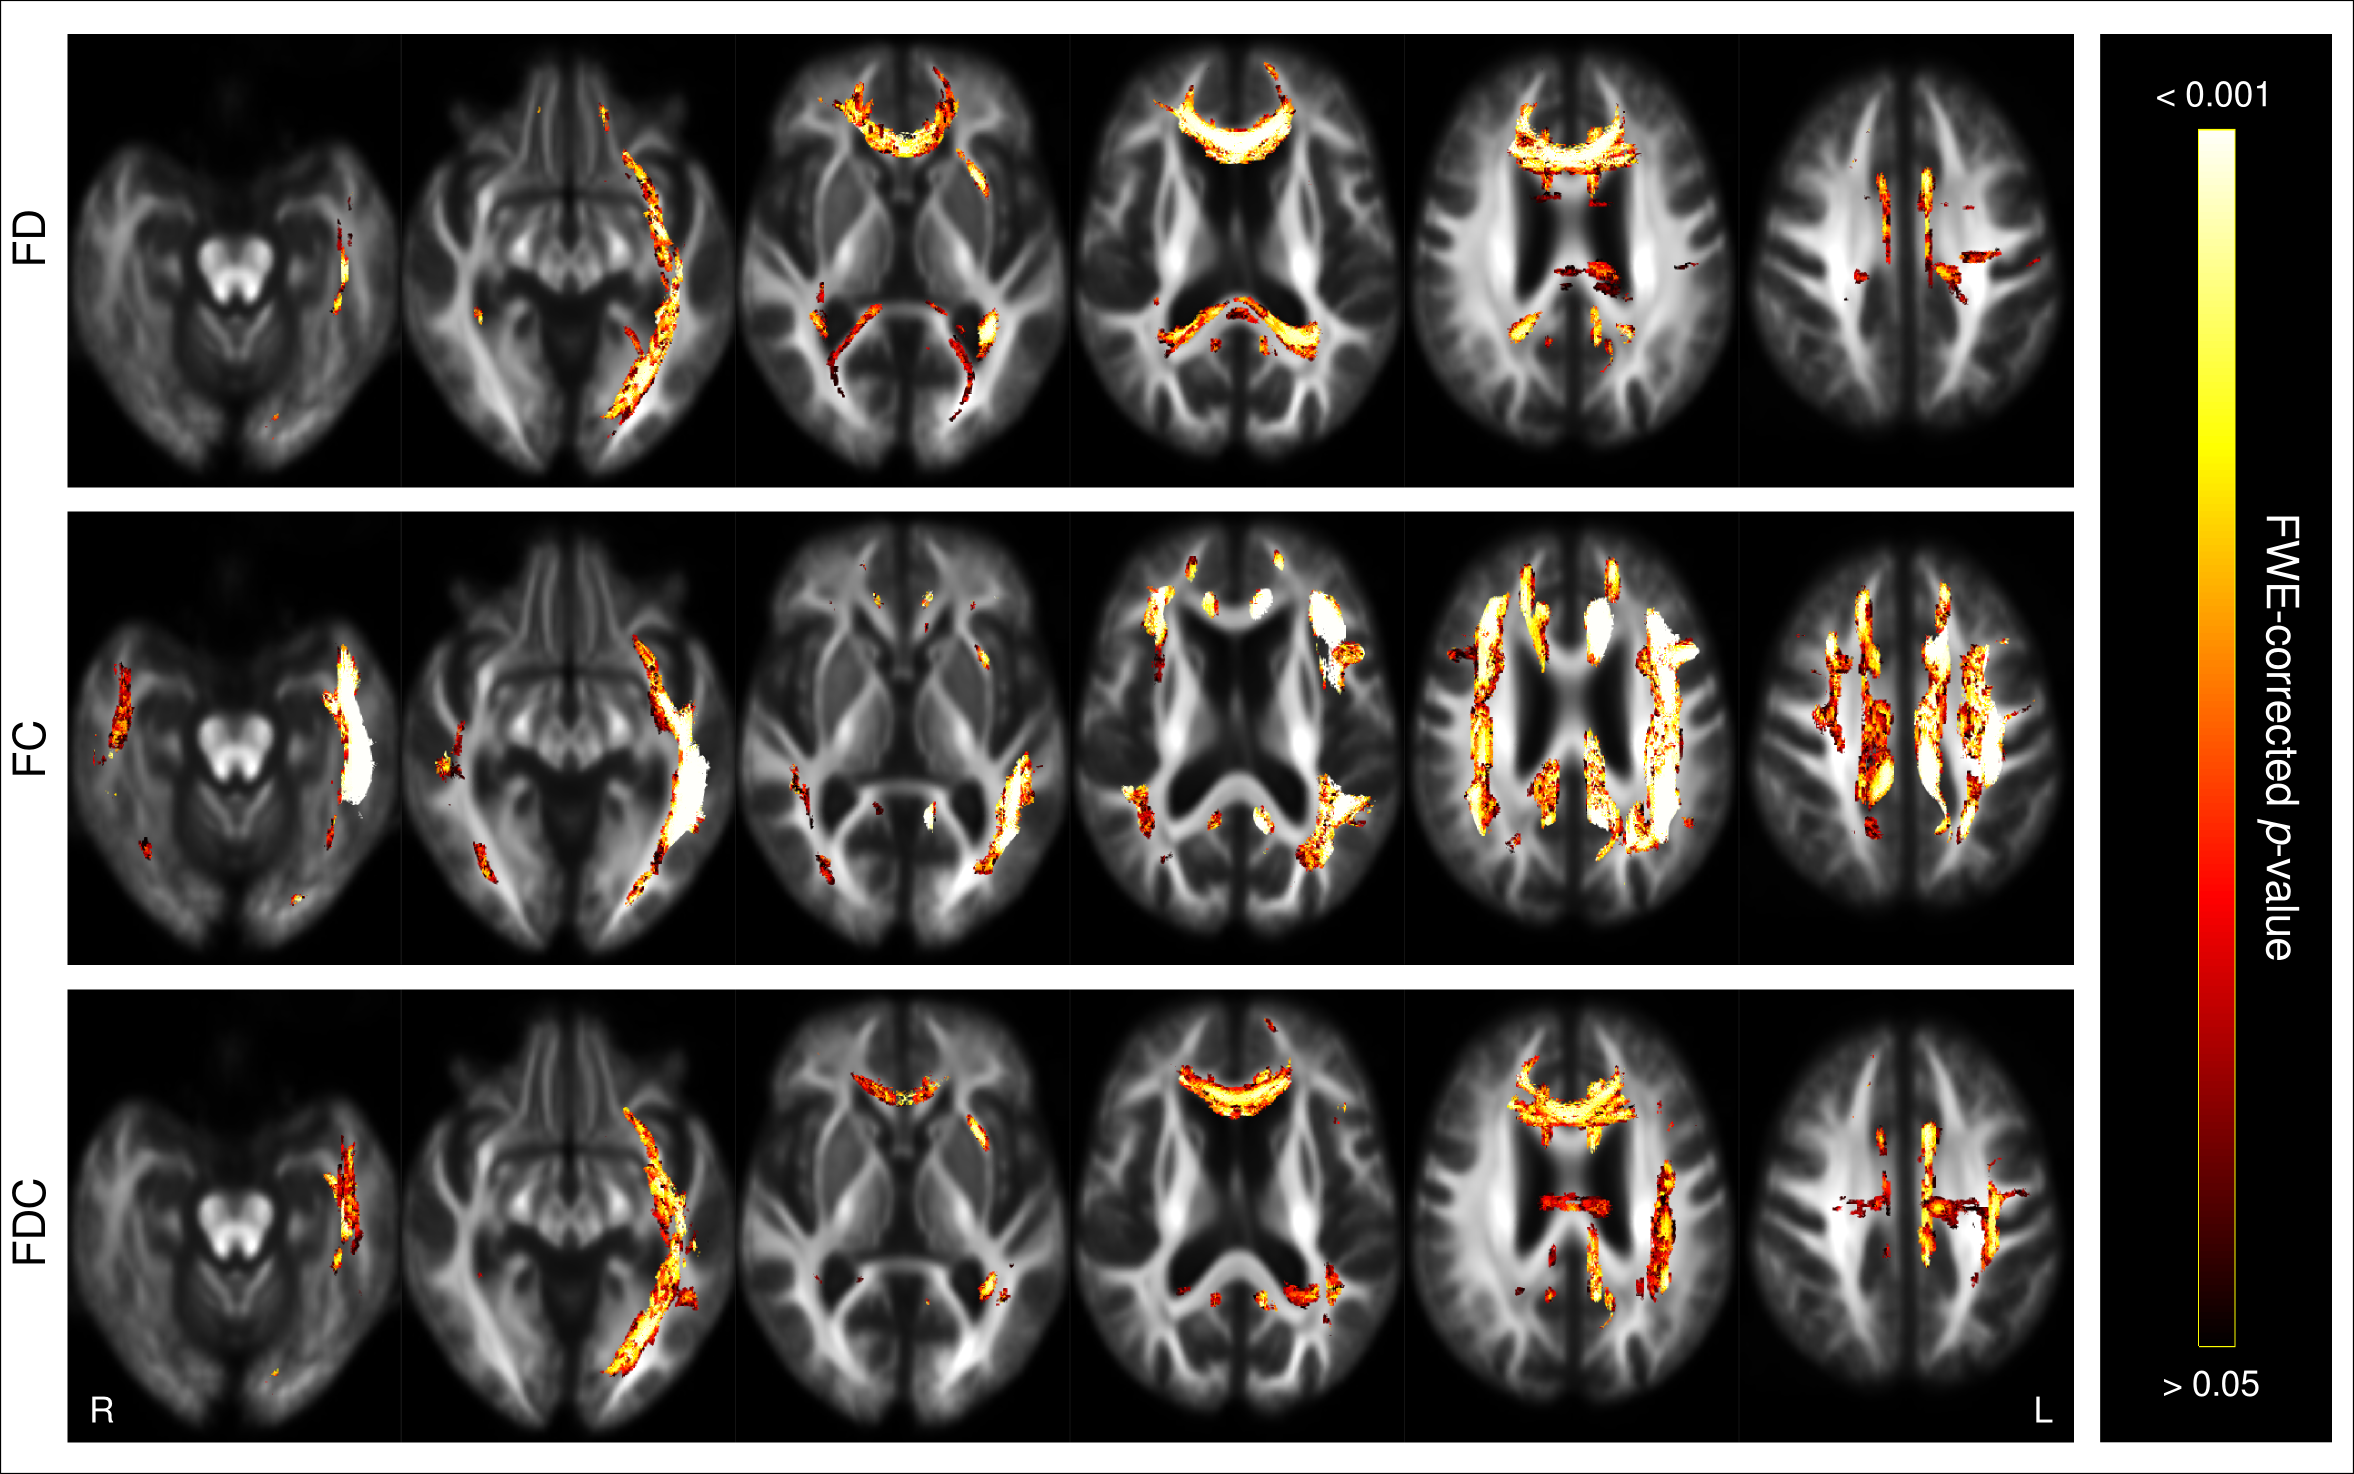
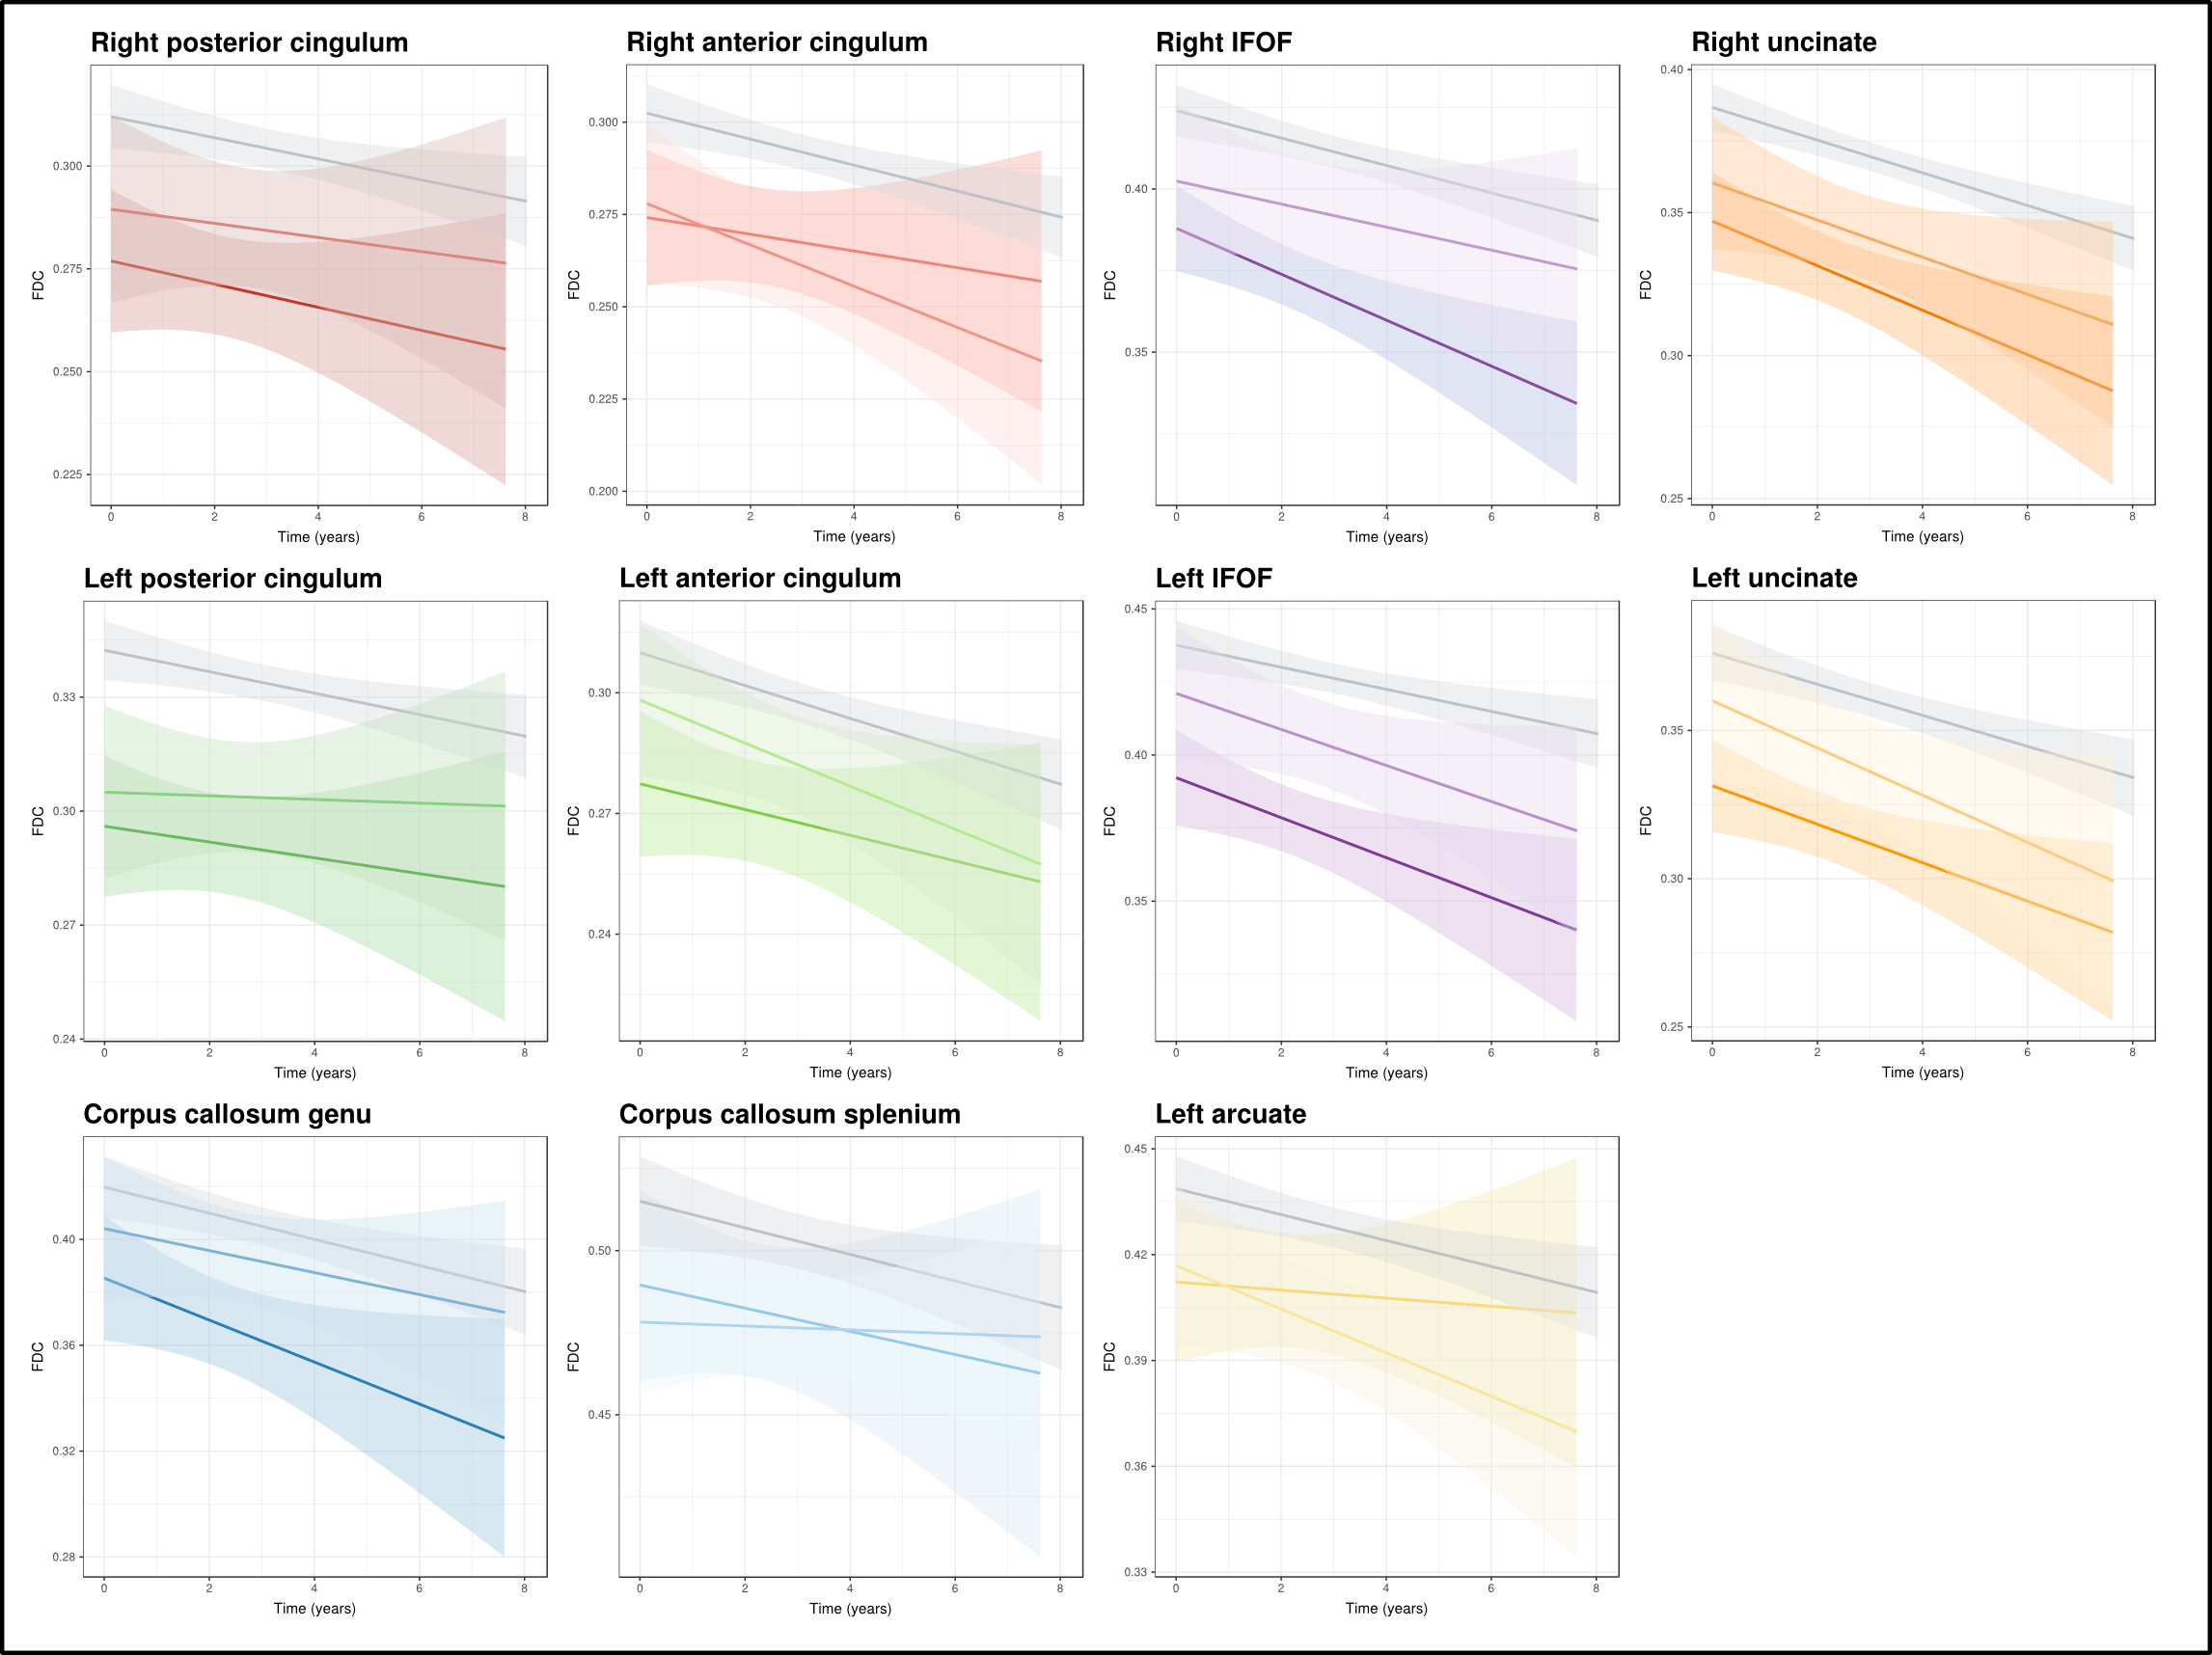
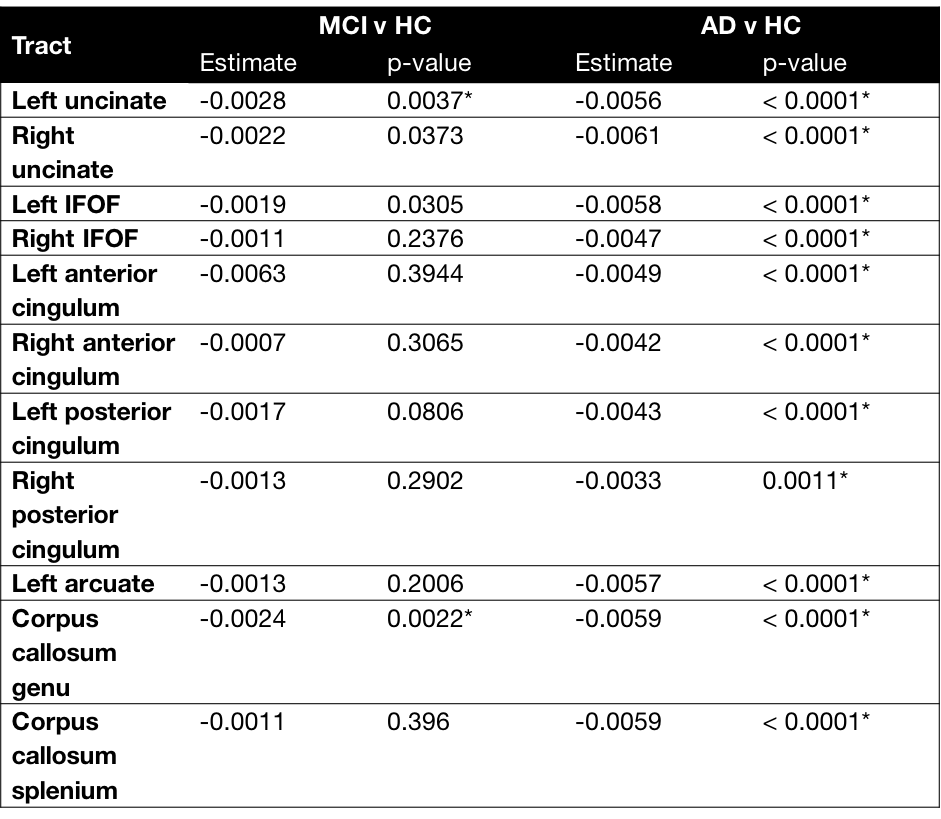
Whole-brain FBA revealed extensive white matter regions that exhibited significantly accelerated decline in FD, FC, and FDC in AD patients compared to control subjects (Figure 1). These regions included fibre tracts that were previously shown to exhibit degeneration from cross-sectional analyses1, such as the cingulum bundle, inferior fronto-occipital, arcuate and uncinate fasciculi, but were notably more pronounced on the left side than right. MCI patients did not exhibit significant differences in rate of decline in any of the fixel-based metrics when compared to control participants.Longitudinal trajectories in FDC within the select tracts-of-interest are shown in Figure 2 for each individual, by clinical group, while mean trajectories for each group are shown in Figure 3. Linear mixed effects models revealed statistically significant group differences in FDC changes over time. While significant differences were observed in all tract trajectories of AD patients compared to controls, effects were quite small (Table 2), and significant effects were largely driven by lower baseline FDC (Figure 3). When comparing MCI patients to controls, linear mixed models showed no significant difference in FDC change over time for any of the fibre tracts, except the left uncinate fasciculus (p = 0.0037) and the genu of the corpus callosum (p = 0.0022).
Discussion
This study is the first to our knowledge to investigate longitudinal white matter disruptions in AD and MCI using advanced diffusion metrics. Our whole-brain FBA results suggested that specific fixels exhibit accelerated decline in AD compared to healthy elderly individuals. However, when mean FDC across tracts was explored with tract-of-interest analyses, our findings suggested that the different tract trajectories in AD compared to healthy elderly individuals was primarily driven by lower baseline levels of tract FDC, rather than substantially accelerated rates of decline.Acknowledgements
RS is supported by fellowship funding from the National Imaging Facility (NIF), an Australian Government National Collaborative Research Infrastructure Strategy (NCRIS) capability.References
1. Mito R, Raffelt D, Dhollander T, et al. Fibre-specific white matter reductions in Alzheimer’s disease and mild cognitive impairment. Brain 2018;141(3):888–902.
2. Nowrangi MA, Lyketsos CG, Leoutsakos JM, et al. Longitudinal, region-specific course of diffusion tensor imaging measures in mild cognitive impairment and Alzheimer’s disease. Alzheimers Dement 2013;9(5):519–528.
3. Mayo CD, Mazerolle EL,
Ritchie L, et al. Longitudinal changes in microstructural white matter metrics
in Alzheimer’s disease. NeuroImage Clin. 2017;13:330–338.
4. Jones DK. Challenges and limitations of quantifying brain connectivity in vivo with diffusion MRI. Imaging Med. 2010;2(3):341–355.
5. Raffelt DA, Tournier J-D, Smith RE, et al. Investigating white matter fibre density and morphology using fixel-based analysis. Neuroimage 2017;144:58–73.
6. Dhollander T, Connelly A. A novel iterative approach to reap the benefits of multi-tissue CSD from just single-shell (+ b= 0) diffusion MRI data. Proc. Int. Soc. Magn. Reson. Med. Singapore, Singapore 2016;24:3010.
7. Dhollander T, Raffelt D, Connelly A. Unsupervised 3-tissue response function estimation from single-shell or multi-shell diffusion MR data without a co-registered T1 image. Proc. Int. Soc. Magn. Reson. Med. Work. Break. Barriers Diffus. MRI 2016;5
8. Raffelt DA, Smith RE, Ridgway GR, et al. Connectivity-based fixel enhancement: Whole-brain statistical analysis of diffusion MRI measures in the presence of crossing fibres. Neuroimage 2015;117:40–55.
9. Bates D, Mächler M, Bolker B, Walker S. Fitting linear mixed-effects models using lme4. arXiv Prepr. arXiv1406.5823 2014
Figures