1454
Association of PC-MRI measured Cerebroarterial Pulsatility with Cognitive Impairment and White Matter Hyperintensity in Aged Subjects1USC Stevens Neuroimaging and Informatics Institute, Keck School of Medicine, University of Southern California, Los Angeles, CA, United States, 2Department of Neurology, University of Southern California, Los Angeles, CA, United States
Synopsis
Elevated cerebroarterial pulsations due to arterial stiffness can impart abnormal forces to downstream capillary/tissue leading to microvascular damage, which are thought to be a contributing factor in the pathogenesis of neurodegenerative disorders such as Alzheimer’s disease and small vessel disease. In this study, we assessed the utility of two-dimensional (2D) phase-contrast MRI (PC-MRI) in quantifying cerebroarterial pulsations and evaluated the associations of pulsatile and non-pulsatile hemodynamic measures with cognitive performance and white matter hyperintensity (WMH). Our results indicated significant associations of PC-MRI derived pulsatility metrics with cognitive performance and WMH.
Introduction
Cerebrovascular risk factors are thought to play an important role in the pathogenesis of neurodegenerative disorders such as dementia and Alzheimer's disease (AD)1-3. Increased pulsatility of cerebral arteries has been found to be associated with cognitive decline in AD patients and has been suggested to be involved in conversion to dementia in subjects with mild cognitive impairment (MCI)4,5. Cerebroarterial pulsatility measures have been evaluated previously using transcranial doppler (TCD) sonography4,6,7. However, the efficient application of TCD depends on the availability of an acoustic window through the skull, which is known to be limited in older subjects8. In this study, we assessed the utility of 2D PC-MRI in quantifying cerebroarterial pulsations and evaluated the associations of pulsatile and non-pulsatile hemodynamic measures with cognitive performance and white matter hyperintensity (WMH).Methods
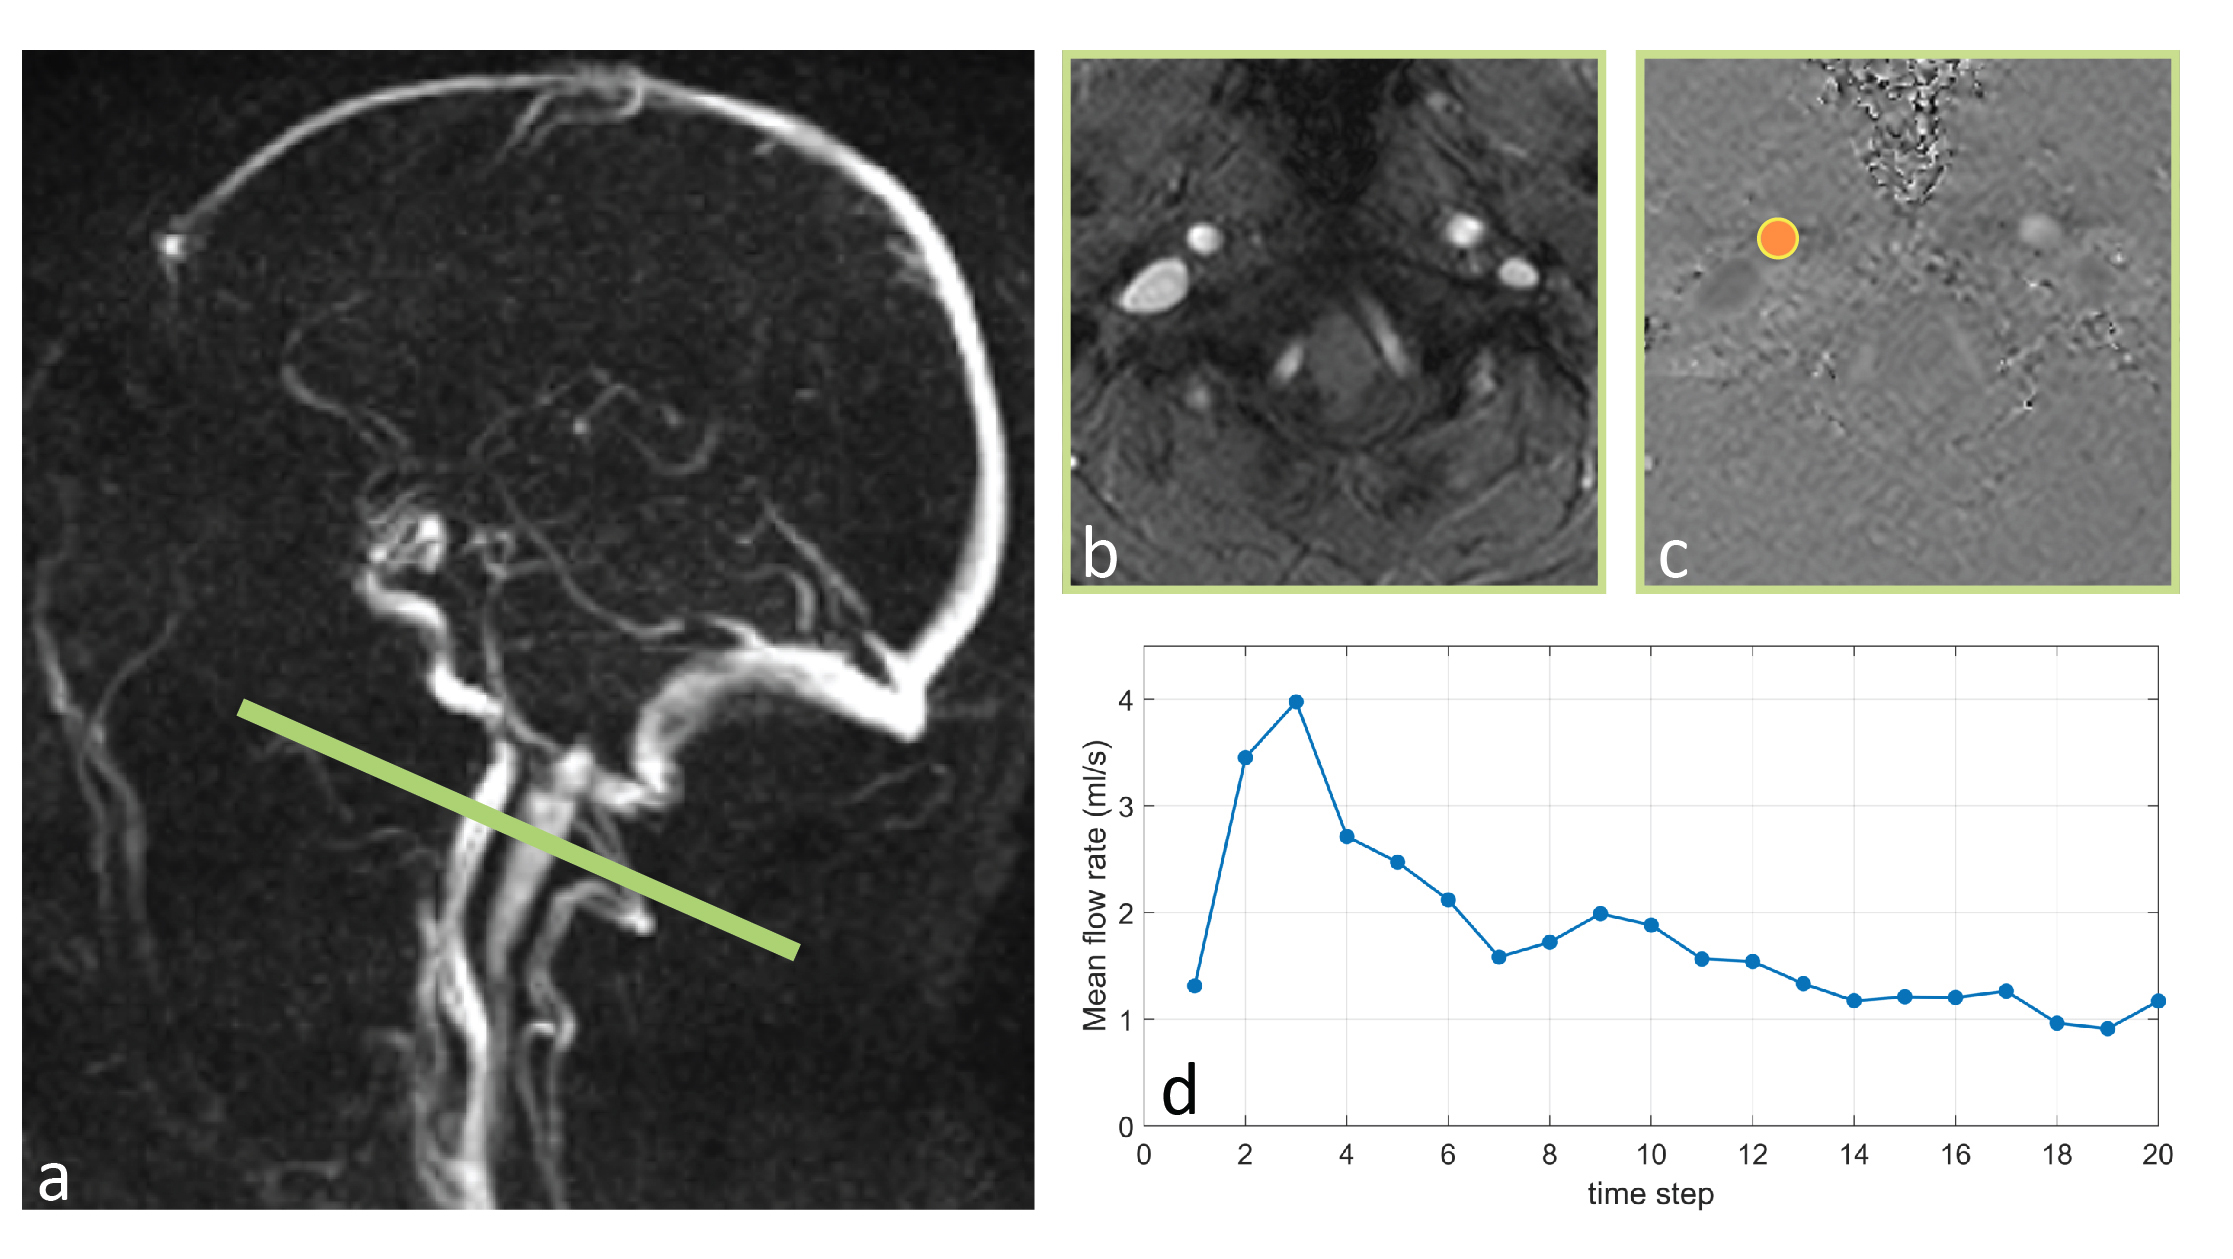
Participants and Imaging protocols: Fifty individuals (36 female, 69.1±6.9 years) were recruited. Participants underwent clinical and neurocognitive assessments, including the global clinical dementia rating (CDR)9 and the Montreal cognitive assessment (MoCA) test10.MRI measurements were carried out on a Siemens Prisma 3T Scanner. Blood flow waveforms of internal carotid arteries (ICAs) were measured using an ECG-triggered 2D PC-MRI sequence (resolution=0.5×0.5×5.0 mm3, VENC=100 cm/s, TE/TR=4.86/49.25 ms, flip angle=15°, figure 1-a). Whole-brain global cerebral blood flow (gCBF) was measured using pCASL with 3D GRASE sequence (TR/TE=4300/36.76ms, labeling duration=1.5s, post labeling delay=2000ms, number of slices=48, resolution=2.5×2.5×2.5 mm). A three-dimensional T2‐weighted FLAIR sequence was also performed to assess WMH. 24 subjects underwent test-retest PC-MRI scans with ~6 weeks apart.
Data analysis and statistics: PC-MRI data were processed using an in-house software written in MATLAB. For each PC-MRI dataset, an ROI encompassing the ICA was generated by thresholding the structural image and was applied to the corresponding phase images to obtain ICA blood flow waveform (Q) across a cardiac cycle. Mean flow rate (Qmean), pulsatility index (PI), and resistivity index (RI) were calculated as follows:
$$PI=\frac{Q_{max}-Q_{min}}{Q_{mean}}$$
$$RI=\frac{Q_{max}-Q_{min}}{Q_{max}}$$
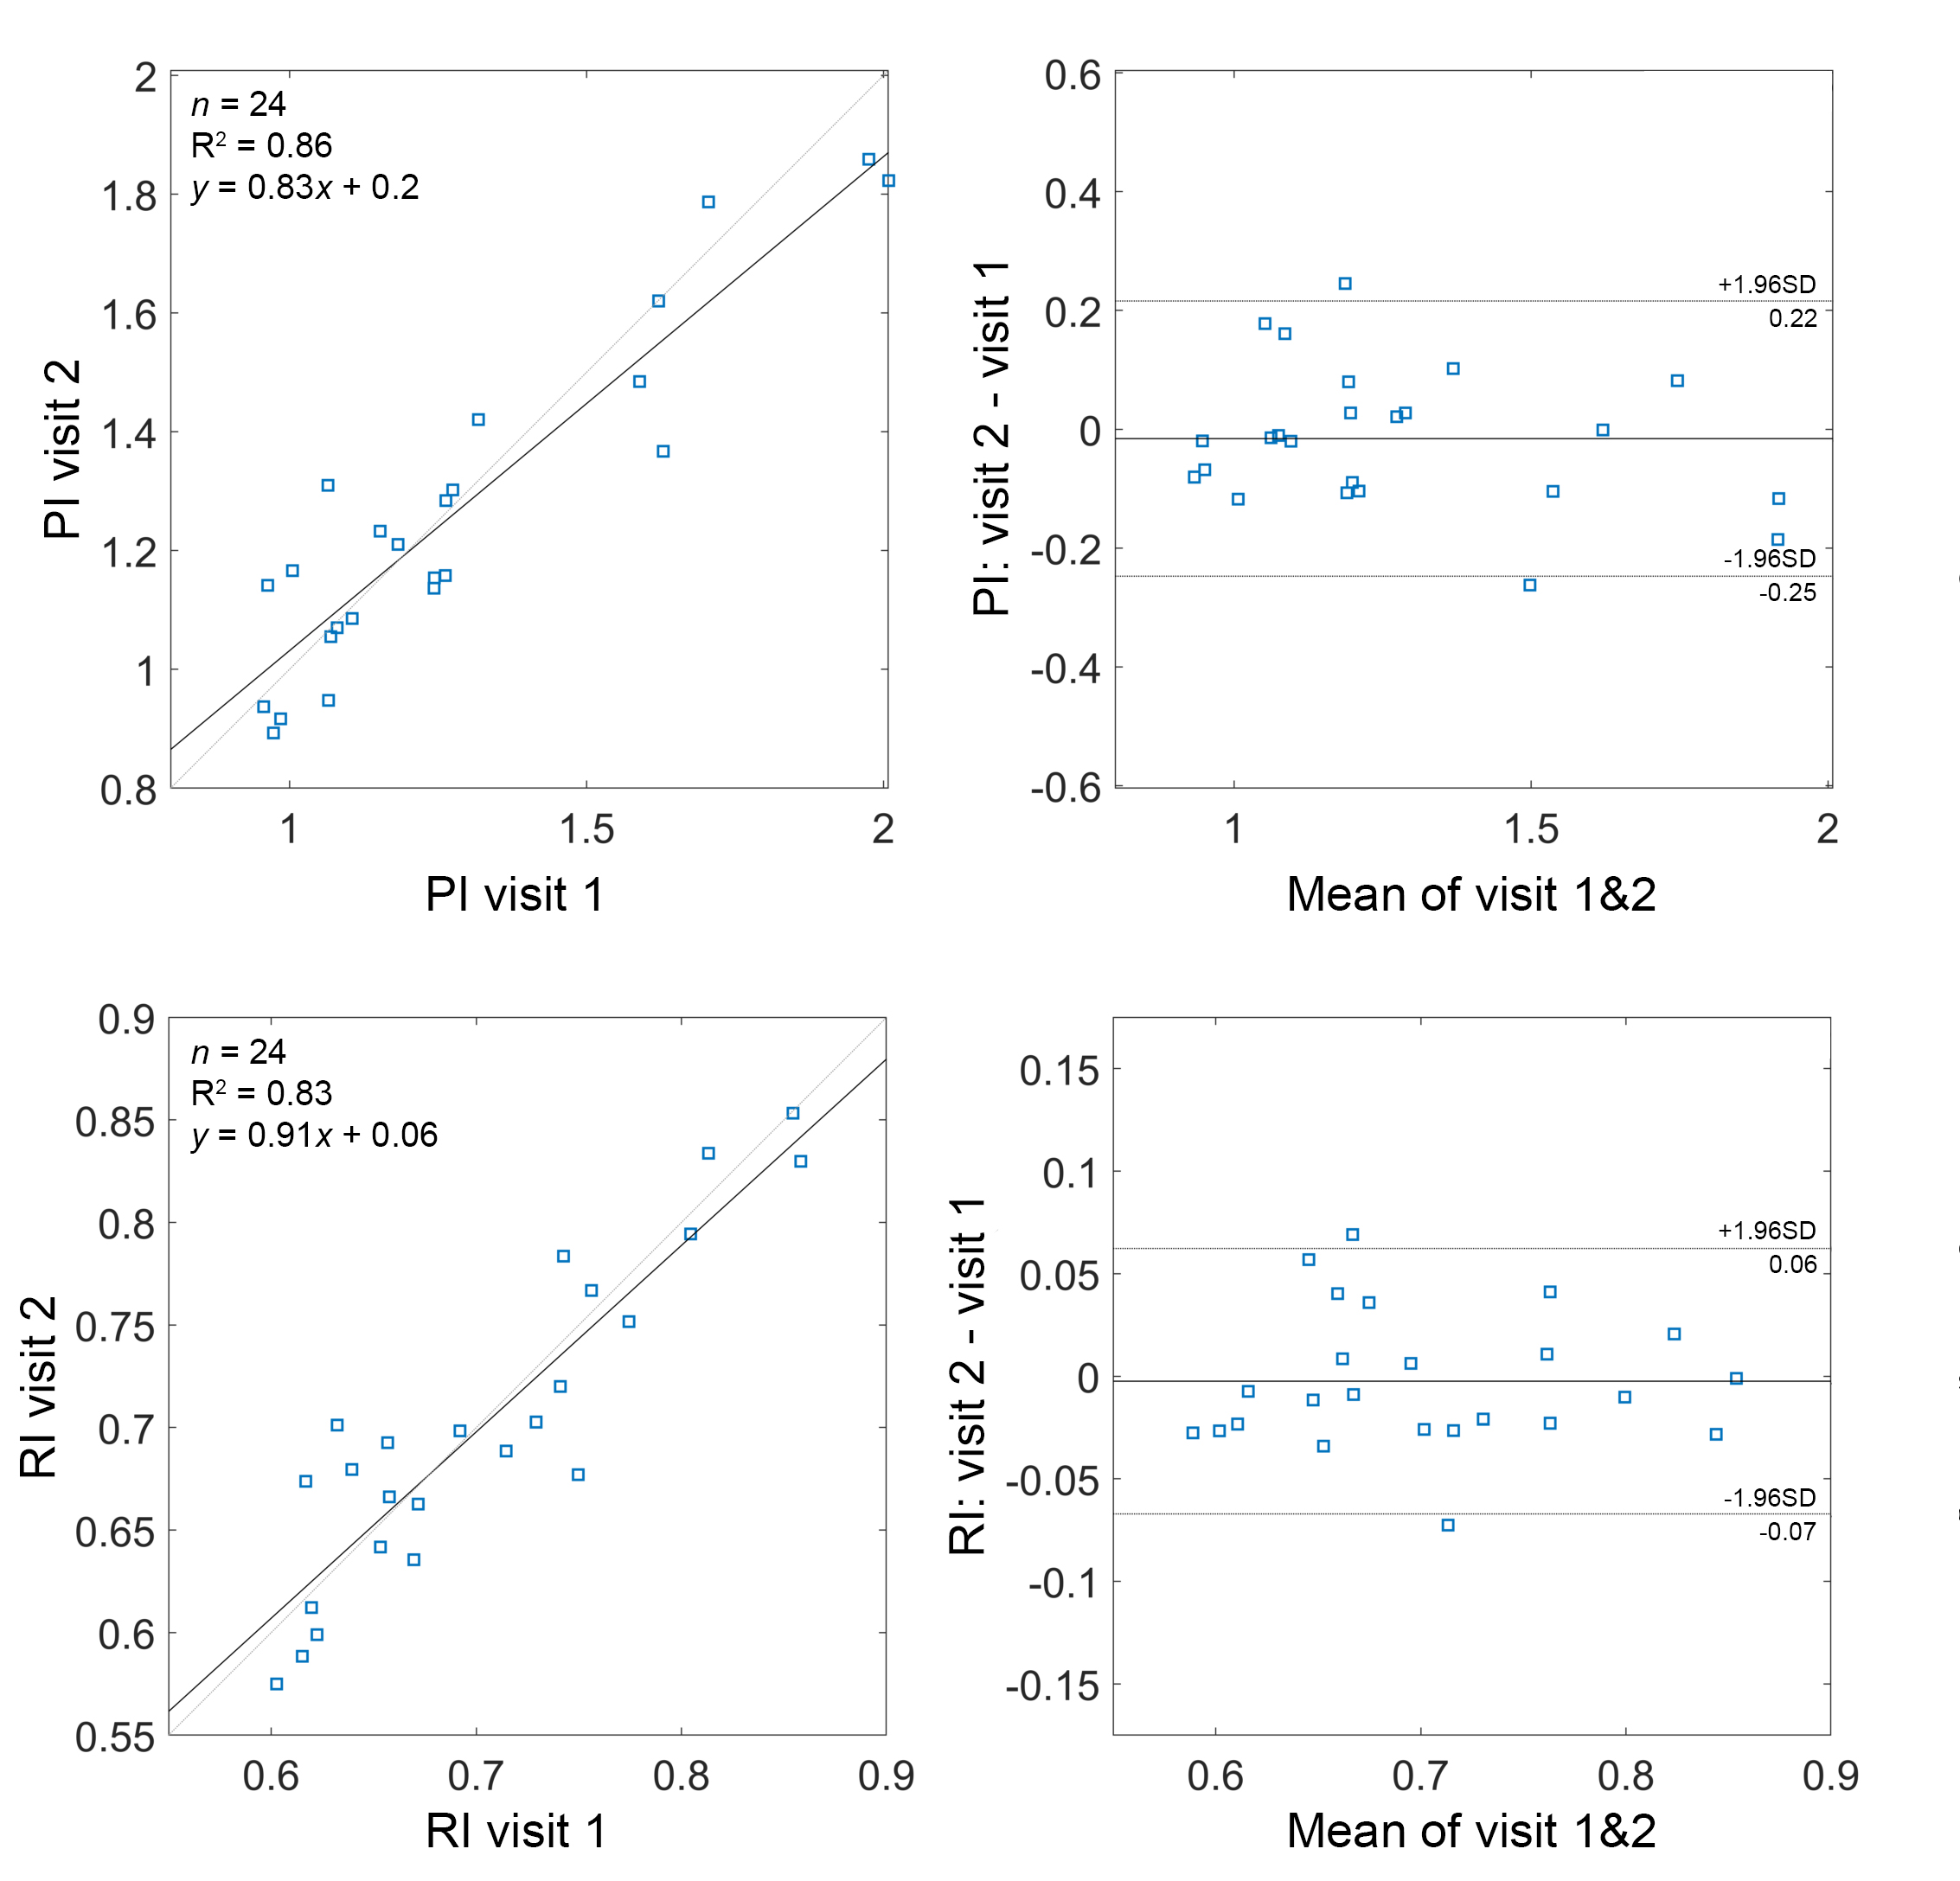
WMH volumes were measured on FLAIR images using the semi-automatic segmentation tool in ITK-SNAP11.Repeatability of PI and RI was evaluated using the Bland-Altman analysis and intraclass correlation coefficient (ICC). Generalized Estimating Equations method was used to assess associations (i) between MRI-measured cerebral hemodynamics parameters (PI, RI, mean flow rate, and gCBF) and cognitive performance (MoCA and CDR scores) and (ii) between cerebral hemodynamic parameters and WMH volume. All regression models were adjusted for age and gender. Regression models involving cognitive performance scores were additionally adjusted for years of education. The capability of various hemodynamic measures in distinguishing participants with cognitive impairment (CDR=0.5) was assessed using receiver-operating characteristic (ROC) curves.
Results
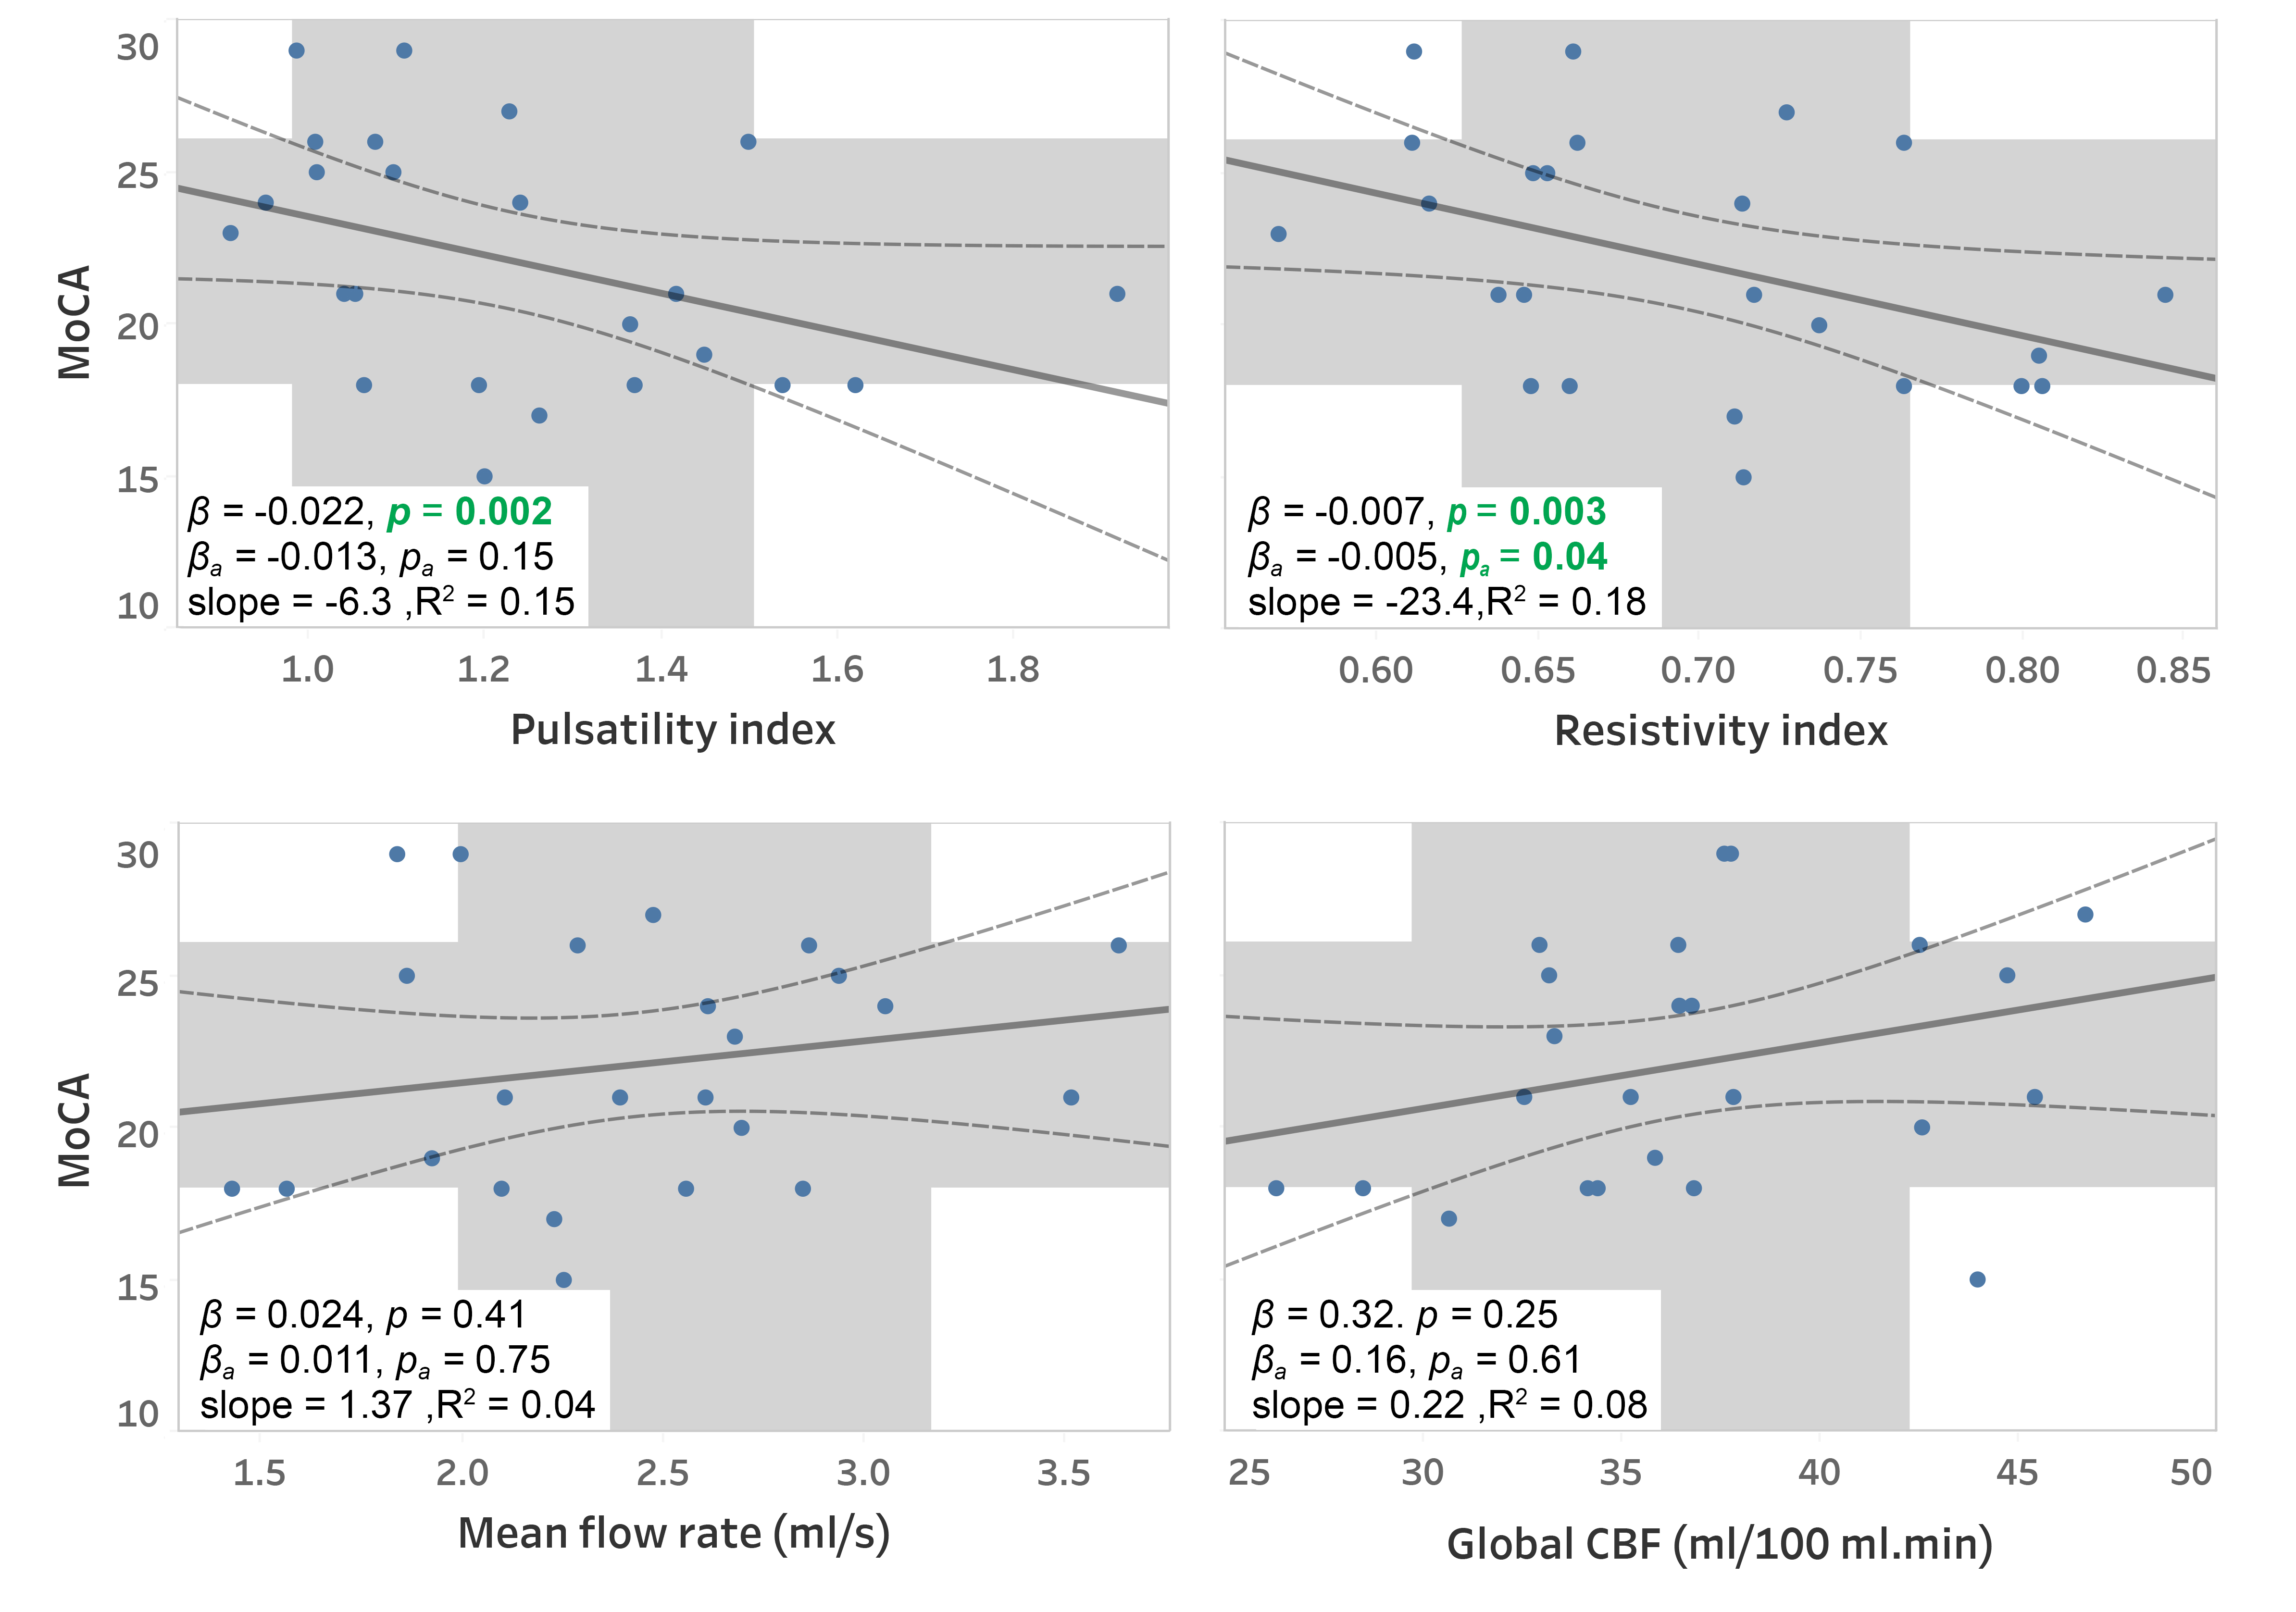
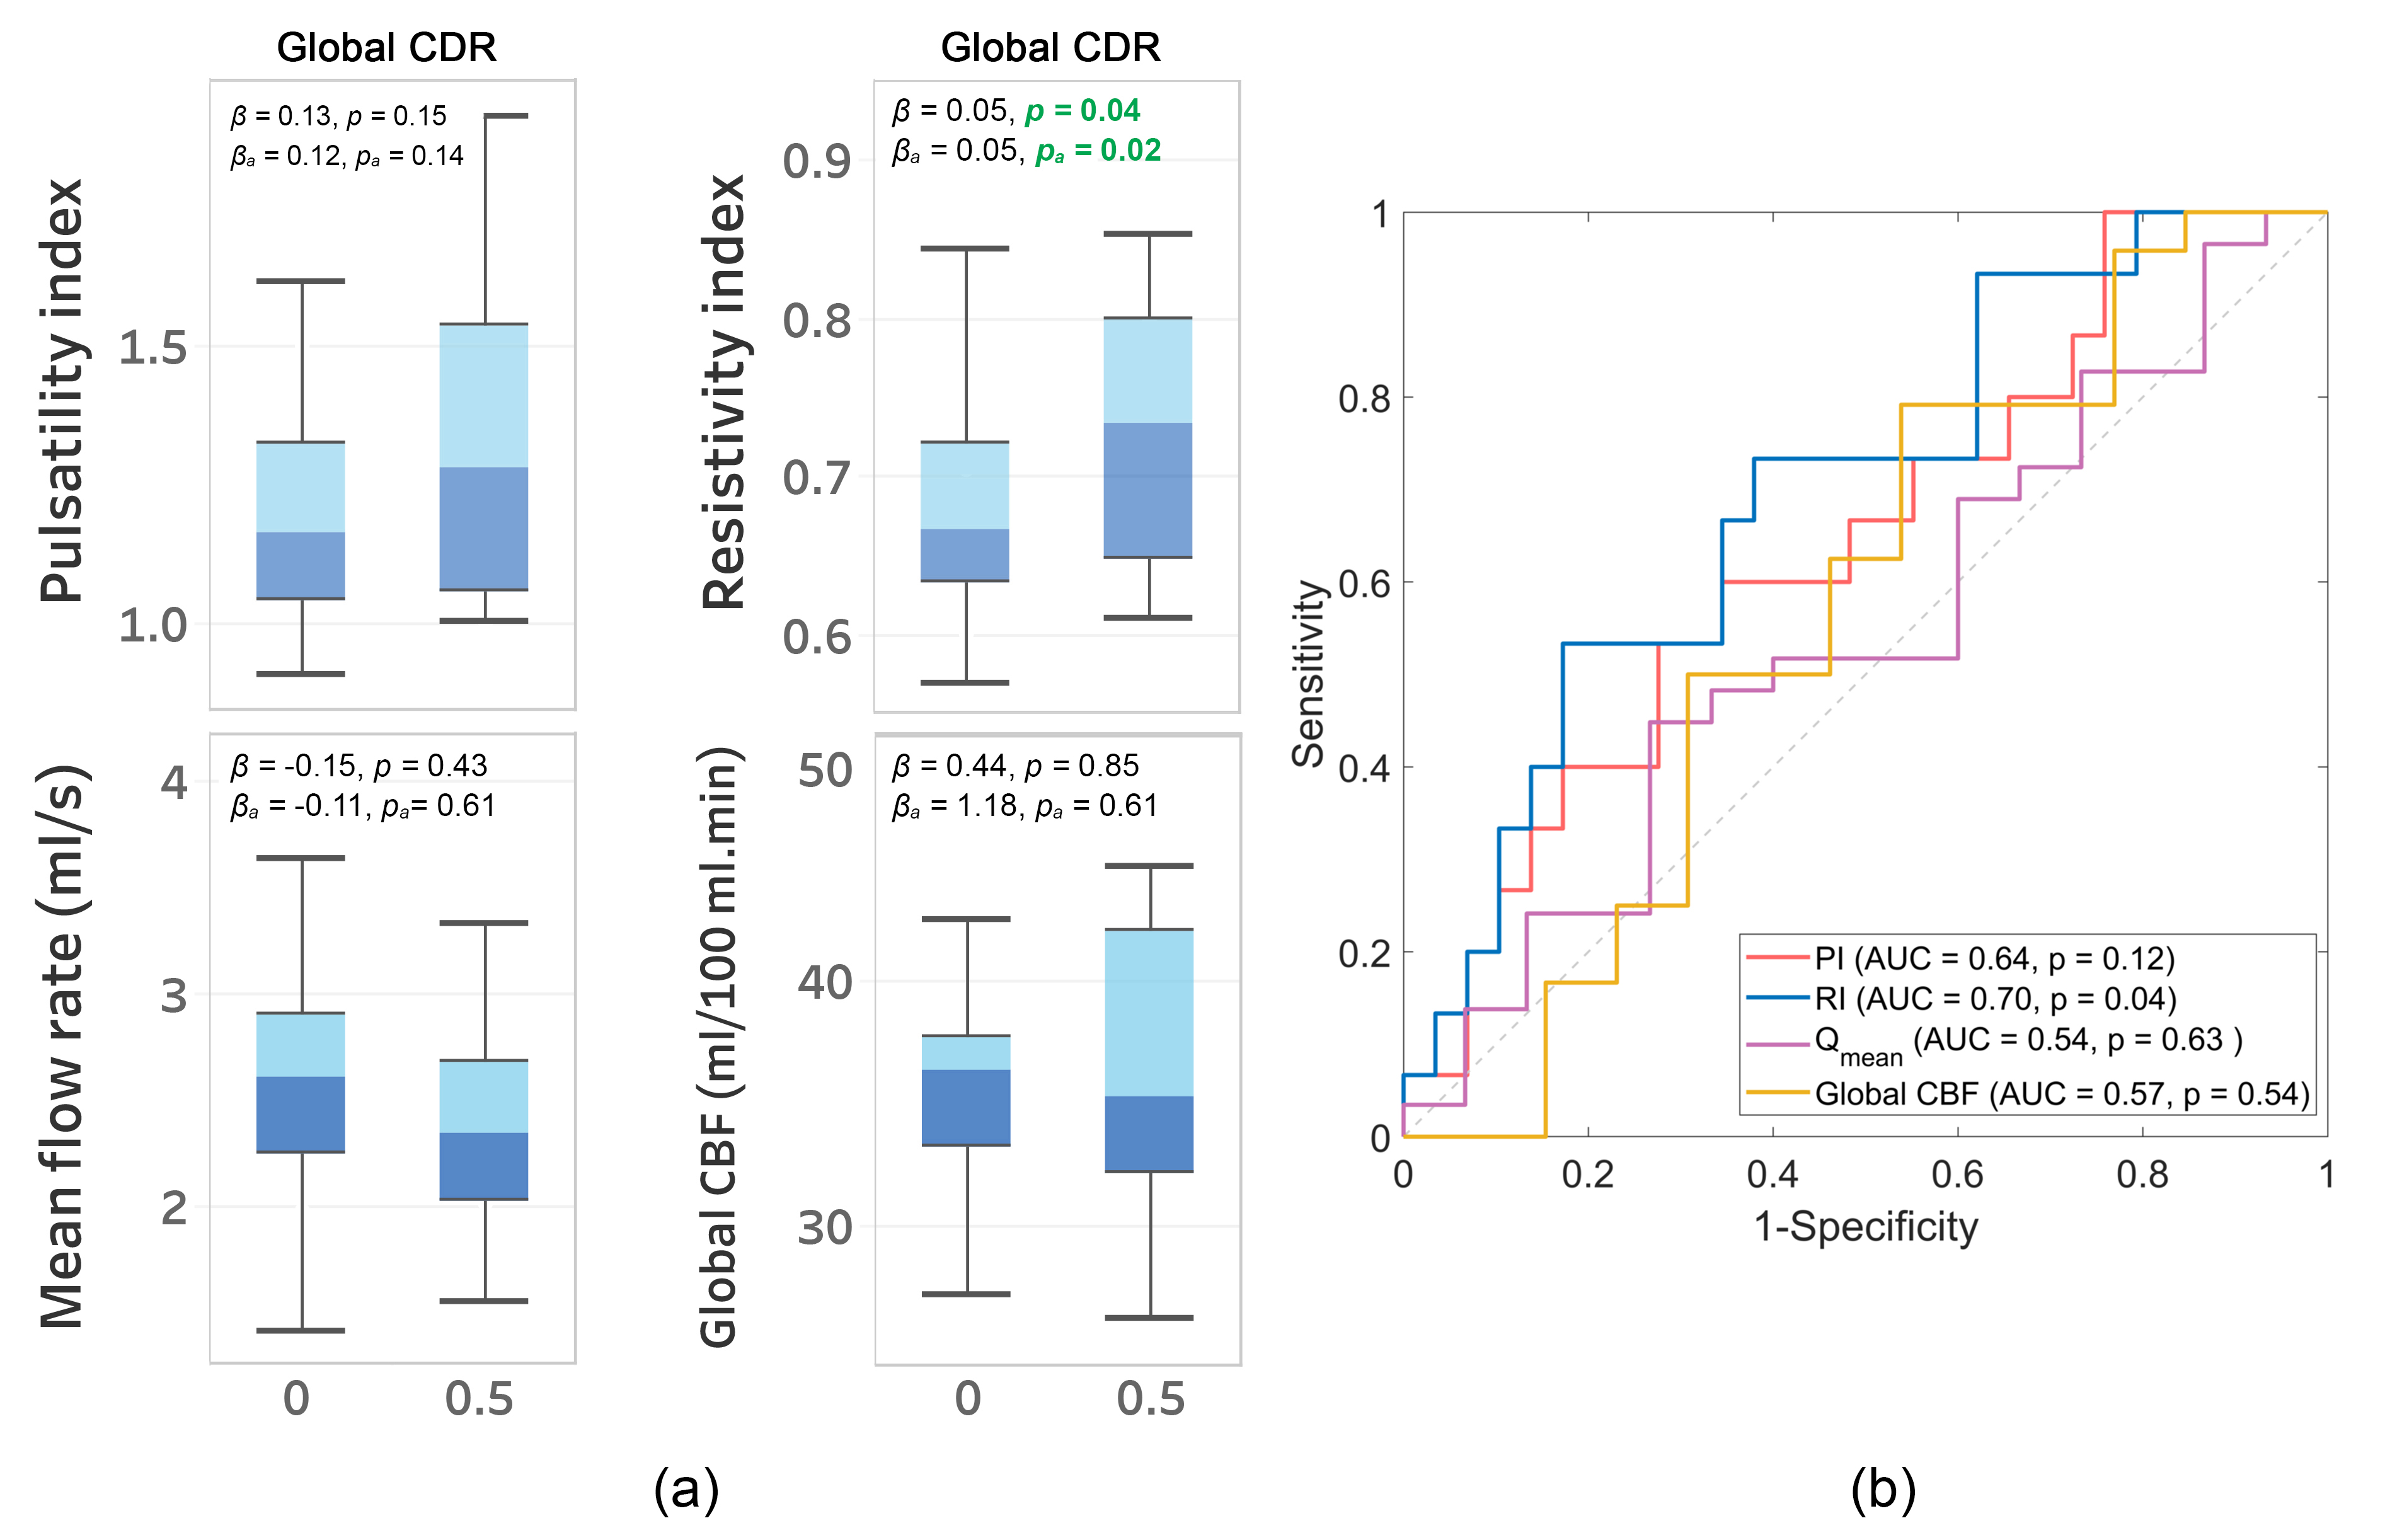
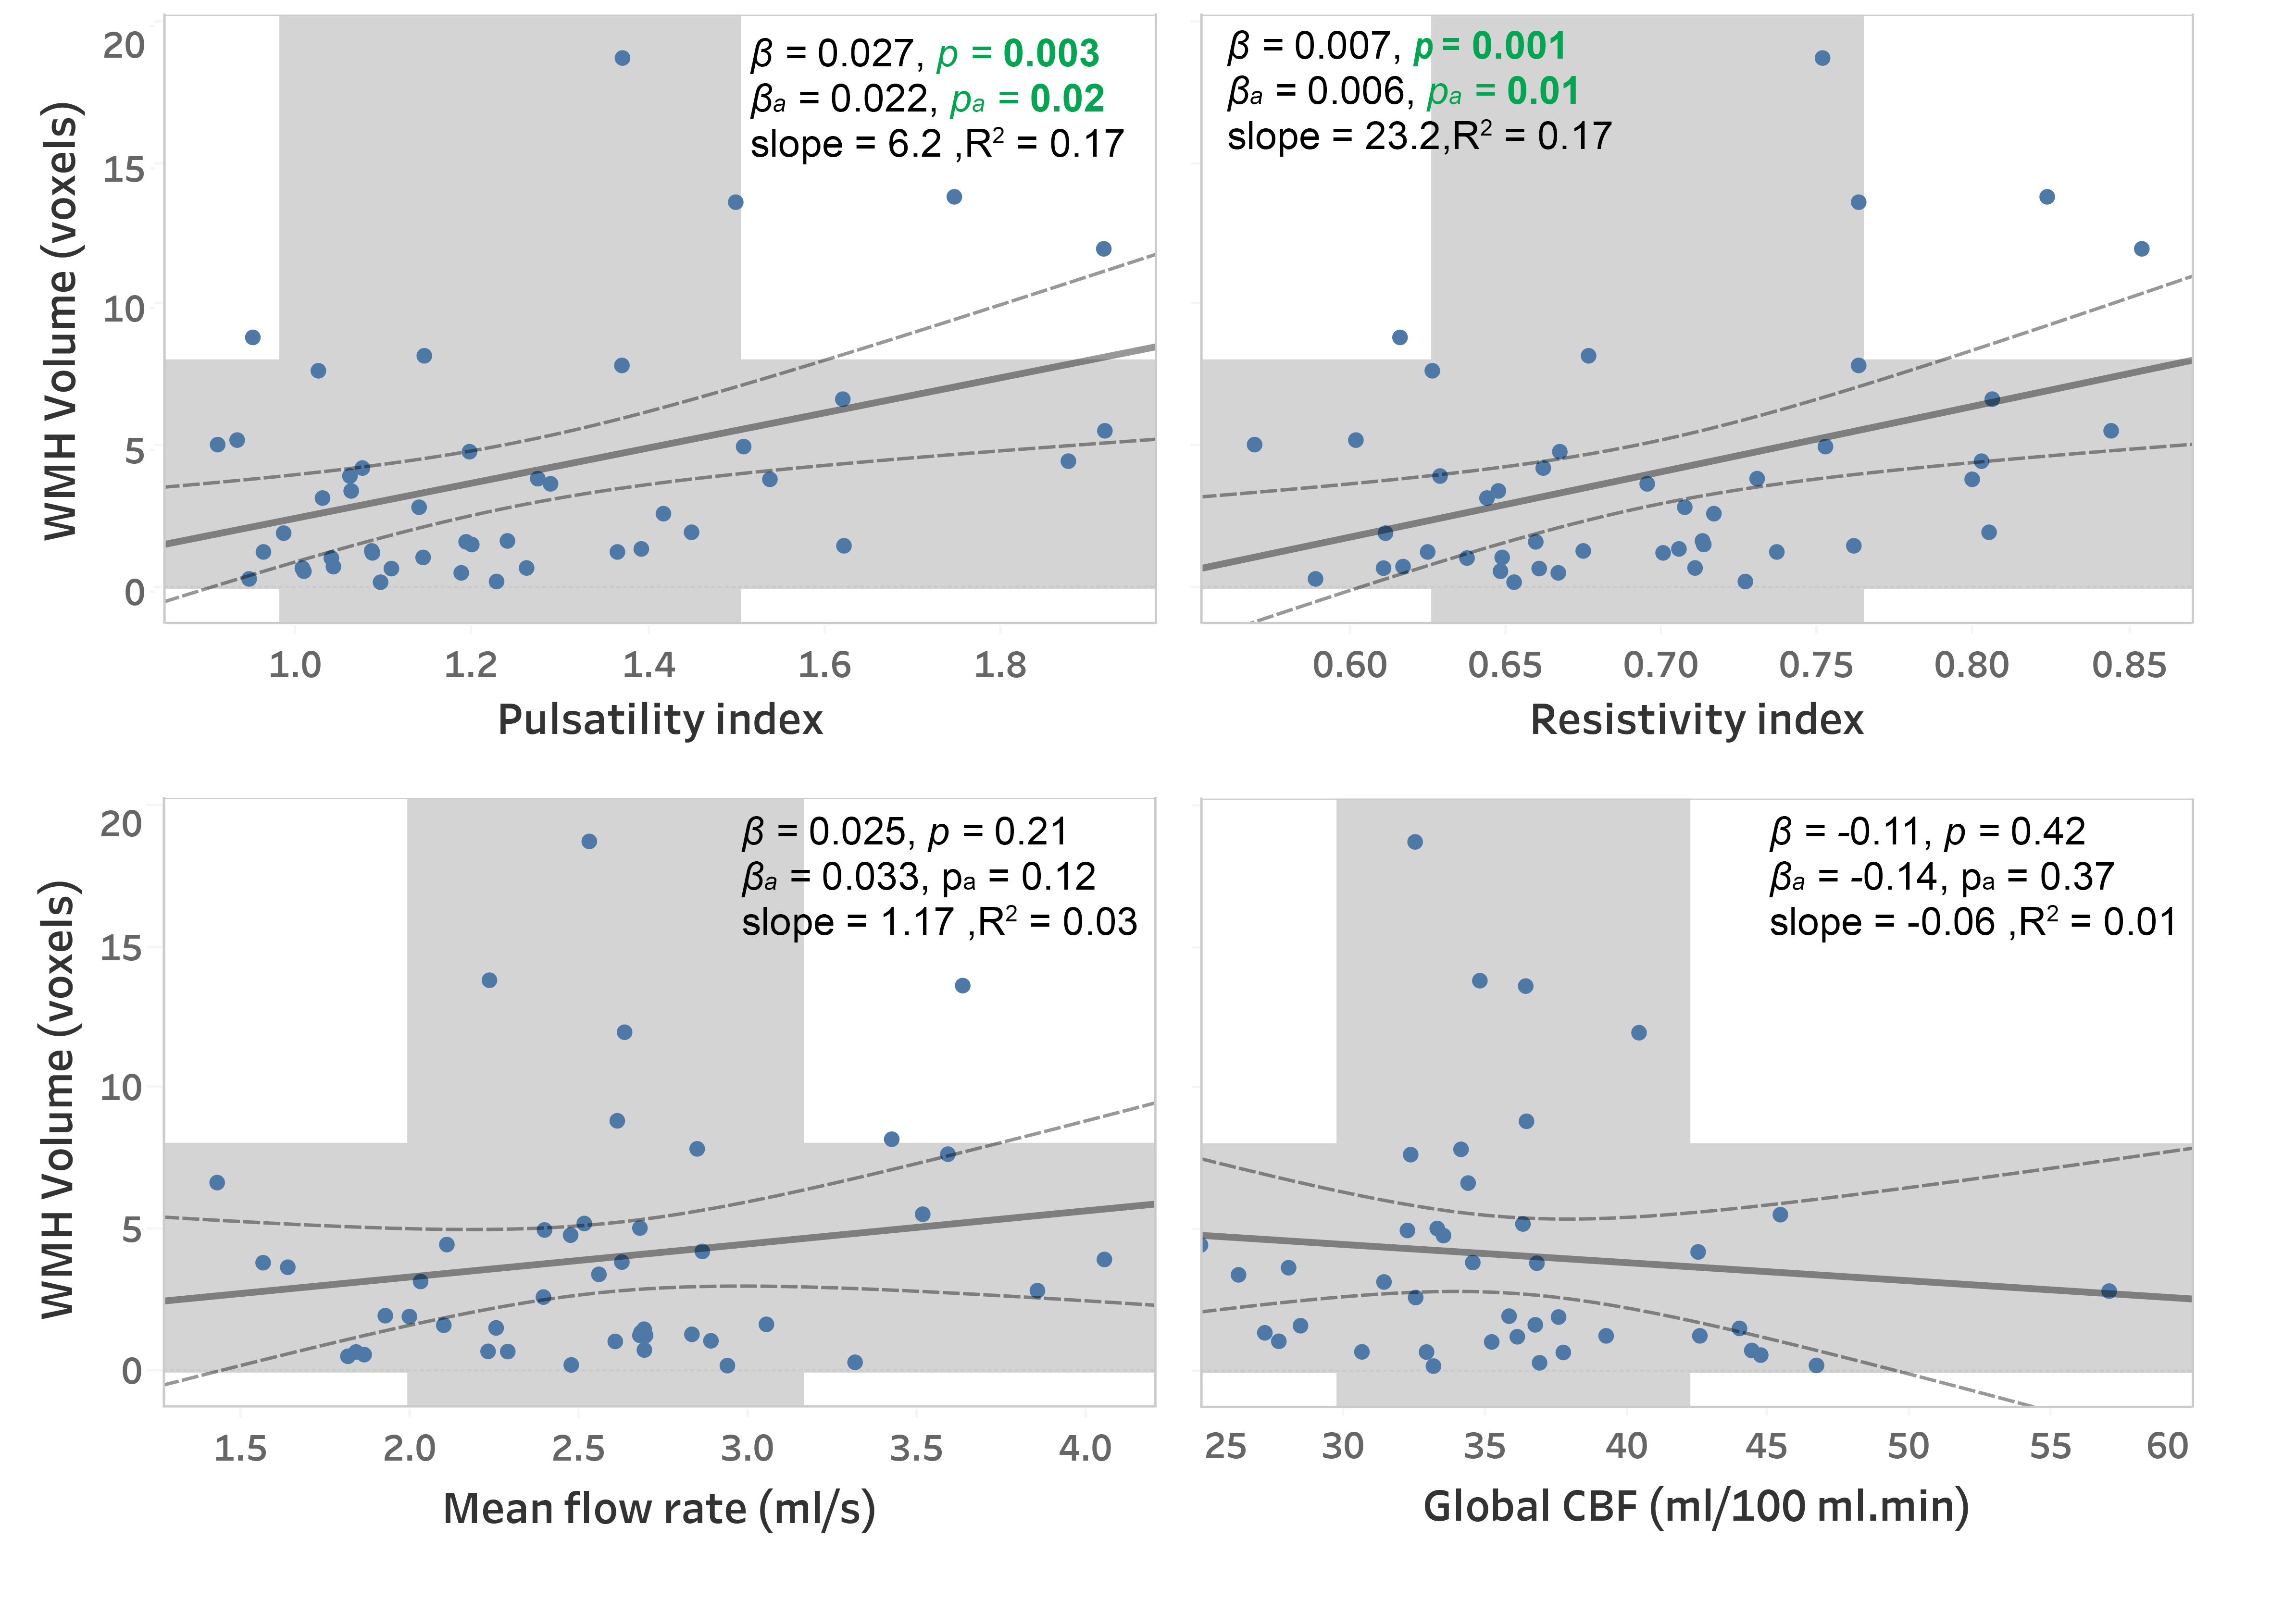
Close correlations and high ICC values were observed between repeated measurements of PI (r=0.93, ICC=0.92) and RI (r=0.91, ICC=0.91) indicating a good test-retest reproducibility for these measurements (figure 2). Elevated RI was significantly associated with cognitive decline quantified using MoCA (p=0.04, Figure 3) and global CDR (p=0.02, Figure 4-a) with adjustments for age, gender, and education. From the ROC analysis, the area under curve (AUC) was significantly different from 0.5 only for RI (AUC=0.7, p=0.04), indicating better sensitivity to cognitive decline for RI, compared to PI and other non-pulsatile hemodynamic measures (Figure 4-b). PI and RI were both significantly associated with WMH volume (p=0.02, p=0.01, respectively, Figure 5). However, non-pulsatile hemodynamic measures including mean flow rate and gCBF were not associated with either cognitive impairment or WMH volume.Discussion
The results of the present cross-sectional study suggest that PC-MRI-derived cerebroarterial pulsatility and resistivity indices are associated with cognitive performance and WMH. While the mechanistic link between arterial pulsation and cognitive impairment is not clear yet, it has been suggested that excessive arterial pulsatility can impair cerebral microcirculation by inducing elevated pulsatile stress and hypoperfusion12,13.The significant correlation observed in the current study between PC-MRI-measured RI and cognitive decline is in line with previous findings from TCD studies11,12 and further supports the notion that the increased cerebrovascular resistance and stiffness can lead to vascular and metabolic damages to the brain.Our results showed no significant association between gCBF or mean arterial flow rate and cognitive performance, suggesting that in elderly subjects with mild cognitive impairment, global measures of cerebral blood flow might not be strong cerebrovascular-based indicators of cognitive dysfunction. Our results bear witness to the hypothesis that the increased arterial stiffness and the resulting increase in cerebrovascular pulsatility can act as a protective mechanism to maintain global perfusion, as greater cerebroarterial pulsatility allows higher mean flow rate to be generated for an unchanged mean arterial blood pressure14.
Our finding that PC-MRI-measured PI and RI are associated with the measures of WMH severity indicates that cerebroarterial pulsatility might contribute to cerebral microvascular and brain tissue damage. Consistent with our results, the increased cerebroarterial pulsation has been suggested to cause perivascular shear stress and damage to oligodendrocytes causing dysfunction of the perivascular glymphatic system15.
Conclusion
This study showed that the cerebroarterial pulsatile measures obtained using PC-MRI are more sensitive indicators of cognitive impairment compared to global blood flow measurement and as such, might be useful as potential biomarkers of cerebrovascular dysfunction in neurodegenerative disorders.Acknowledgements
This work is supported by NIH grants of K25-AG056594 and UH2-NS100614, and American Heart Association (AHA) grant 16SDG29630013.References
1. Jellinger, K. Alzheimer disease and cerebrovascular pathology: an update. Journal of neural transmission 109, 813-836 (2002).
2. Knopman, D.S. Cerebrovascular disease and dementia. The British journal of radiology 80 Spec No 2, S121-127 (2007).
3. Stampfer, M. Cardiovascular disease and Alzheimer's disease: common links. Journal of internal medicine 260, 211-223 (2006).
4. Tomek, A., Urbanova, B. & Hort, J. Utility of transcranial ultrasound in predicting Alzheimer's disease risk. Journal of Alzheimer's Disease 42, S365-S374 (2014).
5. Chung, C.-P., Lee, H.-Y., Lin, P.-C. & Wang, P.-N. Cerebral artery pulsatility is associated with cognitive impairment and predicts dementia in individuals with subjective memory decline or mild cognitive impairment. Journal of Alzheimer's Disease 60, 625-632 (2017).
6. Desmidt, T., et al. Ultrasound Measures of Brain Pulsatility Correlate with Subcortical Brain Volumes in Healthy Young Adults. Ultrasound in medicine & biology 44, 2307-2313 (2018).
7. Aribisala, B.S., et al. Blood pressure, internal carotid artery flow parameters, and age-related white matter hyperintensities. Hypertension (Dallas, Tex. : 1979) 63, 1011-1018 (2014).
8. Suri, M.F., et al. Estimated prevalence of acoustic cranial windows and intracranial stenosis in the US elderly population: ultrasound screening in adults for intracranial disease study. Neuroepidemiology 37, 64-71 (2011).
9. Morris, J.C. The Clinical Dementia Rating (CDR). Current version and scoring rules 43, 2412-2412-a (1993).
10. Nasreddine, Z.S., et al. The Montreal Cognitive Assessment, MoCA: a brief screening tool for mild cognitive impairment. Journal of the American Geriatrics Society 53, 695-699 (2005).
11. Yushkevich, P.A., et al. User-guided 3D active contour segmentation of anatomical structures: significantly improved efficiency and reliability. NeuroImage 31, 1116-1128 (2006).
12. de Riva, N., et al. Transcranial Doppler pulsatility index: what it is and what it isn't. Neurocritical care 17, 58-66 (2012).
13. Calviello, L.A., et al. Relationship Between Brain Pulsatility and Cerebral Perfusion Pressure: Replicated Validation Using Different Drivers of CPP Change. Neurocritical care 27, 392-400 (2017).
14. Rickards, C.A. & Tzeng, Y.-C. Arterial pressure and cerebral blood flow variability: friend or foe? A review. Front Physiol 5, 120-120 (2014).
15. Jolly, T.A., et al. Early detection of microstructural white matter changes associated with arterial pulsatility. Frontiers in human neuroscience 7, 782 (2013).
Figures